Project - Data Handling and Interpolation
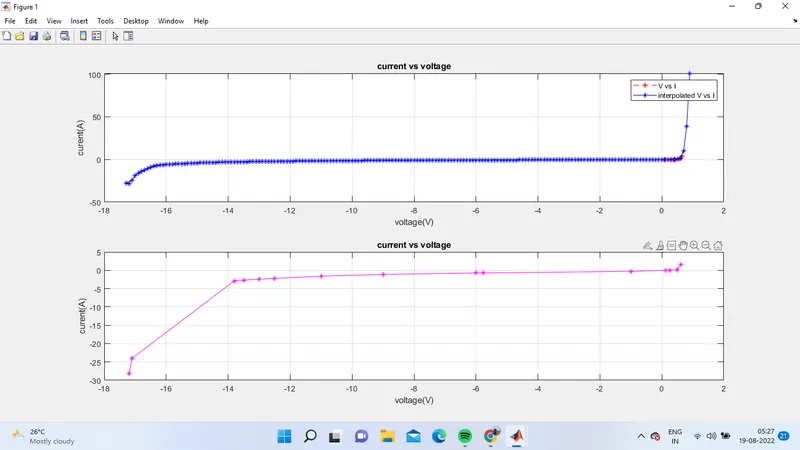
1)In a laboratory experiment, data of voltage and current has been recorded and the same is attached in an excel file ( VI.xlsx ). Read the excel file in the Matlab program and perform the interpolation in the range of -17.3:0.1:0.9. Generate the interactive plot for the interpolated data. Additionally, compute the current values for given voltages below and store them in a text file.
clc
clear all;
close all;
A=xlsread('VI.xlsx'); % reading an excel file
v= A(:,1);% getting the values of v from the excel data
i= A(:,2);%geting the value of i from the excel data
subplot(211);
plot(v,i,'r--*');% ploting the graph for v VS i
hold on;% holding the plot
B= -17.3:0.1:0.9;
y=interp1(v,i,B,'spline'); % using inperpolation command to get the values of i for given voltage
subplot(211);
plot(B,y,"b-* ");% ploting graph for interpolated data
title('current vs voltage'); % adding title
xlabel('voltage(V)');%labeling Y axis
ylabel('curent(A)');% labeling x axis
legend('V vs I','interpolated V vs I');
grid on;
VV =[-17.2 -17.1 -13.8 -13.5 -13.0 -12.5 -11 -9 -5.76 -6 -1 0.11 0.25 0.5 0.61]; % given voltage reading
y1=interp1(v,i,VV,'spline');% using inperpolation command to get the values of i for given voltage
subplot(212);
plot(VV,y1,"m-* ");
title('current vs voltage');% adding title
xlabel('voltage(V)');%labeling Y axis
ylabel('curent(A)');% labeling x axis
grid on;
fid=fopen('voltage vs current.txt','w'); % creating a txt file voltage vs current.txt
fprintf(fid,'%d\n',y1); % entering the data of interpolated current values to a text file
fclose(fid);
OUTPUT: