Project - Data Handling and Interpolation
PROGRAM CODE :
clear all
v=xlsread('VI.xlsx','A:A'); %%For reading values of V(Volt) from excel file VI.XLSX file.
i=xlsread('VI.xlsx','B:B'); %%For reading values of I(mAmp) from excel file VI.XLSX file.
range=-17.3:0.1:0.9; %%given range stored in variable range
datainterpoled = interp1(v,i,range); %%now interpolated the data for given range range
subplot(121); %%for plotting both data I using Subplot
plot(v,i,':gs','LineWidth',2,'MarkerSize',10,'MarkerEdgeColor','b','MarkerFaceColor','w');
title('Data without Interpoled');
xlabel('voltage');
ylabel('current');
grid;
subplot(122);
plot(range,datainterpoled,'-oy','MarkerFaceColor','m','linewidth',2);
title('Interpoled Data');
grid;
xlabel('voltage');
ylabel('current');
OUTPUT FIGURE :
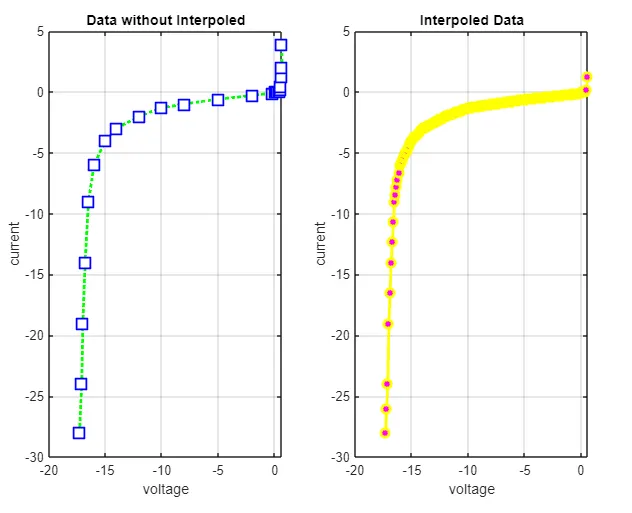
%% Now for Computing the current values for given voltages and storing them to a text file.
VV =[-17.2 -17.1 -13.8 -13.5 -13.0 -12.5 -11 -9 -5.76 -6 -1 0.11 0.25 0.5 0.61];
currentvalues=interp1(v,i,VV); %% Now for Computing the current values
currentvalues
currentvalues =
Columns 1 through 13
-26.0000 -24.0000 -2.9000 -2.7500 -2.5000 -2.2500 -1.6500 -1.1500 -0.7013 -0.7333 -0.1889 0 0
Columns 14 through 15
0.1700 1.6100
writematrix(currentvalues,'currentvalue.dat','Delimiter','space'); %%For write the compute value to a %text file.
type currentvalue.dat %%For verifying data stored
-26 -24 -2.9 -2.75 -2.5 -2.25 -1.65 -1.15 -0.7013 -0.733333333333333 -0.188888888888889 0 0 0.17 1.61