Project
Aim :
To study system level simulation of an all terrain vehicle and explain the results.
Theory :
All Terrain Vehicle
An All Terrain Vehicle that travels om low pressure tires,with a seat that is straddled by the operator,along with handlebars for steering control.it is designed to handle a wider variety of terrain than most other vehicles.ATV's come inmany different shapes and sizes.the differnt types of ATC's are disugned and manufactured for different usea including racing ,pit vihicles,recreation,hunting,ranching military,emergency service and industrial usage.
Continuously Variable Transmission :
A continuously variable transmission ,also known as a shiftless transmission, step less transmission,pulley transmission is an automatic transmission that can change seamlessly through a continuous range of effective gear ratios.the CVT does not strictly require the pressure of a clutch. nevertheless, in some cases, acentrifugal clutch is added to facilitate a neutral stance, whcih is useful when idling or manually reversing.
THe model taken for the study is BAJA ATV model with CVT.
Explanation:
Here we need to do the following study :
- BAJA ATV model without dasboard
- BAJA ATV model with dashboard
- BAJA ATV model using lookup table without dashboard
- BAJA ATV model using lookup table with dashboard
Study A :
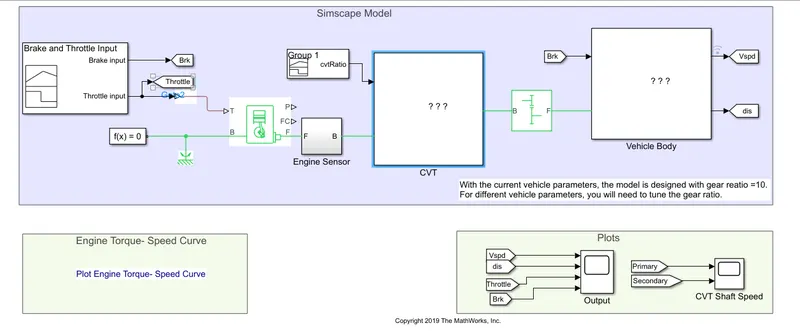
The study on BAJA ATV model with CVT consists of signal builder with throttle and brake input for driver ,generic engine, motion sensors,dimple gear,vehicle transmission,vehicle body with tire and solver configuration
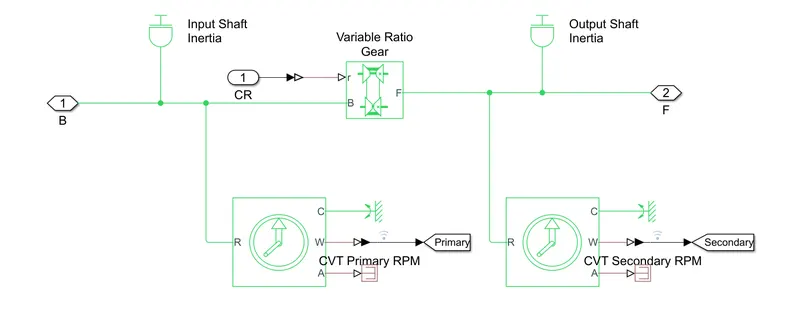
The CVT subsystem consists of variable ratio transmission block,Ideal rotational motion sensor,input shaft inertia,motion sensor and output shaft inertia as shown in figure
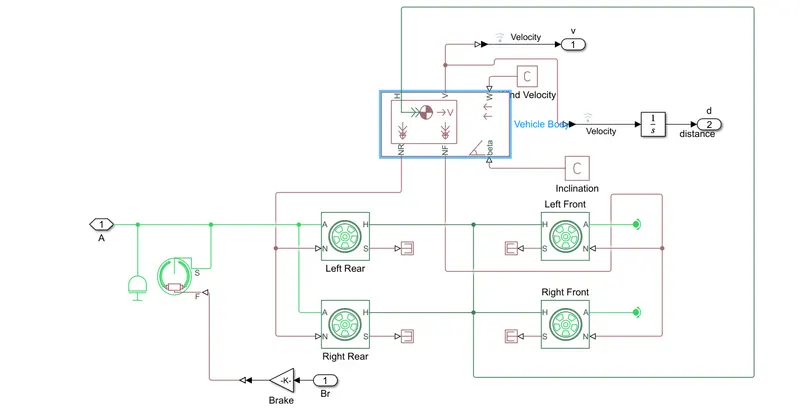
The vehile body subsystem includes vehcle body block,double drum brake and tires as shown below
Vehicle Body :
- Initial engine RPM : 2100 rpm
- Mechanical rotation for drive and driver pulley =0.8 &.7
- Mass of vehicle =250kg
- Front and rear axle with 4 wheel
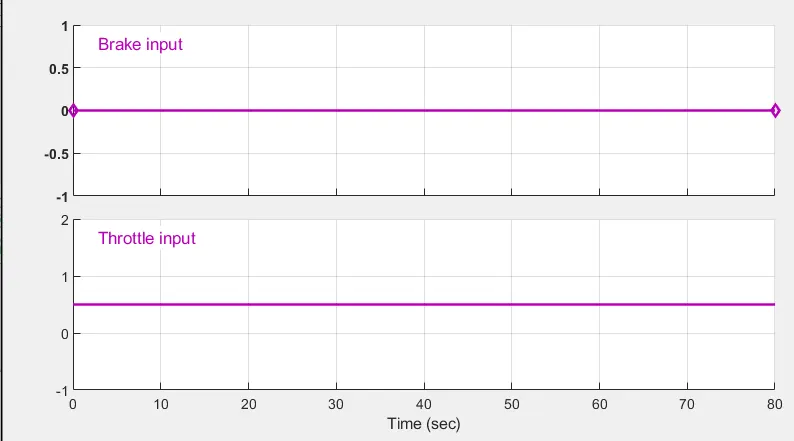
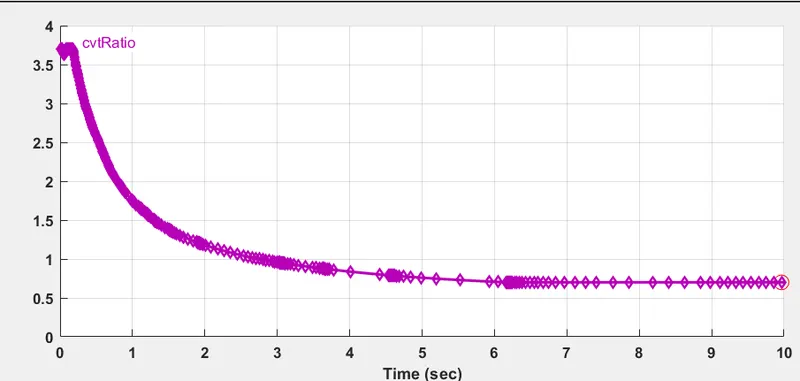
The input is provided using the signal builder for brake ,throttle and gear ratio. Here the value for the brake is taken as zero for entire simulation, throttle value is given as 0.5 through out the simulation i.e. 80 sec.As we know as throttle value increases then power increasesby excess input of fuel into sysytem and shows in th output also increasing.The value of gear ratio is gradually deacresing starting from 3.7 to 0.7 .
Study B :
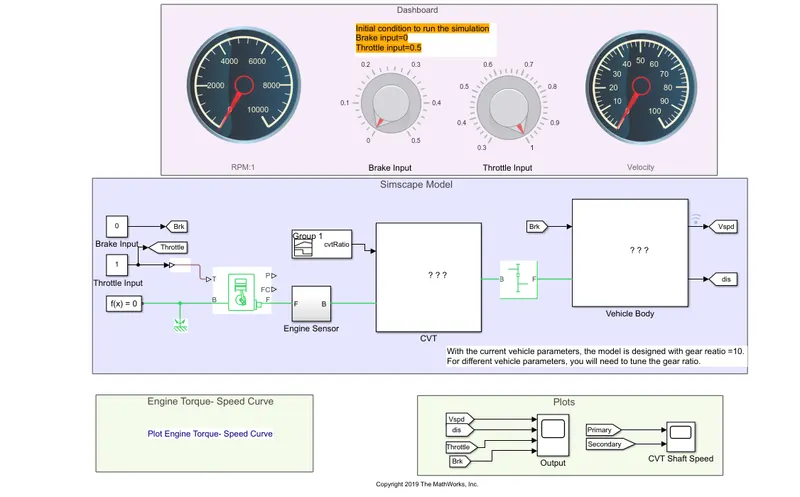
The study is based on BAJA ATV with dashboard as shown in figure above here the input data throttle and brake input are given from the dashboard insted of input with the help of signal builder . All the remaining blocks are the same as in study A. The main intension behind the usage of the dashboard is to study the output value with variation in input values of throttlr and brake, which will give the value of rpm and velocity of the engine in the digital reading.Here the value for the brake is taken as zero for entire simulation, throttle value is given as 0.5 through out the simulation i.e. 80 sec.As we know as throttle value increases then power increasesby excess input of fuel into sysytem and shows in th output also increasing and vice versa.The value of gear ratio is gradually deacresing starting from 3.7 to 0.7 .
Study C :
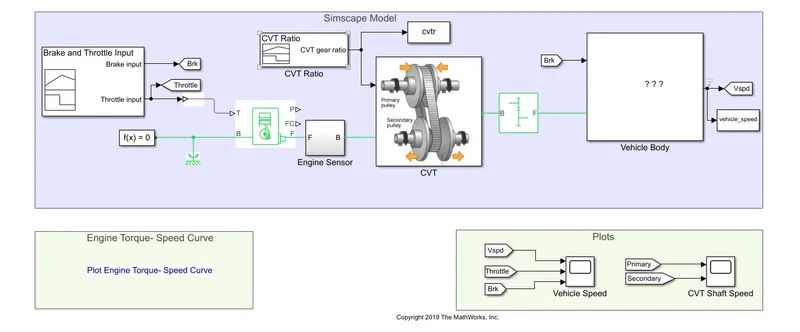
The above simulink model of BAJA ATV with CVT includes the step time,generic engine,motion sensors,vehicle transmission,vehicle body, tires and sovler configuration. The CVT system includes a lookup table, an array of data that maps input values to output values, thereby approximating a mathematical function. If we give an input set of values , a lookup operation retrieves the corresponding output values from the table. If the lookup table does not explicity define the input values then the simulink can estimate output value using interpolation, extrapolation or rounding :
- Interpolation : It is the process of estimating values that lie between known data points.
- Extrapolation : It is the process of estimating values that lie beyond the range of known data points.
- Rounding : It is the process of approximating the values by altering its digit according to a known value.
The brake and throttle input is given by step time, which depends on the run time and it varies accordingly. By using the lookup table for the gear ratio and it gives the input to the CVT part and accordingly obtains the output. This method works in a closed loop and the inputs are given with the lookup table dada. Here the simukink gets the input values from the lookup tables and according to the values from the input ,the output is got in terms of gear ratio.
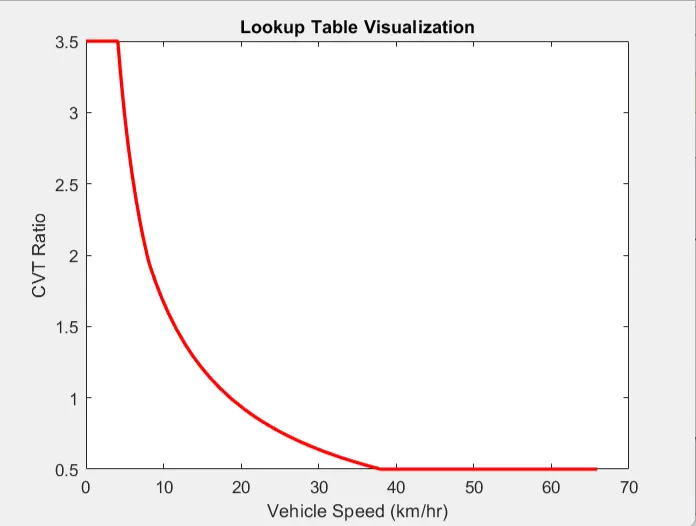
with gear ratio varies from the range of 3.5 to 0.5 and the output in terms of velocity is got as for the range of gear ratio at a maximum values of nearly 67 kmph.
Study D :
The above study based on the BAJA ATV with the dashboard model using the lookup table which consists of throttle and brake meters in the dashboard. With the help of the dashboard , we can see the variation of the output with the input values been varied. Here as we know the gear ratio is input from the lookup table and the simulink will give the output with respect to input values. The gear ratio is directly proportional to the torque. As we know that as throttle increases then the power increases by excess input of fuel into the sysytem and shows in the output also inceasing.
Results:
Study A:
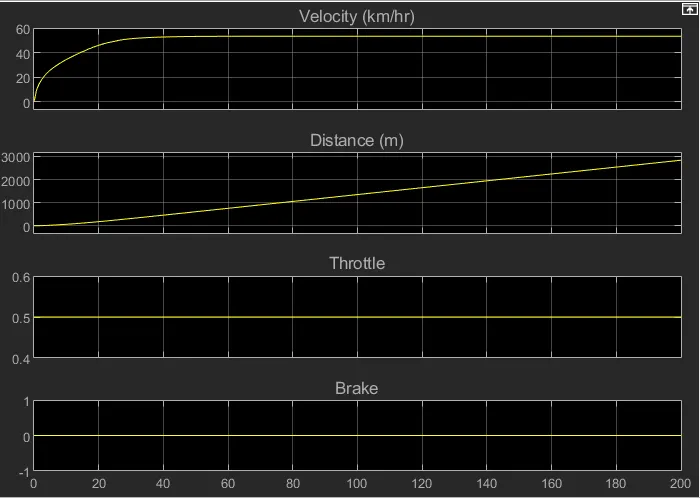
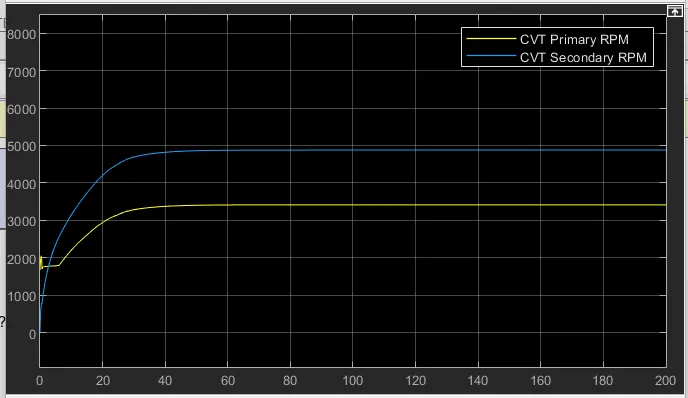
Here the brake value is set a constant i.e. zero and the throttle value is 0.5 through out the simulation time and such that fuel injection happens in a time basics and the velocity part shows as raise in velocity. From the velocity vs time graph as the velocity part increases and set to constant value due to throttle value is constant. In second graphthe ratio is determined by outer ro input diameter so that when the radius of the output part is high then rpm will decreases which is incase reflecting in above figure.
Study B:
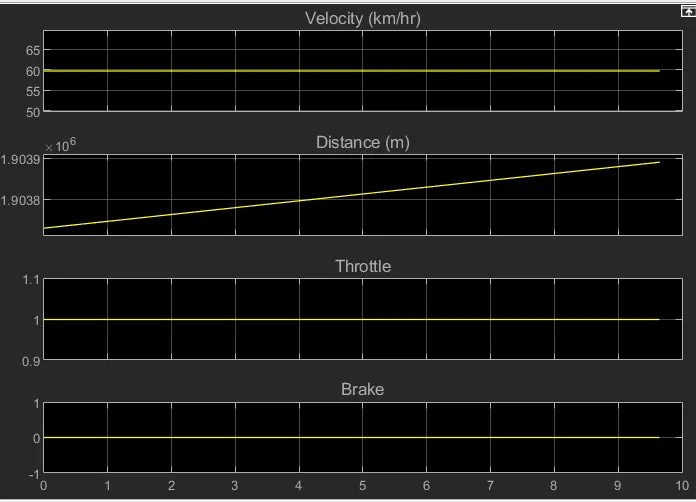
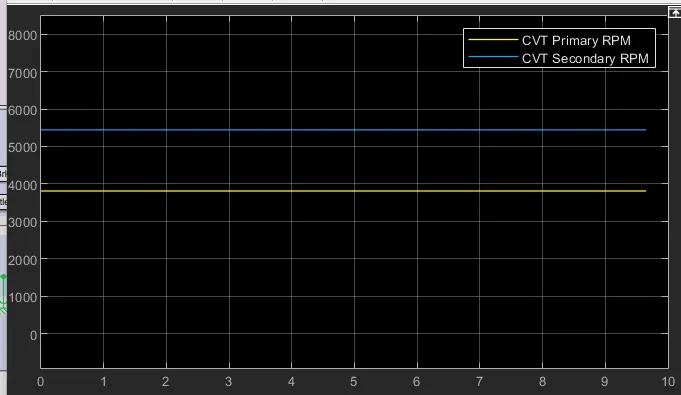
Here the brake value is set a constant i.e. zero and the throttle value is 1 through out the simulation time and such that fuel injection happens in a time basics and the velocity part shows as raise in velocity. From the velocity vs time graph as the velocity part increases and set to constant value due to throttle value is constant. In second graph the ratio is determined by outer ro input diameter so that when the radius of the output part is high then rpm will decreases which is incase reflecting in above figure.
Study C :
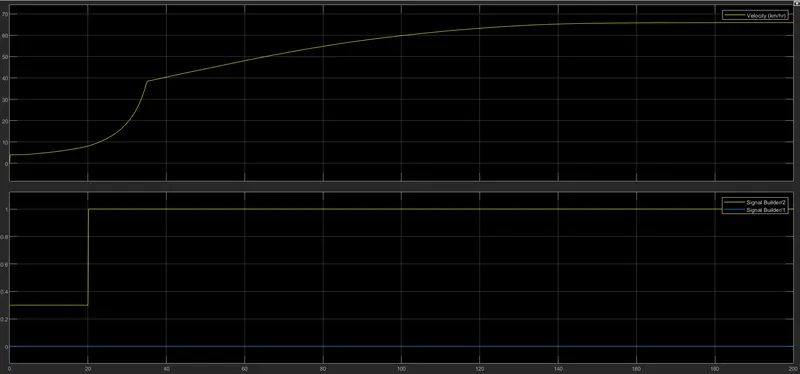
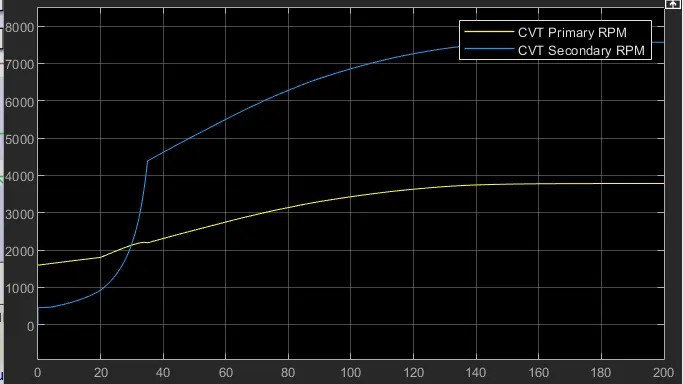
Here the brake value is set a constant i.e. zero and the throttle value is 0.3 for 20sec and then to 1 through out the simulation time and such that fuel injection happens in a time basics and the velocity part shows as raise in velocity. From the velocity vs time graph as the velocity part increases and set to constant value due to throttle value is constant. In second graph the ratio is determined by outer ro input diameter so that when the radius of the output part is high then rpm will decreases which is incase reflecting in above figure.
Study D:
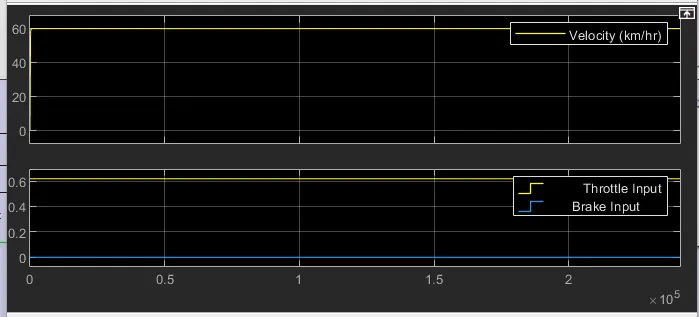
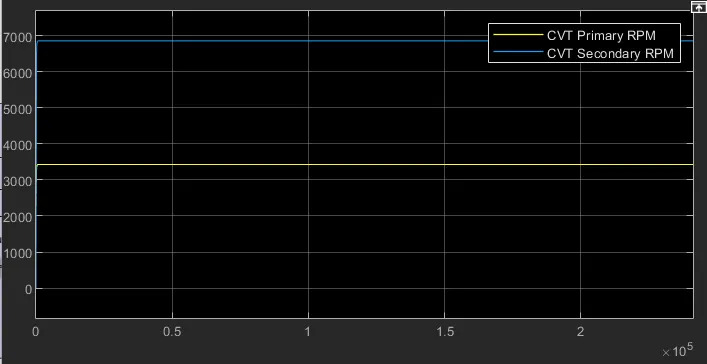
Here the brake value is set a constant i.e. zero and the throttle value is 0.62 through out the simulation time and such that fuel injection happens in a time basics and the velocity part shows as raise in velocity. From the velocity vs time graph as the velocity part increases and set to constant value due to throttle value is constant. In second graph the ratio is determined by outer ro input diameter so that when the radius of the output part is high then rpm will decreases which is incase reflecting in above figure.