Project
AIM: To study the system level simulation of an all terrain vehicle.
KEYWORDS:CVT,LOOKUP table,dashboard,baja ATV
SOFTWARE:matlab,simulink
OBJECTIVE:
1.study the baja ATV model without dashboard.
2.study the baja ATV model with dashboard.
3.study the baja ATV model using lookup table without dashboard.
4.study the baja ATV model using lookup table with dashboard.
INTRODUCTION: Transmission, which transmit the power from engine to the wheels through the shafts. it consists of 4 types mainly,
. manual transmission
.continous variable transmission
.semi-automatic transmission
.automatic transmission
A continuously variable transmission, or CVT, is a type of automatic transmission that provides more useable power,better fuel economy and a smoother driving experience than a traditional automatic transmission. The CVT is a system that makes it possible to vary stepless the transmission ratio without interruption of the torque flow. Therefore an infinite number of ratios(between a minimum and maximum value) are possible. it is an automatic, single speed,and gearless transmission that can shift through an infinite number of gear ratios. this ability to seamlessly shift through these different gears provides a number of benifits including extremely smooth shifts and exceptional fuel economy.A CVT draws top engine power from a small engine, which gives drivers quicker acceleration than standard automatic transmissions.because of emissions.CVTs are also lighter weight than traditional automatic transmissions.
STUDY 1:-
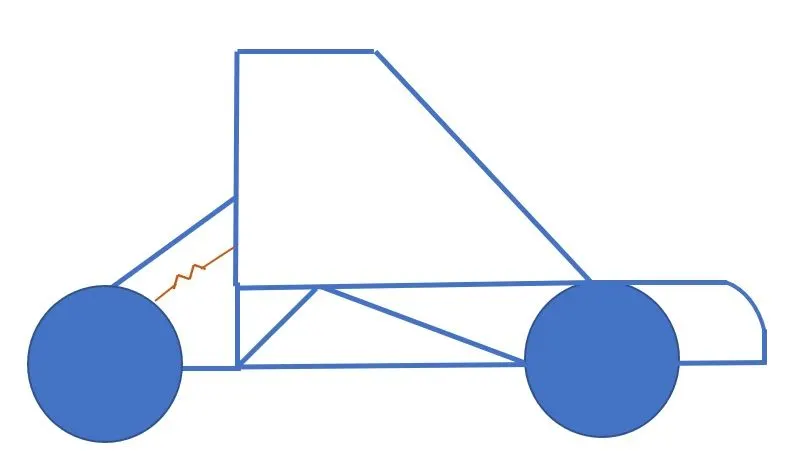
By using simulink model of CVT consists of signal builder, generic engine,motion sensors vehicle transmission vehicle body tyres and solver coinfiguration blocks etc, as shown in figure-1. the CVT subsystem includes transmission block, input and output shaft inertia and motion sensors as shown in fig-2. the vehicle body subsystem includea vehicle body block, double drum brake and tyres as shown in figure-3. the initial engine speed is given as 2100 rpm , mechanical rotation for driven pulley and driver pulley as 0.8& 0.7 respectively.The mass of the vehicle as 250kg and 2 axles which connects 4 wheel accordingly.
The signal builder is used as input for brake ,throttle and gear ratio,brake input is maintainedas 0 for overall simulation. The throttle is given as 0.3 for 20 secs and increases to 1 for overall simulation . thr throttle valve is mainly to control the flow or amount of fuel into the engine. if the throttle value increases the flow of fuel increases to the IC engine which inturn increases the power of the engine. the gear ratio is maintained as 2.3 for 5 secs and linearly decreases to 1.8 and maintained constant for overall simulation as shown in figure(4-5).
figure-6.
the above figure shows baja atv with dashboard model which throttle meter and brake input in the dash board instead of giving input through signal builder. rest of the blocks and subsystems are common in the above baja atv model without dash board is study the results by varying the input of brake and throttle, which shows that the velocity and speed of the engine.The gear ratio is mainted as 2.3 for 5 secs and linearly decreases to 1.8 and maintained constant for overall simulation as shown in figure5.as the brake input varies from0-0.5, the velocity and speed decreases accordingly. by increasing the throttle, the velocity and speed of the engine& shaft increases.
Study3;-
by using simulink model of cvt consists of step time, generic engine, motion sensors, vehicle transmission,vehicle body, tyres and solver configuration blocks etc, as shown in figure-7, the cvt subsystems includes lookup table,TRANSMISSION BLOCK, INPUT and output shaft inertia and motion sensors as shown in figure-8, the vehicle body subsystems includes vehicles body block, double drum brake and tyres as shown in figure-9, the intial engine speed is given as 2100rpm, mechanical rotartion for driven pulley as 0.8&0.7 respectively. the mass of the vehicle as 250kg and axles which connects 4 wheel accordingly.
A lookup table is an array of data that maps input that maps input values to output values, thereby approximating a mathamatical function. Given a set of input values to output values to output values, thereby approximating a mathamatical function. given a set of input values,a lookup operation retrives the corresponding output values from the table. if the lookup operation retrives the corresponding output values from the table, if the lookup table does not explicity define the input values, simulink can estimate an output value using interpolation , extrapoltaion , or rounding where;
. an interpolation is a process for estimating values that lie between known data points.
. an interpoltation is aprocess for estimating values that lie between known data points.
. an extrapoltaion is a process for estimating values that lie between known data points.
. a rounding is a process for approximating a value by altering its digits according to a known rule.
figure;9
The brake input and throttle input is given by step by step time, which depends on the run time and varies accordungly. by using lookup table for gear ratio which takes as input. this method is very effective which can avoid the unused torque at the certain speed and very easy to achive greateer velocity & engine speed at the certain speed and very easy to achive greater velocity& ENGINE speed. it works as closed loop when the input is given by lookup table. the simulink get the input value from lookup table and obtain the result according to the input values of gear ratio. the gear ratio varies from 2.3 to 1.8 as taken as input and output interms of velocity. themaximum velocity reached as 57 kmph approxmately.
Figure-11;
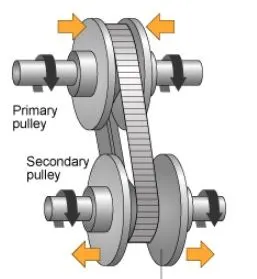
The above figure shows Baja ATV with dashboard model using lookup table which consists throttle meter and brake input in the dash board and indicated as constant block. rest of the blocks and subsystems are common in the above baja atv model without dash board as shown in figure 8& figure9. the main copncept of using dashboard isstudy the result by varying the input of brake and thrittle, which shows that the variation odf velocity and speed of the engine. the gear ratio is given by lookup table. simulink get the input value from the lookup table and obtain thr result according to the input value from the lookup table and obtain the result occording to the lookup table. as the brakeinput varies from 0-0.5, the velocity and speed decreases accordingly which inturn the gear ratio also decreasing. by increasing the throttle, the velocity and speed of the engine &shaft increases. the transmission as primary pulley increases by compacting and the radius of secondary pulley in which the radius of primary pulley increases by compacting and the radius of secondary pulley increases by compacting and the radius of secondary pulley decreases as the gear ratio varies. the torque also varies. gear ratio is directly, propotional to the torque, which increases by increasing the gear ratio. at the max torque, the speed and velocitry is decreases.
FIGURE-12
In the above figure, the brake is maintained as constant and increases in throttle which shows increases in velocity. the flow of fuel is increaseswhen the throttle increses from 0.3 to 1, thus the power in the engine increses. the torque reaches approximately 7n-m at 1.8 gear ratio, which defines that gear ratio is directly proportional to the torue. by the gear ratio, the speed & velocity can achive maximum.
Figure-13
in the above figure, the primary shaft reaches high speed and secondary shafdt as low rotational speed because the radius of the primary shaft as more than thr secondary shaft, the speed is directly propotional to the radius increases the speed of the shaft also increases.
figure-14
in the above figure, the velocity of the vehicle is maintained as constant for constant throttle value as 0.3 and varying by increasing the value of throttle whivh increases thr velocity of vehicle. by increasing the brake input, the velocity of the vehicle decreasing accordingly which shown in figure14.
figure-15
in the above figure, the primary shaft speed increases by increasing throttle and decreasing by increasing brake input value, which defines that the throttle can fklow more amount of fuel which increase the power of the engine and similar to the secondary shaft the radius of the primary shaft as more than the secondary shaft, the speed is directly proportional to the radius of the shaft. as the radius increases the speed of the shaft also increases.
figure-16
in the above figure, the brake is maintained as constant and increase in throttle which shows increses in velocity. the flow of fuel is increases. the torque reaches approxmately 7n-m at 1.8 gear ratio, which define that gear rato is directly proportional to the torque. by this gear ratio, the speed & velocity can achive maximum. the gear ratio is assigned in lookup table and given as input to the simulink which reads every input value and obtain the result according to the input.
figure-17
in the above figure, the primary shaft speed increses by increasing throttle and decreasing by increasing brake input value, which defines that the throttle can flow more amount of fuel which increases the power of theengine and shaft as more than the secondary shaft, the speed is directly proportional to the radius of the shaft as the radius increases the speed of the shaft also increases.
fogure-18
in the above figure, the velocity of the vehicle is maintained as constant for constant throttle value as 0.3 and varying by increasing the brake input, the velocity of the vehicle decreasing accordingly which shown in figure18. by using lookup table. it works as closed loop by recording the velocity value and we can get at any particular value of gear ratio which is beyond the range or any random value within the range by using extrapolation by lookup table.
figure-19
in the above figure, the primary shaft speed increcreasing by increasing brake input value, which define that the increasing the power of the engine and similar to the secondary shaft, the speed is directly proportional to the radius of the shaft as more than the secondary shaft, the speed is directly proportional to the radius of the radius of the shaft.as the radius increases the speed of the shaft also increases. the throttle value and brake input value can be varying in dasgboard, so we can get any particular value for input.
CONCLUSION:
1.as the throttle increases, the velocity also increases also increases which inturn the power in the engine also increases.
figure-20
in the above figure, at the begining the speed reducing because of gear ratio and torque output, when the gear ratio increases, the torque increases.
2.as the brake input increases. the velocity decreases and engine power also decreases. at a CERTAIN BRAKE INPUT value the engine may shut down and there is no poweroutput. the engine power is inversly proportional to the brake input.
figure-21
3.as the gear ratio increases, torque increases which inturn the velocity decreases.
figure-22
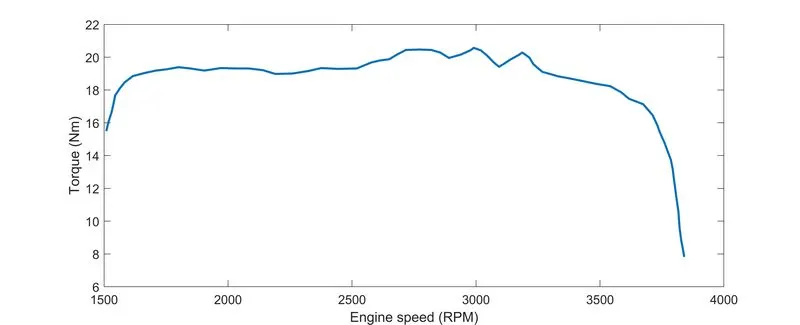
in the above figure, the torque is incresingly by increase in engine speed at a particular point the torque is decreasing when the gear ratio increases in order to achive to achive maximum velocity.
figure-23
in the above figure, the velocity is varying wrt the gear ratio. for the high gear ratio. the torque is more which decreases the velocity. by changing to high gear, the gear ratio become less paralelly the torque also less which can high velocity.
4.with help of lookup table, we can vary any input value amd also get the output value by using interpolar ation method which the simulink can.