Project 4
Project:Lane detection using Hough transform:
Task:
1. Perform a lane detection operation for the given video by implementing Hough transform by extracting individual frames from the images. The video can be seen attached below.
2.Write a detailed report on the process involved and the nature of the output you obtain.
3.The output video for this project must have the lane lines highlighted on the original video.
===//=======//======//======//=====//=====
In this project, I am using Numpy,scipy,Math,Matplotlib and openCV.
Input frame:
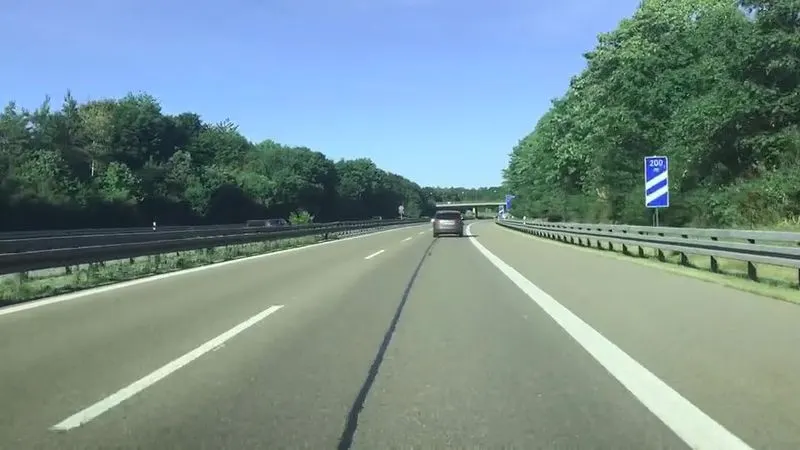
Importing Neccessary libraries
import cv2
import numpy as np
from scipy import spatial
import math
import matplotlib.pyplot as plt
Reading an image
image = cv2.imread('Lane_image.jpg')  #reading an image
plt.imshow(image)                     #shows image
plt.show()
cv2.imwrite('Lane_image.png',image)   #Save image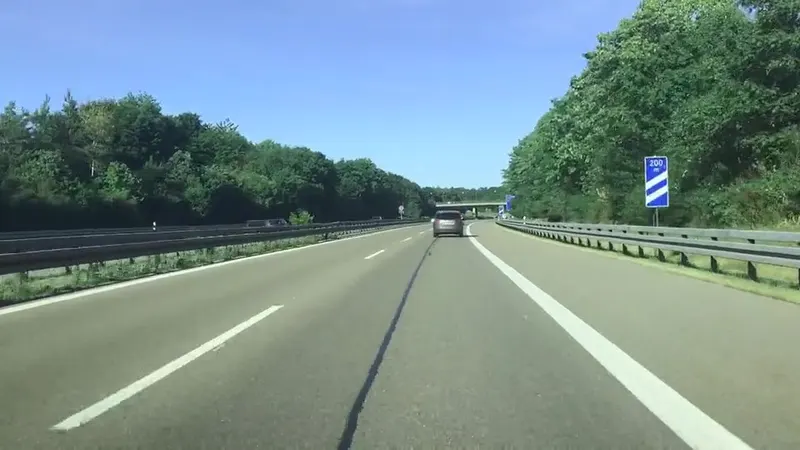
1. Converting to Gray scale image
- Before detecting edges we need to convert our 3 channel(RGB)image into 1 channel grayscale image
using cvtColor() function of cv2
Defining gray_scale() function
#convert to grayscale
def gray_scale(image):
    return cv2.cvtColor(image,cv2.COLOR_BGR2GRAY)
gray_image = gray_scale(image) #converting to grayscale
#plt.imshow(gray_image) #shows image
#plt.show()
cv2.imwrite('gray_image.png',gray_image) # Save image to local directory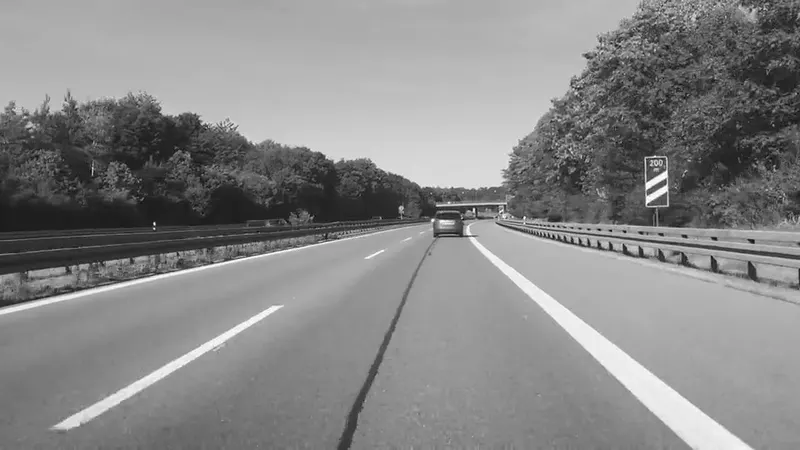
2. Gaussian Smoothing:
- Each of the pixels for a grayscale image is described by a single number that describes the brightness of the pixels.
- In order to smoothen an image,we need to modify the values of a pixel with the average value of the pixel intensities around it.
- Averaging out the pixels to reduce noise will be done by a kernel.This kernel run across our entire image and sets each pixel value equal to the weighted average of its neighboring pixels,thus smoothing our image.In our case we will apply a 5 x 5 Gaussian kernel:
- The follwing gaussian_smoothing function will return image with reduced noise(smooth image).
Defining gaussian_smoothing() function
def gaussian_smoothing(image,kernel_dimensions=(5,5)):
    gaussian_smooth_image = cv2.GaussianBlur(image,kernel_dimensions,0) #Applying gaussian blur to smooth the image
    return gaussian_smooth_image
filtered_image = gaussian_smoothing(gray_image) # calling gaussian smoothing
plt.imshow(filtered_image)
plt.show()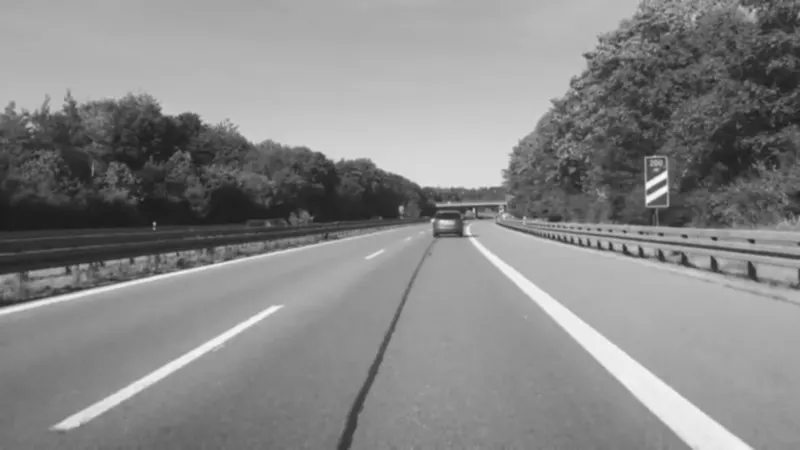
3. Canny_edge_detection
- An edge detection corresponds to the region in an image where there is sharp change in the intensity/colour between adjacent pixels in the image.
- A strong gradient is a steep change and vice versa is a shallow change.so in a way we can say an image is stack of matrix with rows and columns of the intensities.
- This means that we can also represent an image in 2D coordinate space, x axis traverses width(columns) and y axis goes along the image height(rows).
- Canny function performs a derivatives on the x and y axis thereby measuring the change in intensities with respect to adjacent pixels.
- In other words we are computing the gradient(which is change in the brightness) in all directions.
It then traces the strongest gradients with a series of white pixels. - The lower_threshold,upper_threshold allow us to isolate the adjacent pixels that follow the strongest gradient.
If the gradient is larger than the upper threshold then it is accepted as an edge pixels, if it's below the lower threshold then it is rejected.if the gradient is between the thresholds then it is accepted only if it is connected to strong edge. - Area where it's completely black corresponds to low chnages in intensity between adjacent pixels whereas the
white line represents a region in the image where there is a high change in intensity exceeding the threshold.
Defining canny_edge_detector() function
def canny_edge_detector(image,lower_threshold,upper_threshold):  #50,150
    return cv2.Canny(image,lower_threshold,upper_threshold)
canny_img =canny_edge_detector(filtered_image,50,190) #calling canny edge detector
plt.imshow(canny_img)
plt.show()
cv2.imwrite('Canny_image',canny_img)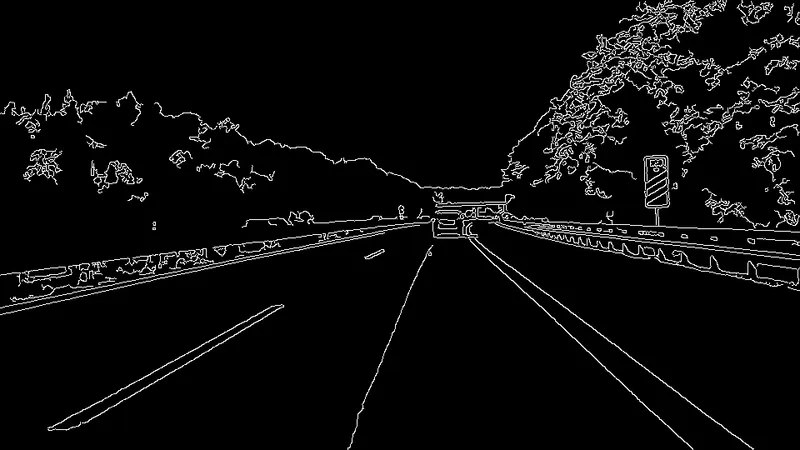
4. Region_of_interest
- The dimensions of the image are chosen which will contain the road lanes and mark it as our region of interest.
- then a mask is created which is same as the dimensions of the image which would essentially be an array of all zeros.
- Now,we fill polygon dimensions in this masked_image with the intensity of 255 so that our region of interest dimensions are white.
- Next,we will do a bitwise AND operation with the canny image and the masked_image which will result in our final region of interest.
Defining Region_Of_Interest() function
def ROI_image(image):
    height = image.shape[0]
    width = image.shape[1]
    image =  np.array(image, dtype=np.float32)

    #polygon_coords = np.array([(0, height), (0, round(height/1.2)), (round(width/2),round(height/2)),(width, height)])

    polygon_coords = np.array([(0,height),(100,360),(540,300),(620,320),(width, height)])
    mask  = np.zeros((height, width))
    masked_image = cv2.fillPoly(mask, [polygon_coords], 255)
    masked_image = np.array(masked_image, dtype=np.float32)
    return cv2.bitwise_and(image, masked_image)
roi_img = ROI_image(canny_img) # calling ROI_ image function
plt.imshow(roi_img)
plt.show()
cv2.imwrite('ROI_image.png',roi_img)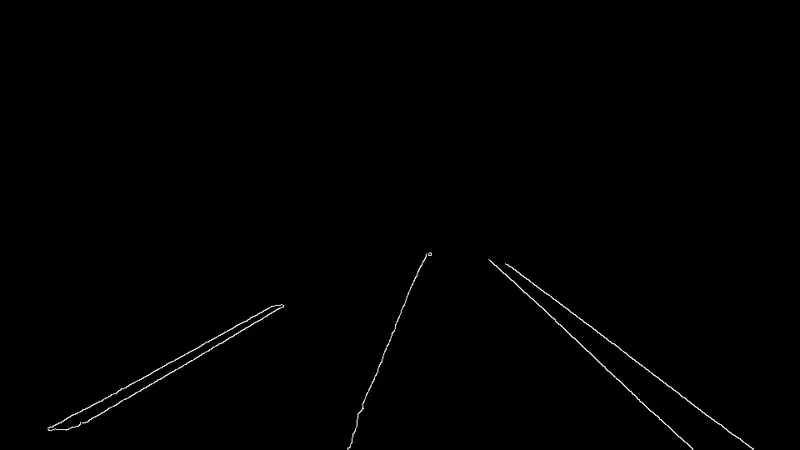
5. Hough Transformation to detect lanes
- We are using Hough transform technique that detect straight lines in the image and thus identify the lane lines.
- As we know that a straight line is reprsented by y = mx + b and slope(m) of line is simply a rise over run.
- If the y intercept and slope is given then the line can be plotted in the hough space as single dot.
- there are many possible lines that can pass through this dot each line with different values of M and B.
- There are many possible lines that can cross each point individually,each line with different slope and y intercept values.
- However there is one line that is consistent with both points.we can determine that by looking at the point of interesection enough space because that point of interesection represents the M and B values of a line consistent with crosssing both points.
- Now in order to identify the lines,we will first split our Hough space into a grid.each bin inside the grid corresponding to the slope and y intercept value of the line.
- For every point of intersection in a Hough space bin we are going to cast a vote inside of the bin that it belongs to.
- The bin maximum number of votes will be our line.
- But As we know that slope of a vertical line is infinity.so to express vertical lines, we will use polar coordinates. so the equation of our line becomes: roh = xcos(theta) + ysin(theta).
- To express lines in polar system by using Hough transform:We should convert lines from x,y space to polar mc space.
- But first we use HoughLinesP() probabilistic function to determine points for us and store in lines variables.
Defining hough_transformation() function
def hough_transformation(ROI_img,rho,theta, threshold,lines, minLineLength, maxLineGap):
    image = cv2.convertScaleAbs(ROI_img)
    lines = cv2.HoughLinesP(image, rho, theta,threshold,lines,minLineLength, maxLineGap)
    return lines
#calling hough transformation func
hough_lines = hough_transformation(roi_img,1.2,np.pi/180,50,np.array([]),minLineLength=100,maxLineGap=1000) - In above code,HoughlinesP() takes '8bit'integer image as input.so before passing it directly to the HoughLinesP() function,we are converting ROI_img to '8bit' integer image by using convertScaleAbs() function available in opencv.
print(hough_lines)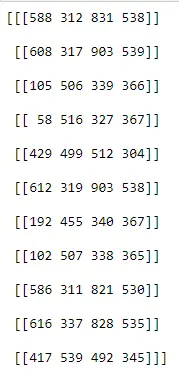
6. Average Slope Intercept to get left and right lanes
- get_coordinates function helps us to make cordinates for the line with given slope and intercepts
Defining get_coordinates() function
def get_coordinates(image, parameters):
    slope, intercept = parameters
    if slope<0:
        y1 = image.shape[0]
        y2 = int(y1*(3/5))#3/5
        x1 = np.clip(int((y1-intercept)/slope), 0, image.shape[1])
        x2 = int((y2-intercept)/slope)
    else:
        y1 = image.shape[0]
        y2 = int(y1*(3/5))
        x1 = int((y1-intercept)/slope*0.99)#*0.98
        x2 = int((y2-intercept)/slope)

return np.array([x1, y1, x2, y2])- Getting Average Slope Intercept
Defining average_slope_intercept() function
def average_slope_intercept(image,lines):
    left_lines = []
    right_lines = []

    #getting slope and intercept for each line
    for line in lines:
        x1, y1, x2, y2 = line[0][:]
        params = np.polyfit((x1,x2), (y1,y2), 1)
        slope = params[0]
        intercept = params[1]

        #left and right lines seperation
        if slope<0:    #points on the left have negative slope
            left_lines.append((slope, intercept)) # so we add these points to our left_lines array
        else:
            right_lines.append((slope, intercept)) #else these points are on right side

    #getting coordinates for left lines
    left_line_coords = []
    for line in left_lines:
        if line[0]>-0.1:
            continue
        left_line_coords.append(get_coordinates(image, line))

    #getting coordinates for rigth lines
    right_line_coords = []
    for line in right_lines:
        if line[0]<0.2:
            continue
        right_line_coords.append(get_coordinates(image, line))

    final_left_lines = []
    final_right_lines = []
    cosine_dist = []
    #if both curves have same slope
    if len(left_line_coords)==0 or len(right_line_coords)==0:
        if len(left_line_coords)==0:
            lines = right_line_coords
        else:
            lines = left_line_coords

        if len(lines)<=2:
            return np.array(lines)

        for line1 in lines:
            for line2 in lines:
                cosine_dist.append(spatial.distance.cosine(line1, line2))
        cosine_dist = [item for item in cosine_dist if not(math.isnan(item))]
        threshold = np.percentile(cosine_dist,75)#80

        for left in lines:
            for right in lines:
                dist = spatial.distance.cosine(left, right)

                if dist>threshold and len(final_left_lines)==0:
                    final_left_lines.append(list(left))
                    final_right_lines.append(list(right))
                    continue
                if dist>threshold:
                    if list(left) not in final_left_lines and list(left) not in final_right_lines:
                        final_left_lines.append(list(left))
                    if list(right) not in final_right_lines and list(right) not in final_right_lines:
                        final_right_lines.append(list(right))

        left_line = np.average(np.array(final_left_lines), axis=0)
        right_line = np.average(np.array(final_right_lines), axis=0)
        return np.array([left_line, right_line])
    else:
        #keeping farthest lines and removing others
        for left in left_line_coords:
            for right in right_line_coords:
                cosine_dist.append(spatial.distance.cosine(left, right))
        cosine_dist = [item for item in cosine_dist if not(math.isnan(item))]
        threshold = np.percentile(cosine_dist,90)#85

        for left in left_line_coords:
            for right in right_line_coords:
                dist = spatial.distance.cosine(left, right)

                if dist>threshold and len(final_left_lines)==0:
                    final_left_lines.append(list(left))
                    final_right_lines.append(list(right))
                    continue
                if dist>threshold:
                    if list(left) not in final_left_lines:
                        final_left_lines.append(list(left))
                    if list(right) not in final_right_lines:
                        final_right_lines.append(list(right))

        left_line = np.average(np.array(final_left_lines), axis=0) # Axis should be 0 because we want averages of columns in array
        right_line = np.average(np.array(final_right_lines), axis=0)

        return np.array([left_line, right_line])
lines = average_slope_intercept(roi_img, hough_lines) #
threshold = spatial.distance.cosine(lines[0], lines[1])
print(lines)
print(threshold)
- function Average_slope_intercept() is defined like this :it takes 4 points from passed line and fit into Polyfit from where it gets the slope and intercept as parameters array.
- Slope help us to identify which points are on the left or right.
- To be able to draw the continuous line we have to find averages of these left and right lines.
- And to draw them we also need the cordinates and then we can return arrays left & right lines.
- For making cordinates we have already defined another function i.e get_coordinates.
Let us understand the coding of average_slope_intercept() function
- We are going to explain above average_slope_intercept() function into three part.
- So we are splitting the code and try to understand the how average_slope_function() work.
Part-1 Getting coordinates for Hough lines
def average_slope_intercept(image,lines):
    left_lines = []
    right_lines = []

    #getting slope and intercept for each line
    for line in lines:
        x1, y1, x2, y2 = line[0][:]
        params = np.polyfit((x1,x2), (y1,y2), 1)
        slope = params[0]
        intercept = params[1]

        #left and right lines seperation
        if slope<0:    #points on the left have negative slope
            left_lines.append((slope, intercept)) # so we add these points to our left_lines array
        else:
            right_lines.append((slope, intercept)) #else these points are on right side

    #getting coordinates for left lines
    left_line_coords = []
    for line in left_lines:
        if line[0]>-0.1:
            continue
        left_line_coords.append(get_coordinates(image, line))

        #getting coordinates for rigth lines
    right_line_coords = []
    for line in right_lines:
        if line[0]<0.2:
            continue
        right_line_coords.append(get_coordinates(image, line))
- average_slope_intercept() function takes ROI_image and hough lines as inputs.
- Actaul here we are trying to seperate the lines representing Left lane with right lane.
- As we have discussed it takes 4 points from passed line and fit into Polyfit from where it gets the slope and intercept as parameters array.
- Based on the slope value we are decides weather the line on left or right side.
- as we can see if slope < 0,we append slope and intercept on left side,else we add to these are on right side.
- we then use the slope and intercept to get the coordinates of the lines.
- We are avoiding the lines with slope value between -0.1 to 0.2,because they might be horizontal lines in which case they are redundants to to detect lanes.
- get_cordinates() function which we have already discussed above in advance.
- Above code is not enough to detect lanes because from above code we can expect there might be different types of outputs.
- while vehicle takes turn on road curvature, slope of all the lines will be either positive or negative.
- Suppose there are crack presented in middle of road,it can be considered as a lane.
- So in order to deal with these types of situation we need to add some conditions in program.
Part-2 To Avoid the cracks in the middle of road
a) Getting Cosine distance between all lines.
for left in left_line_coords:
    for right in right_line_coords:
        cosine_dist.append(spatial.distance.cosine(left, right))
    cosine_dist = [item for item in cosine_dist if not(math.isnan(item))]
threshold = np.percentile(cosine_dist,90)#85- Using above code we are computing cosine distance between all possible lines.
- We are taking 90the percentile value as the threshold.
- Any lines whose cosine distance is less than the threshold will not be considered.
- This filteration is done by using below code.
b) Filtering lines using the threshold value
for left in left_line_coords:
    for right in right_line_coords:
        dist = spatial.distance.cosine(left, right)

        if dist>threshold and len(final_left_lines)==0:
            final_left_lines.append(list(left))
            final_right_lines.append(list(right))
            continue
        if dist>threshold:
            if list(left) not in final_left_lines:
                final_left_lines.append(list(left))
            if list(right) not in final_right_lines:
final_right_lines.append(list(right))- The above code filter the lines using threshold value,after excecuting the above code,
we are only saving the lines whose cosine distance is maximum compared to others thereby ensuring there no cracks in the middle will not impact lane detection.
Part-3 'what if all the lines have same sign for slope or number of lines themselves is very less'
- In this situation we won't divide the lines into left and right lines, instead we will apply
the same procedure discussed in part-02(a) & (b) over the all points.
#if both curves have same slope

if len(left_line_coords)==0 or len(right_line_coords)==0:
    if len(left_line_coords)==0:
        lines = right_line_coords
    else:
        lines = left_line_coords

    if len(lines)<=2:
        return np.array(lines)

    for line1 in lines:
        for line2 in lines:
            cosine_dist.append(spatial.distance.cosine(line1, line2))
    cosine_dist = [item for item in cosine_dist if not(math.isnan(item))]
    threshold = np.percentile(cosine_dist,75)#80

    for left in lines:
        for right in lines:
            dist = spatial.distance.cosine(left, right)
            if dist>threshold and len(final_left_lines)==0:
                    final_left_lines.append(list(left))
                    final_right_lines.append(list(right))
                    continue
            if dist>threshold:
                if list(left) not in final_left_lines and list(left) not in final_right_lines:
                    final_left_lines.append(list(left))
                if list(right) not in final_right_lines and list(right) not in final_right_lines:
                    final_right_lines.append(list(right))
part_04 Combining All lines together
left_line = np.average(np.array(final_left_lines), axis=0)
right_line = np.average(np.array(final_right_lines), axis=0)- By using numpy average,we will take the average over all the left lines and average over all the right lines to represent them as single lines.
7. drawing line on the input image
- average_slope_intercept() returns left line and right line as output.
- Now we take left and right lines and draw them on the input frame.
- As we can see draw_lane_lines() function takes an image and avereage lines as arguments and by using opencv cv2.line() function draws lines on input frame.
- Weighted sum is used to overlap the lane on the input frame.
- draw_lane_lines() will return us lane_marked_image.
Defining draw_lane_lines() function
def draw_lane_lines(image, lines, color=[0,250,0], thickness=12):
    line_image = np.zeros_like(image)
    for line in lines:
        x1, y1, x2, y2 = line
        if line is not None:
            cv2.line(line_image, (int(x1),int(y1)), (int(x2),int(y2)), color, thickness)

            # Resultant weighted image is calculated as follows: original_img * α + img * β + γ
    return cv2.addWeighted(image, 0.8, line_image, 1, 1.0)
lane_marked = draw_lane_lines(image, lines)
cv2.imshow('lane_marked',lane_marked)
cv2.waitKey(0)
cv2.imwrite('lane_marked.png',lane_marked)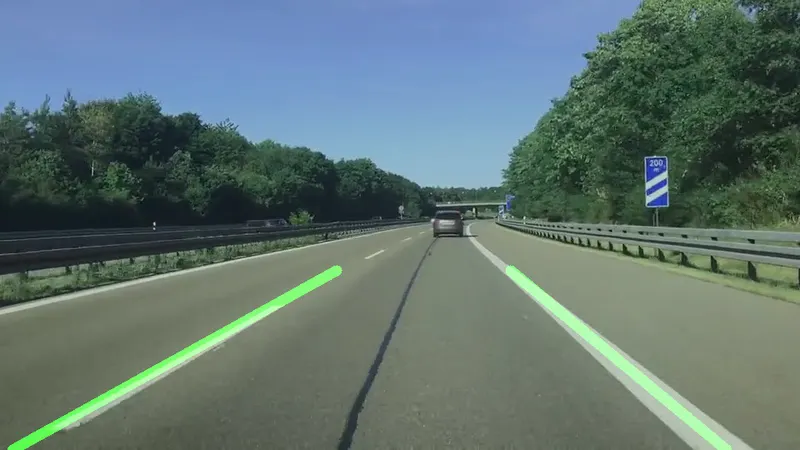
- In this way, we have detected lane lines on input frame.
- But our main objective is to detect lanes in given video,so in order to achieve this goal, we are going to combine all functions from reading frame to the draw lines in single function called detect_lane().
- As we know, A video is a sequence of images (called frames) captured and eventually displayed at a given frequency.
- so first we will read the frames one by one and pass to the detect_lane() function, this function will give us lane marked frame,Then we combine these lane marked frames one by one and make final output as lane marked video.
8. Final Function which calls all the other functions and mark the lanes
- Here we are writing simple detect_lane function which calls all other functions(i.e above all ) and
returns the final output.
Defining detect_lane() function
def detect_lane(image):
    #converting to gray image
    gray_img = gray_scale(image)

    #gaussian smoothing
    smoothed_img = gaussian_smoothing(gray_img)

    #edge detection
    canny_img =canny_edge_detector(smoothed_img,50,180)

    #getting region on interest
    roi_img = ROI_image(canny_img)

    #getting line using hough transformation
    hough_lines  = hough_transformation(roi_img,1.2,np.pi/180,50,np.array([]),minLineLength=50,maxLineGap=1000)#0

    #generating single lines for left and right lane
    lines = average_slope_intercept(roi_img, hough_lines)
    threshold = spatial.distance.cosine(lines[0], lines[1])

    #marking lanes on the original image
    lane_marked = draw_lane_lines(image, lines)

    return threshold, lane_marked
9.Detecting lane lines in given input video:
Input Video:
https://drive.google.com/file/d/1dlZv3PZVAMGy9aY8hDnWhgXERZySE1eZ/view?usp=sharing
#reading the video file
video = cv2.VideoCapture('Lane_video_1638962421.mp4')

#checking fps
fps = video.get(5)
print('Frames per second : ', fps,'FPS')

#checking total number of frames
frame_count = video.get(7)
print('Frame count : ', frame_count)

#obtaining frame size information
frame_width = int(video.get(3))
frame_height = int(video.get(4))
frame_size = (frame_width,frame_height)

#writing lane marked images into a video file
output = cv2.VideoWriter('Lane_marked_output.avi',cv2.VideoWriter_fourcc('M','J','P','G'),20, frame_size)

#loading each frame
while(video.isOpened()):
    ret, frame = video.read()
    if ret == True:
        threshold, final_image = detect_lane(frame)
        if 0.2<=threshold<=0.303:
            output.write(final_image)
            cv2.imshow("output",final_image)
            k = cv2.waitKey(20)
            if k ==113:
                break
        else:
            continue
    else:
        break

#Releasing the video capture object and destroying all opened windows
video.release()
cv2.destroyAllWindows()- Reading video using cv2.VideoCapture() and created video capture object.
- Using get() method retrieving data from video i.e fps , frame_counts, frame_width & frame height.
- get() method takes a single argument i.e here we privided 5 & 7 ,for frame rate & frame_counts respectively.
- By using get(3) & get(4) we are obtaining the frame size imformation.
- Creating videoWriter object using cv2.VideoWriter(outputfilename, fourcc, fps, frameSize) which will be used to write a lane marked image into video.
- isOpened() method to confirm the video file is opened successfully.
- After creating objects and retrieving data such as fps,frame_counts,frame_width & height,we are now ready to read each image frame from the video file.
- For this we are creating a while loop and reading one frame at a time from the video using the video.read() method.
- video.read() method returns a tuple i.e(ret,frame),where the first element is a boolean and the next element is the actual video frame.
- When the first element(ret) is True,then frame is passed to detect_lane() function which returns threshold & final_lane marked image.Otherwise exit the loop.
- Here again we are filtering the final_image by putting threshold condition i.e we are taking only those images whose threshold values is in between 0.2 & 0.303.
- Those filtered final_image is passed to output.write(final_image) function which writes the final_image to output file.
- imshow() to display the final_image.
- waitKey(20) function used to show the image for 20 miliseconds before it automatically closes.
- release() function release the video capture object.
- destroyAllWindows() will destroy all opened window.
Below is the final lane_marked_output video.
Final_Lane_marked Output Video Link:
https://drive.google.com/file/d/1YmXGRQiA-BUySiGPy7cMrg--zYHu5SFW/view?usp=sharing