Project 2 Thermal modeling of battery pack
ANSWER:
AIM :-
For a 10 cell series lithium ion battery model, simulate the thermal effects and compare life cycle performance at various temperatures, charge & discharge rates using MATLAB.
INTRODUCTION :-
The Lithium-ion batteries are widely used as energy sources in different hybrid and electric vehicle, however, the operation characteristics of the battery in such vehicle are strongly dependent on the operation temperature and therefore, with purpose to improve these characteristics a good thermal control system should be utilized. The temperature of a Lithium battery cell is important for its performance, efficiency, safety, and capacity and is influenced by the environmental temperature and by the charging and discharging process itself. Therefore, a thermal model of the battery is used in order to calculate and estimate the cell temperature.
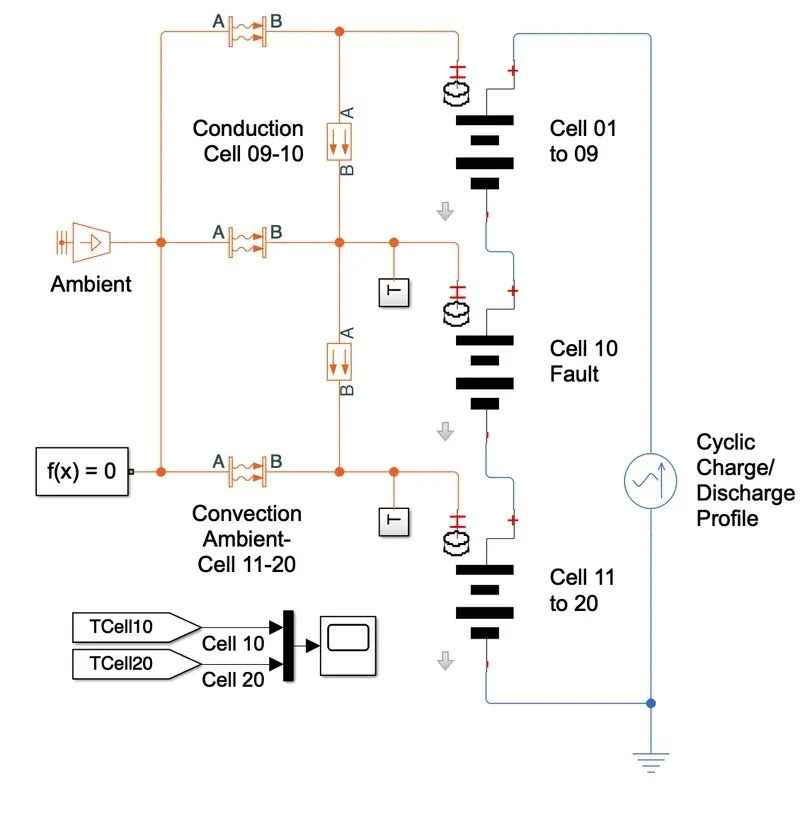
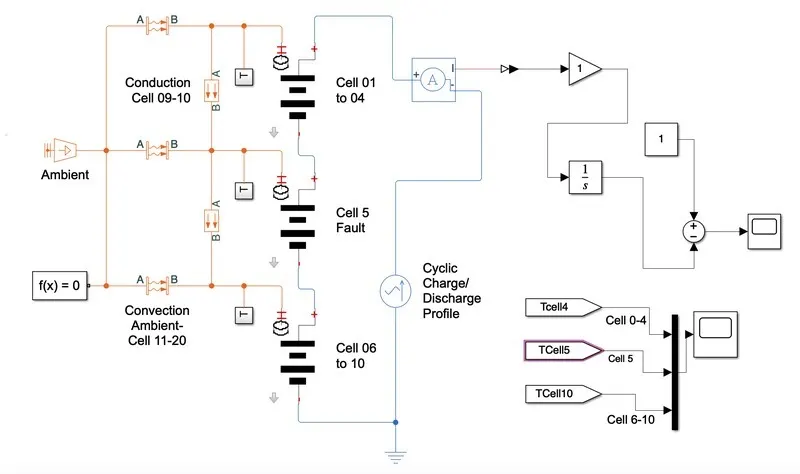
Lithium-Ion Battery Pack with Fault is to simulate a battery pack consisting of multiple series-connected cells in an efficient manner. It also shows how a fault can be introduced into one of the cells to see the impact on battery performance and cell temperatures. For efficiency, identical series-connected cells are not just simply modeled by connecting cell models in series. Instead, a single cell is used, and the terminal voltage is scaled up by the number of cells. The fault is represented by changing the parameters for the Cell 5 Fault subsystem, reducing both capacity and open-circuit voltage, and increasing the resistance values.
OVERVIEW:
In this project, the requirement that we need to simulate the thermal effect and life cycle performance of lithium-ion battery packs at various temperatures, charges, discharge rates.
Following are the model of the lithium-ion battery pack with default.
SIMULINk MODEL:
The Simulink model is designed for a 10-cell series lithium-ion battery to simulate the thermal effects and compare life cycle performance at various temperatures, charge & discharge rates. The block parameters used for designing the model are:
MODEL EXPLANATION:
The Above model shows the representation of the 10 cell series connection. A lithium-ion battery pack of 10 cells is used. In order to check for the thermal effects, one of the cells is considered faulty. Fault in the sense that the temperature of this cell is higher than the other nine. The battery is assumed to be air-cooled and provided with ventilators with ambient air and temperature. For modeling this case, all the cells are connected with ambient temperature. The convective heat transfer from the surrounding to the cells and conductive between the cells is also modeled using the respective blocks. There are temperature sensor blocks used to detect the temperature from the cells. The current drawn from the cells is controlled by the 'Controlled CUrrent Source' block. The data of a drive cycle in the form of a current is fed to this current controller. A signal builder block is used to feed this drive cycle data and it is stored in the form of current vs time. After running the model SOC vs time and temperature vs time graphs are plotted.
BLOCK USED FOR THE MODEL:
Temperature source :-

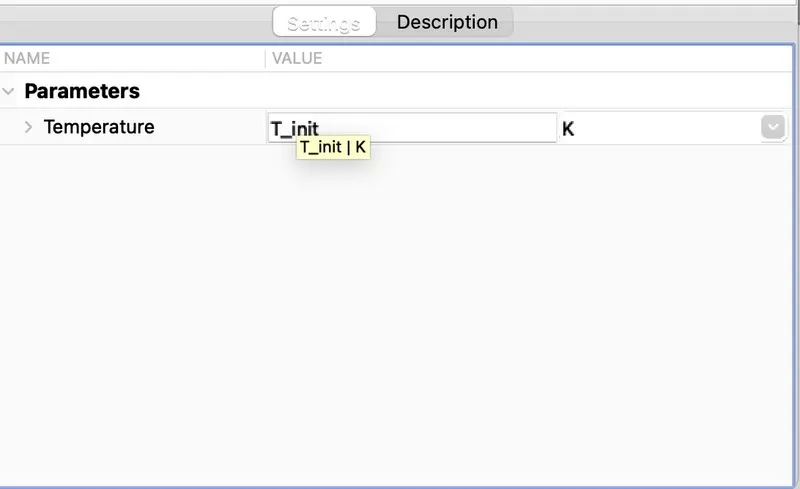
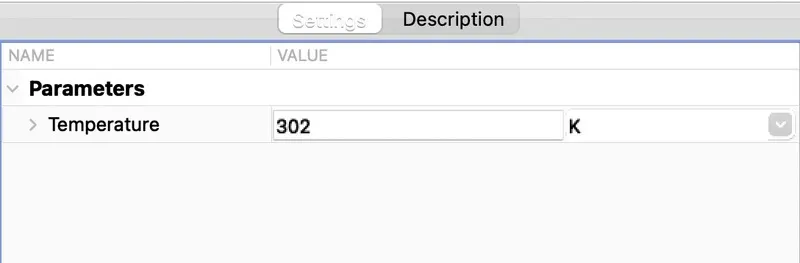
The Temperature Source block represents an ideal source of thermal energy that is powerful enough to maintain specified temperature at its outlet regardless of the heat flow consumed by the system. The source generates constant absolute temperature, defined by the Temperature parameter value.
AC Current Source :-
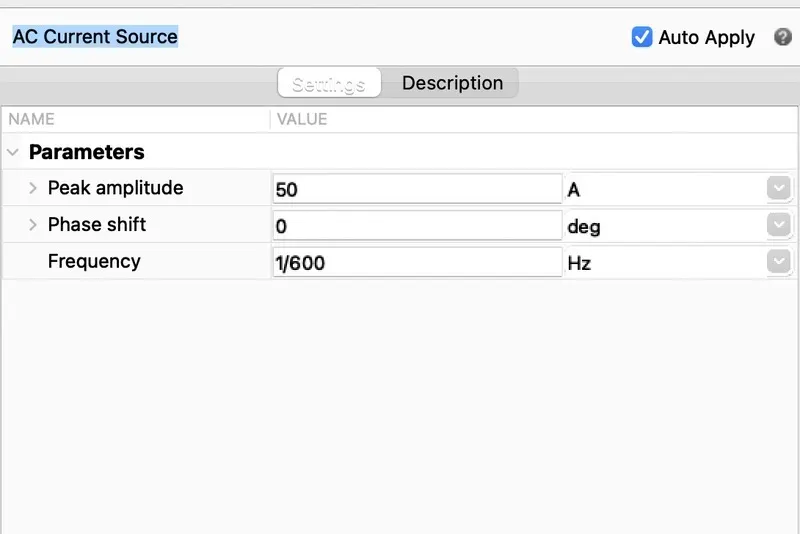
The AC Current Source block represents an ideal current source that maintains sinusoidal current through it, independent of the voltage across its terminals.
The output current is defined by the following equation:
I=I0⋅sin(2π⋅f⋅t+φ)
Conductive Heat Transfer :-
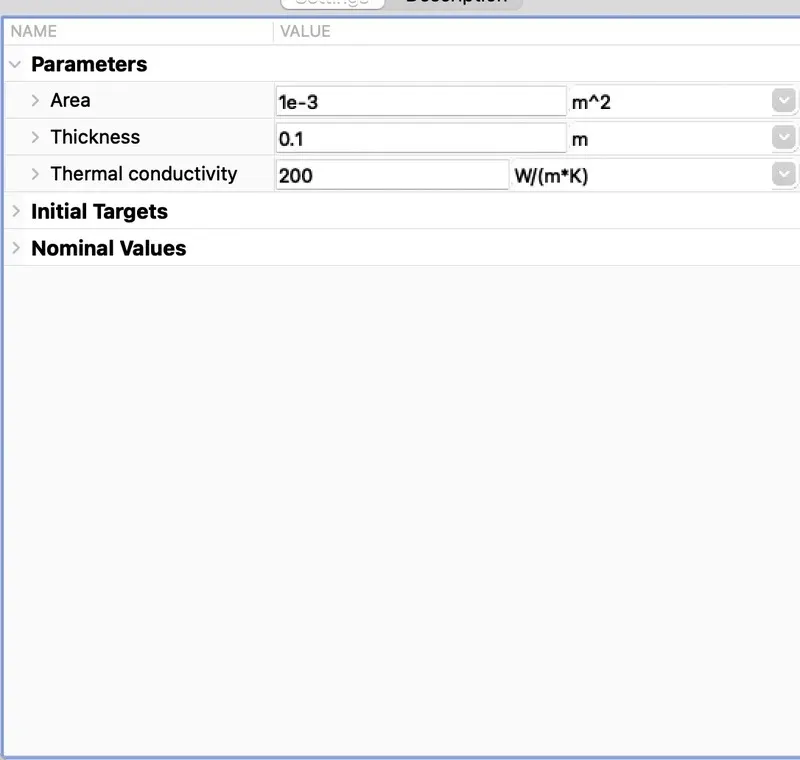
The Conductive Heat Transfer block represents a heat transfer by conduction between two layers of the same material. The transfer is governed by the Fourier law:
Q=k⋅AD(TA−TB)
Battery :-
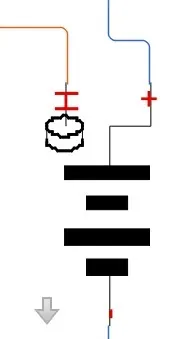
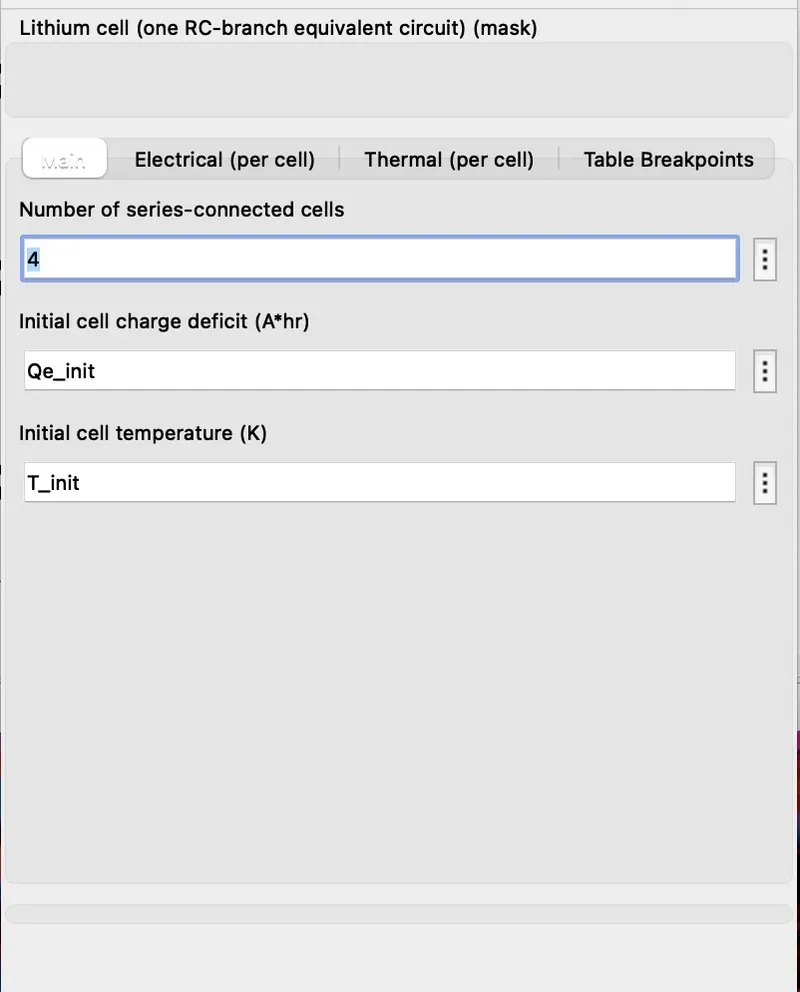
The Battery block represents a high-fidelity battery model. The block calculates no-load voltage as a function of charge level and optional temperature using lookup tables and includes several modeling options:
1.Self-discharge
2.Battery fade
3.Charge dynamics
4.Calendar aging
Controlled Current source :-
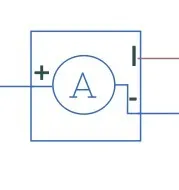
The block represents an ideal current sensor, that is, a device that converts current measured in any electrical branch into a physical signal proportional to the current. Connections + and - are conserving electrical ports through which the sensor is inserted into the circuit. Connection I is a physical signal port that outputs current value.
Gain :-
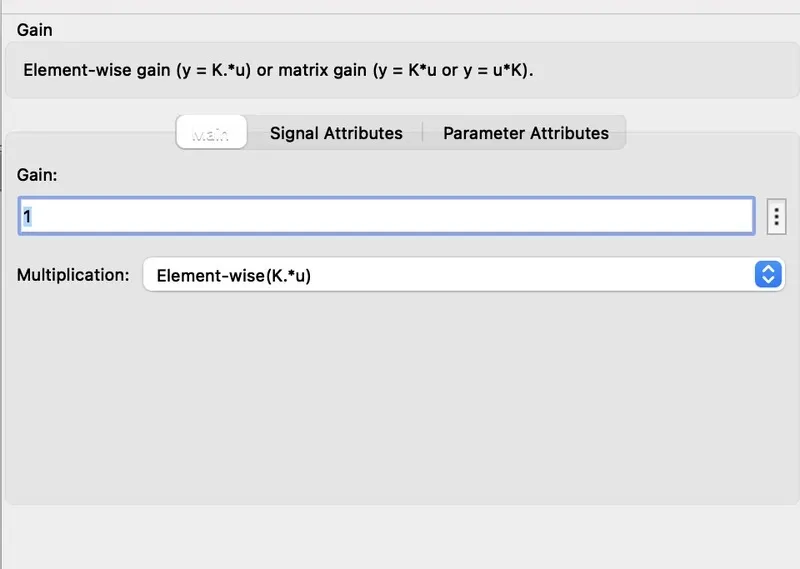
The Gain block multiplies the input by a constant value (gain). The input and the gain can each be a scalar, vector, or matrix. You specify the value of gain in the Gain parameter. The Multiplication parameter lets you specify element-wise or matrix multiplication. For matrix multiplication, this parameter also lets you indicate the order of the multiplicands. Gain is converted from doubles to the data type specified in the block mask offline using round-to-nearest and saturation. The input and gain are then multiplied, and the result is converted to the output data type using the specified rounding and overflow modes.
Integrator :-
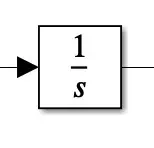
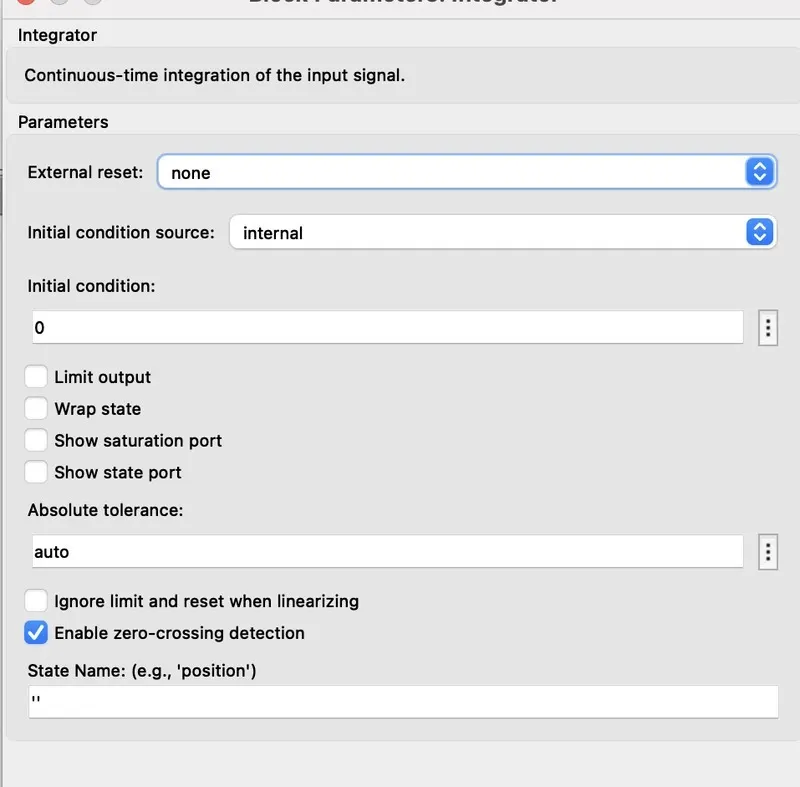
The Integrator block outputs the value of the integral of its input signal with respect to time.
Simulink® treats the Integrator block as a dynamic system with one state. The block dynamics are given by:
{ x(t)=u(t),y(t)=x(t) * x(t0)=x0
Convective Heat Transfer :-
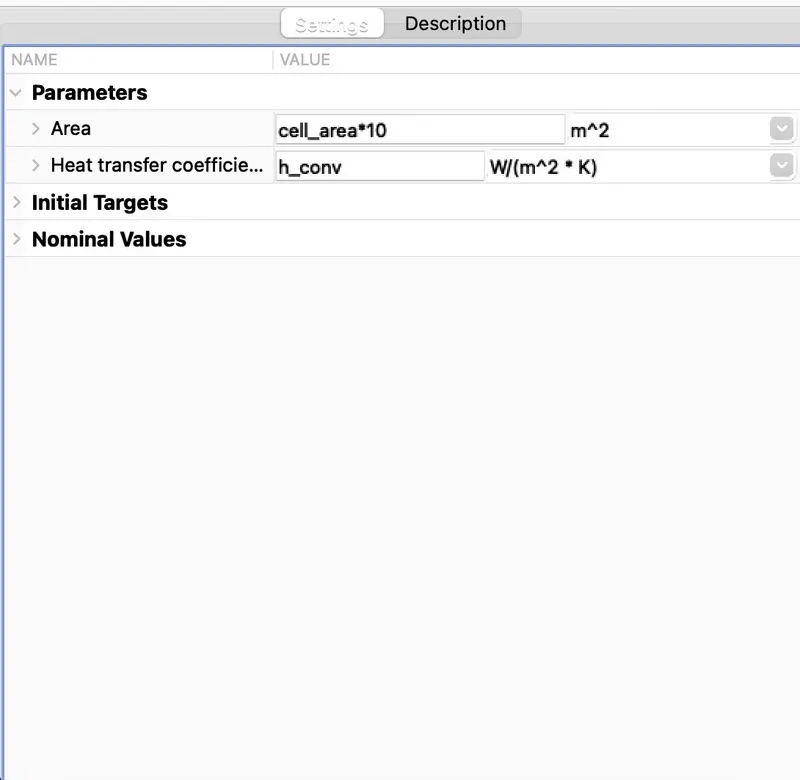
The Convective Heat Transfer block represents a heat transfer by convection between two bodies by means of fluid motion. The transfer is governed by the Newton law of cooling:
Q=k⋅A⋅(TA−TB)
Cell 0-4 subsystem :-
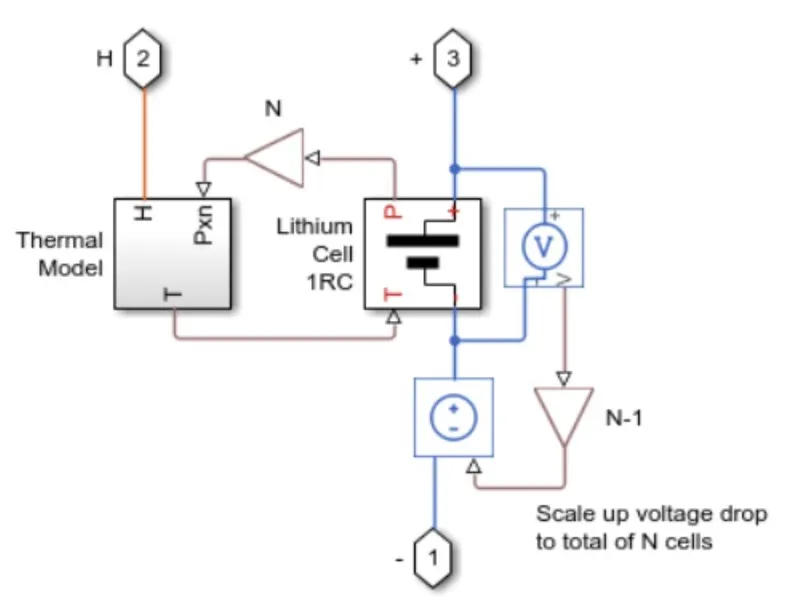
The cell subsystem basically consists of a thermal model and lithium cell 1RC block which calculate the temperature and thermal effect for cells and overall calculate for the battery pack. The block which are inside the cell subsystems are PS gain block which multiplies the input physical signals by a constant i.e y=u.*gain .another block are voltage sensor and current-voltage source. The voltage sensor block represents an ideal voltage sensor, this is a device that converts voltage measured between any electric connection into a physical signal proportional to the voltage. The current-voltage source represents an ideal voltage source that is powerful enough to maintain the specified voltage at its output regardless of the current passing through it. The output voltage is V=Vs, where Vs is the numeric value represents at the physical signal port.
Thermal Model Subsystem :-
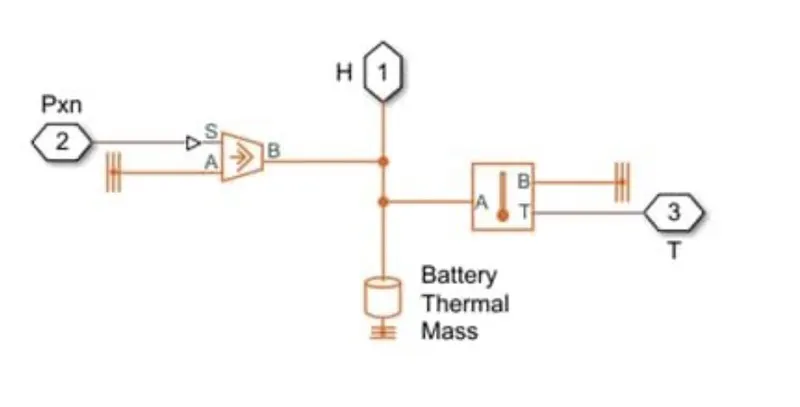
This block represents a reference point in a thermal network where the temperature is equal to absolute zero. Controlled heat flow rate source: This block represents an ideal energy source in a thermal network that can maintain a controlled heat flow rate regardless of the temperature difference. The heat flow rate is set by the physical signal port S. A positive heat flow rate flows from port A to port B.
Thermal Mass :-
This block models internal energy storage in a thermal network. The rate of temperature increase is proportional to the heat flow rate into the material and inversely proportional to the mass and specific heat of the material.
Temperature Sensor :-
This block measures temperature in a thermal network. There is no heat flow through the sensor. The physical signal port T reports the temperature difference across the sensor. The measurement is positive when the temperature at port A is greater than the temperature at port B.
Lithium Cell 1RC Subsystem :-
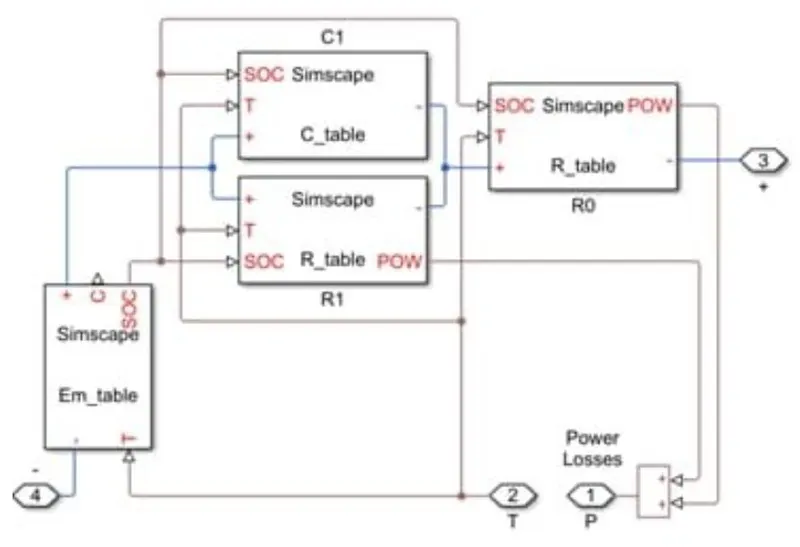
This block basically consists of capacitance value © table which depends on an external physical signal inputs SOC and T. It is assumed that the capacitance value is slowly varying with time, and hence the equation i = C*dv/dt holds. Resistance value (R) table which depends on an external physical signal inputs SOC and T. Voltage value (EM) which implements the cell's main branch voltage source, and determines values for capacity (C) and state of charge (SOC). The defining equations depend on cell temperature, T.
Battery configuration :-
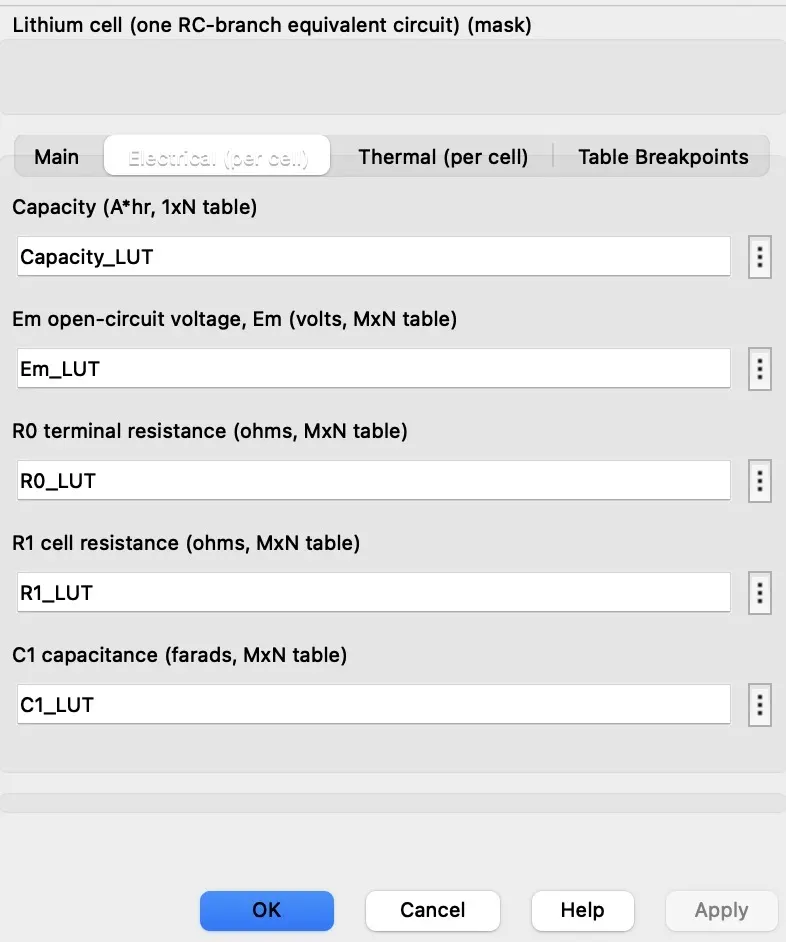
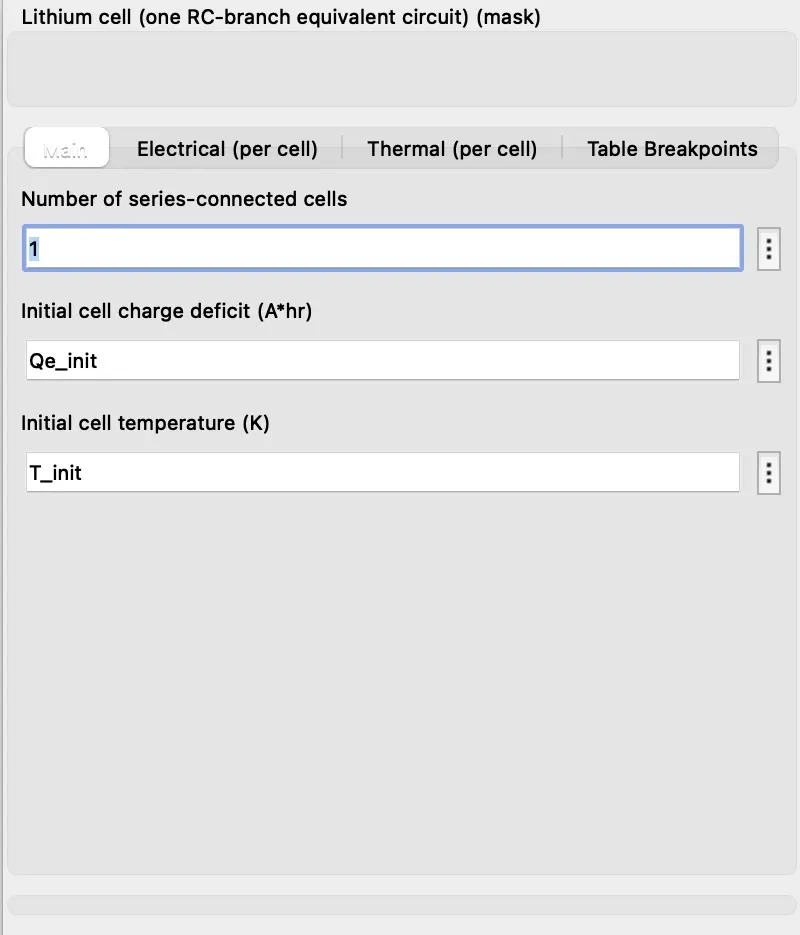
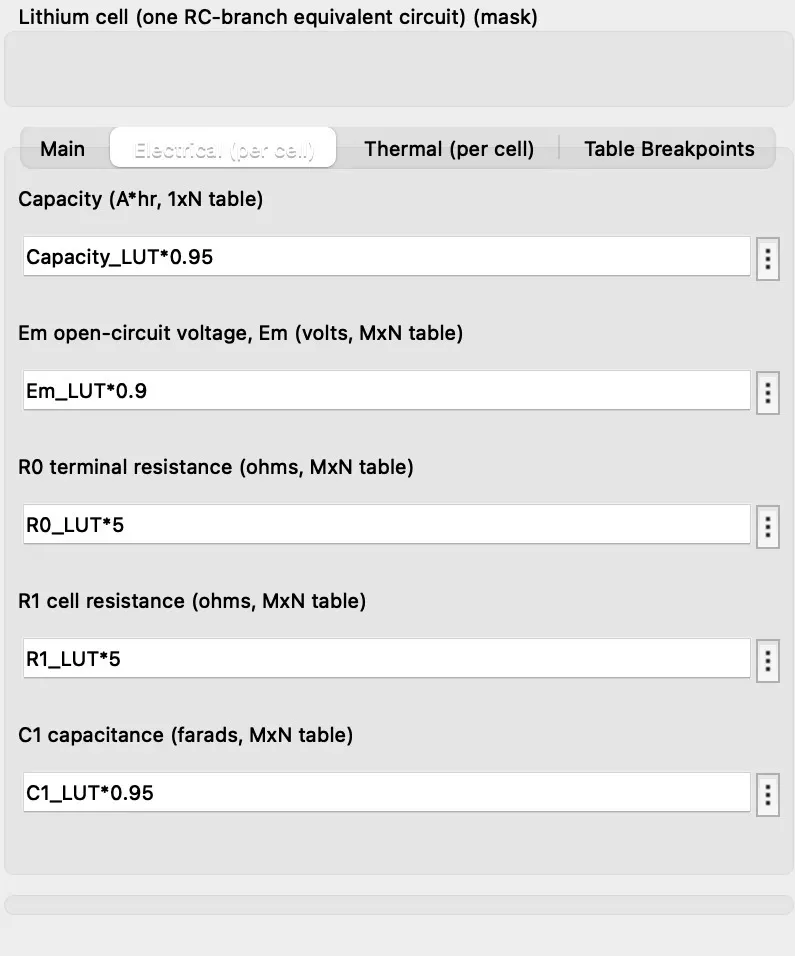
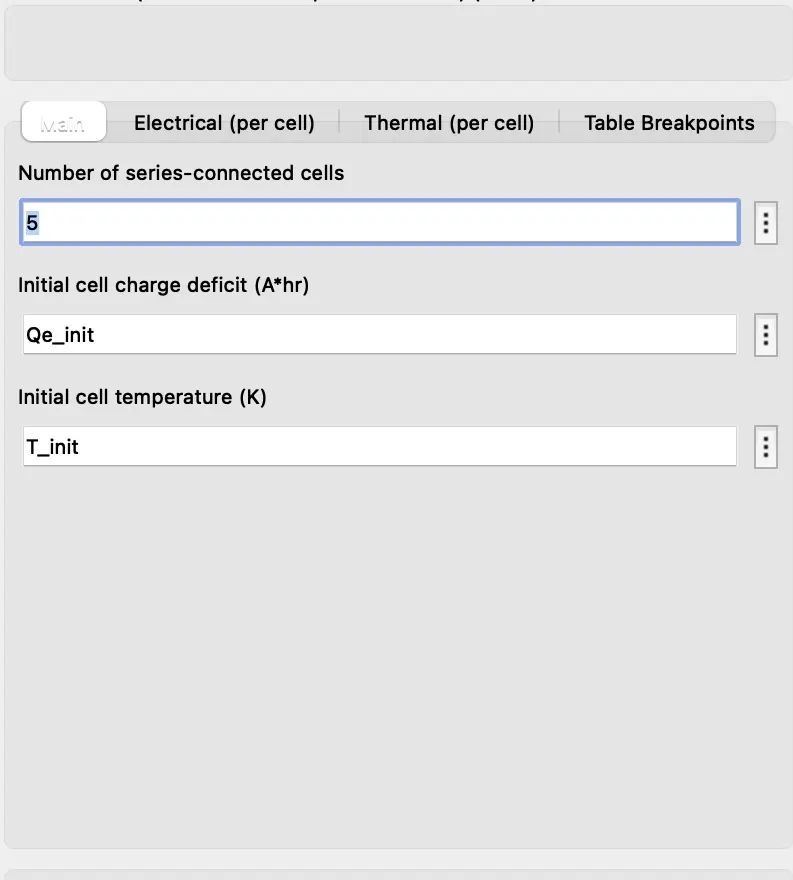
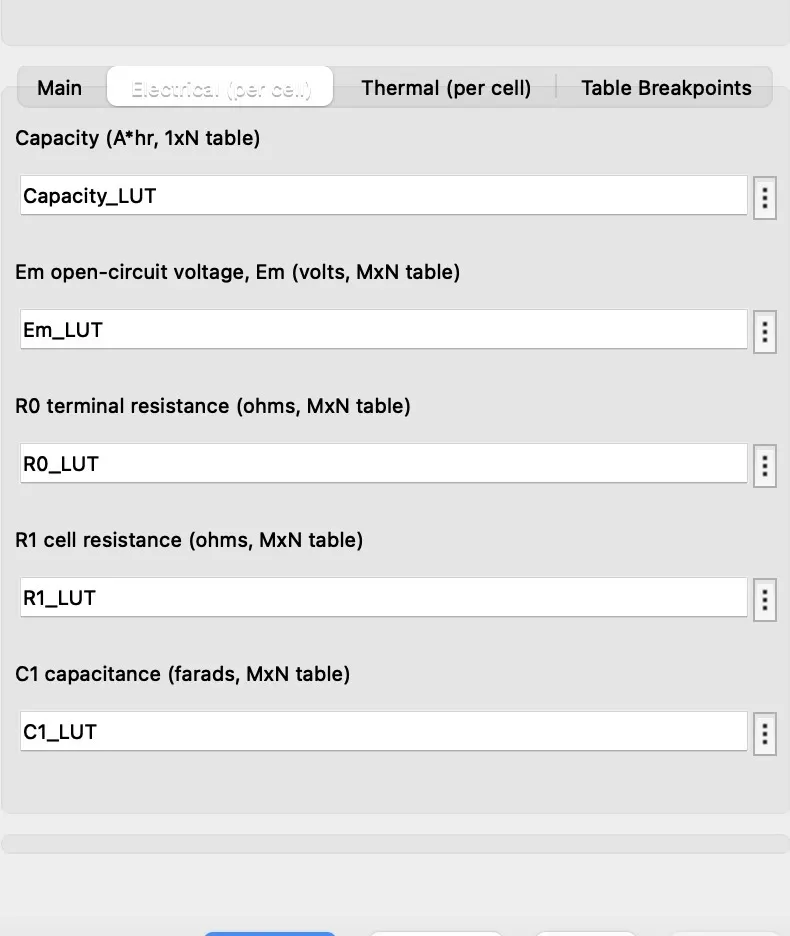
In this model, the temperature is measured an displayed through the display block.
Scope Result :-
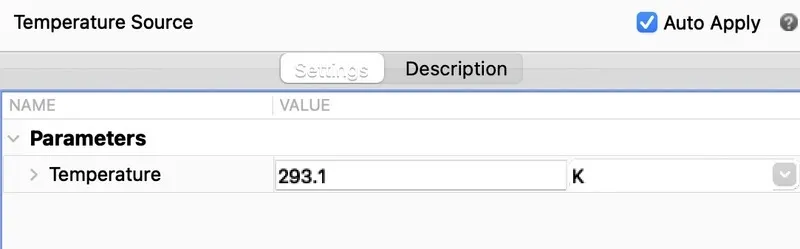
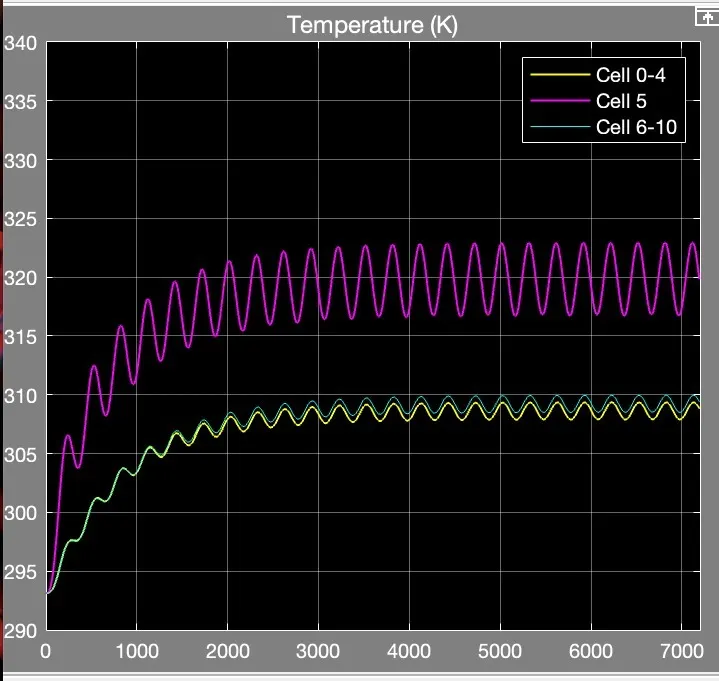
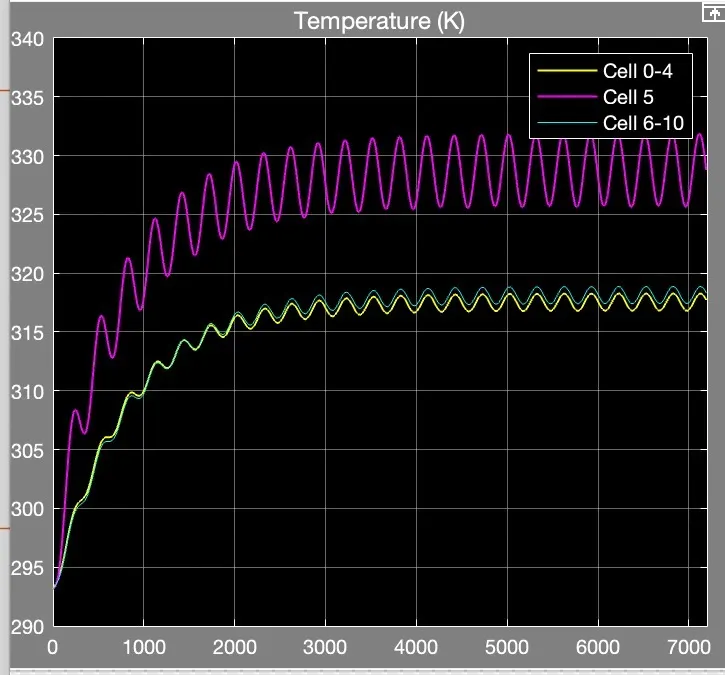
All the three the cell having the same temperature at the start which is at 293.1 k.but in the beginning few seconds of simulation cell no 5 oscillates with more the cell 4 and 10 because its design with fault and ranging to higher temp then cell 4 and 10.after a time period of around 1300 sec both the cells getting are unfollowing the temperature line which was following the same temperature rate,cell no 4 and 10 having approximately 315(cell 04 having quite less temp then cell 10 because of no of the cell are different) k at the end of the simulation and the cell no 5 achieving the higher temperature of around 328 k
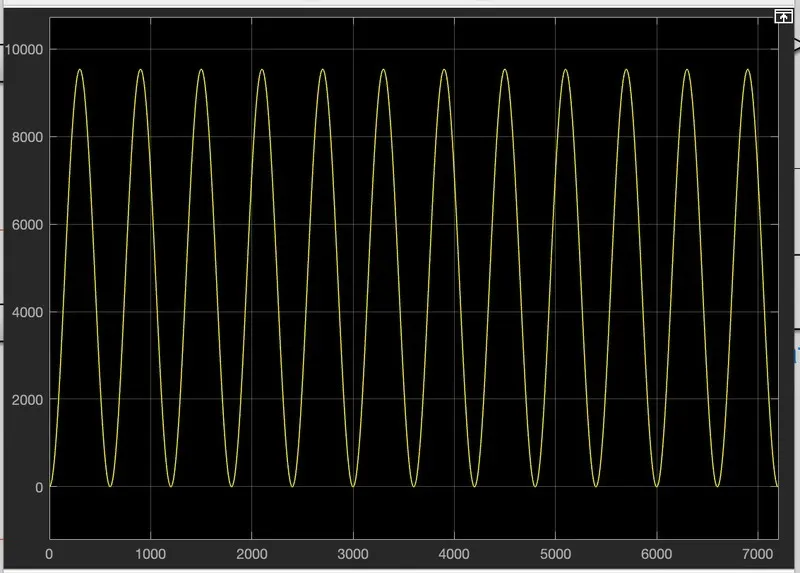
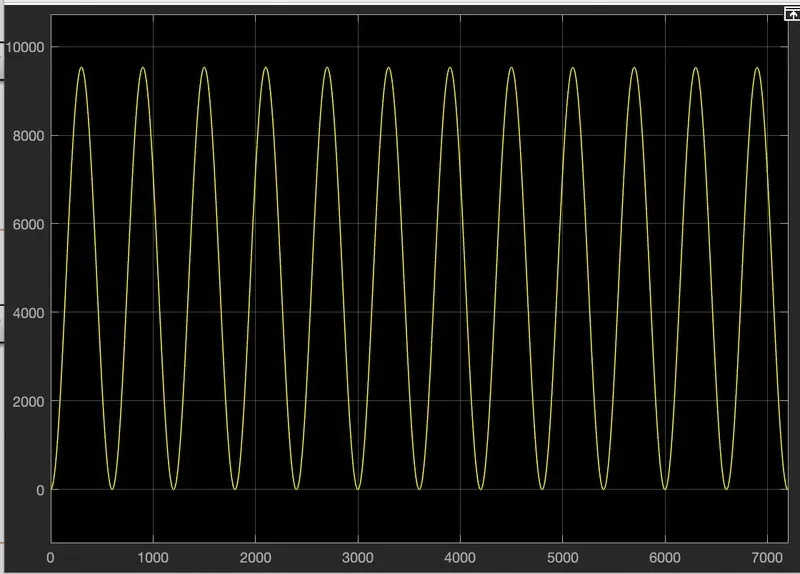
The soc graph following the sinusoidal waveform structure and fluctuating after 297 seconds and this waveform achieving the value of more than 100.06 soc . As we see that the battery is fluctuating every 301.200 seconds which depend upon the thermal behaviour of battery pack.
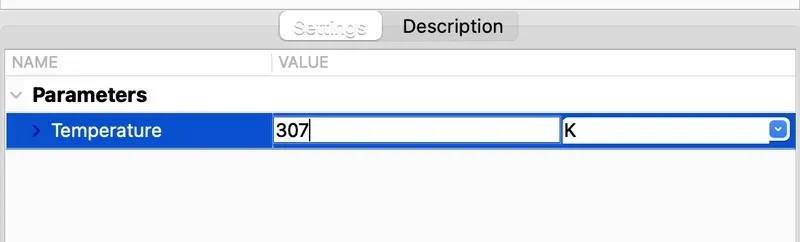
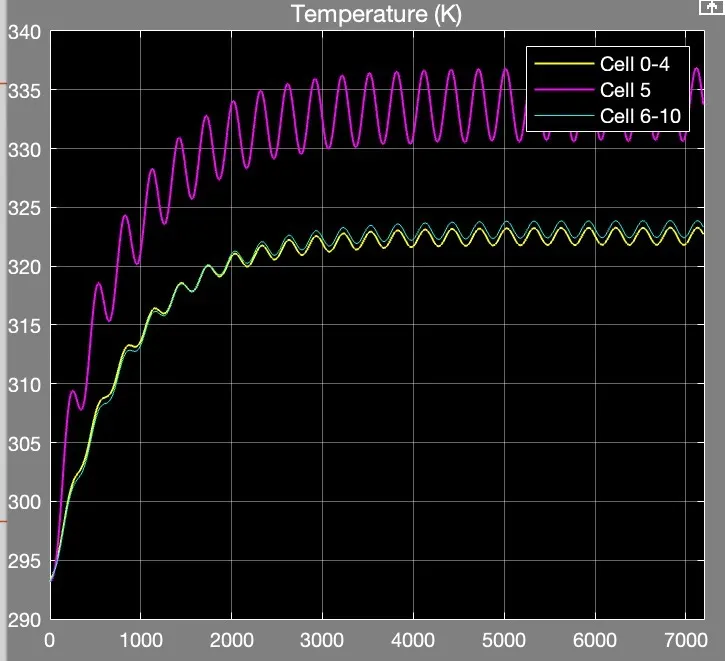
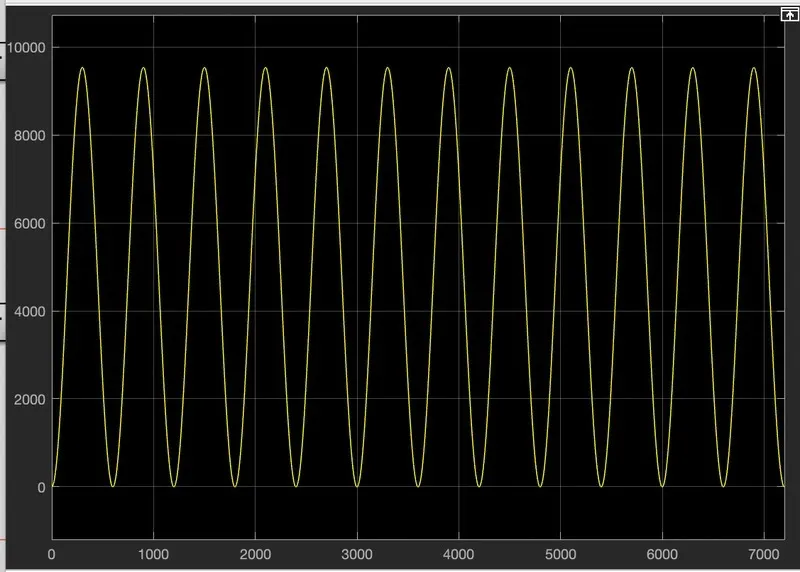
For cell no 05-06 both the waveforms oscillating at a high rate but in a positive zone which are increasing initially and maintaining a certain range.
Conclusion :-
The flow of heat is decreased at constant and minimum temperature that is 309 k for different temperature based. Based on different temperature we will see changes in conduction and convection. There is slightly changes in cyclic charge and discharge of cell which I fixed at 50A as peek amplitude. As I set fault in cell-5 and we can see that there is lots of fluctuation and temperature rise in cell-5 as compared with other cells connected in series. SOC for all different temperature are same, there is no changes in SOC.