Project 2 Thermal modeling of battery pack
CONTENT:
- OBJECTIVE
- THEORY
- SIMULINK BLOCKS
- SIMULINK MODEL EXPLANATION
- RESULT OBSERVATION
A. OBJECTIVE:
For a 10-cell series lithium-ion battery model, simulate the thermal effects and compare life cycle performance at various temperatures, charge & discharge rates using MATLAB.
B. THEORY:
THERMAL EFFECTS OF A BATTERY: A battery have constant internal resistance in open load condition but when a load(inductive/resistive) is connected due to the internal resisance the energy loss in the form of heat occurs thus increasing the tempratue of the battery and eventualy increases the whole ambiant temprature.The relationship between generated heat and elergy loss is prpportional in both direction which means with higher temprature energy loss will be greater.
Themprature difference of a battery pack can be occurred due to the following reasons,
- Higher ambiant temprature
- higher load curent
C. SIMULINK BLOCKS: The simulinks blocks are used in the e model can be divided three types which are Electrical blocks, Thermal blocks, simscape blocks.
- Battery(Table based)
- Controlled current source
- voltage sensor
- current sensor
- Electrical Reference
- Thermal source
- Convective Heat Transfer
- Thermal sensor
- Thermal refeence
- Solver configuration
- Gain
- Sum
- Purlse generator
- Switch
- scope
- Display
D. SIMULINK MODEL EXPLANATION:
Fig1.
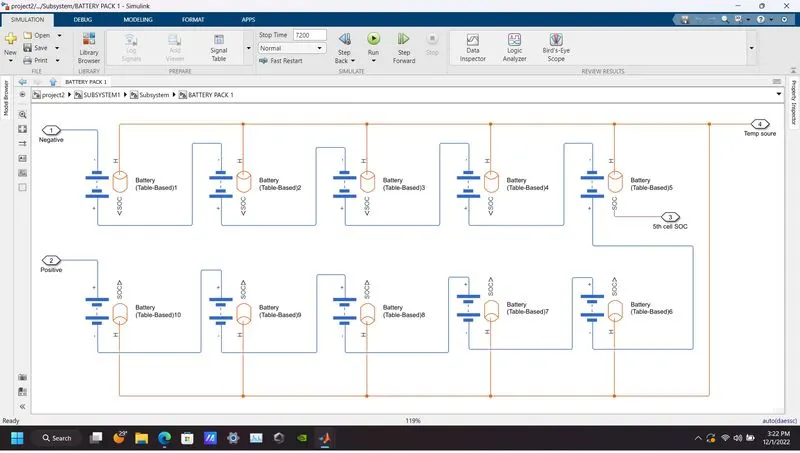
Fig2.
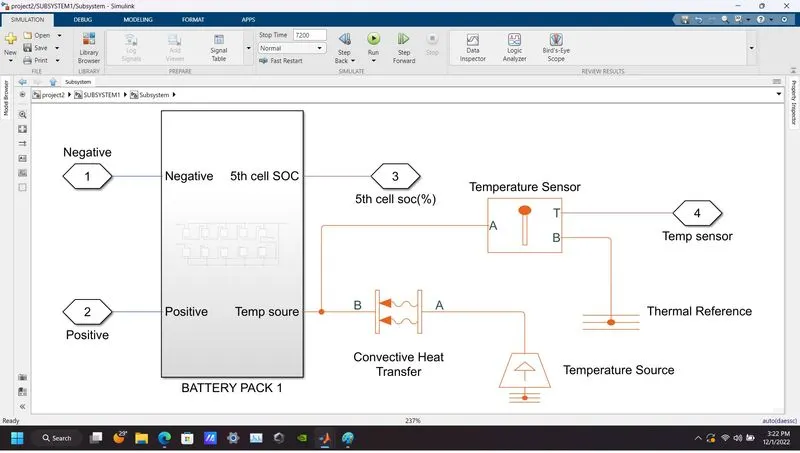
Fig3.
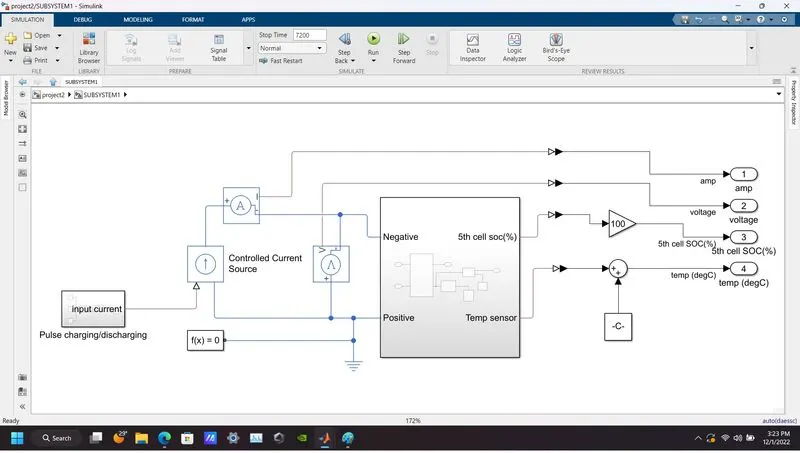
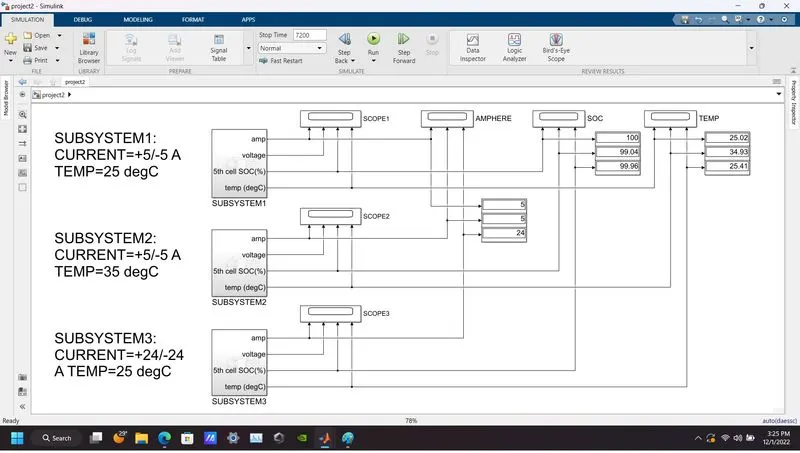
Fig4.
- Step1: Connect 10 no of battery(activate SOC and thermal port) in series and override their data with voltage = 3.6, SOC = 1, and Temp = 25 DegC [fig1]
- Step2: Add a temperature source through a convective heat transfer and add a thermal sensor and reference for scope.[fig2]
- Step3: Create a square wave and add it to the controlled current source and use current and voltage sensors to scope.[Fig3]
- Step4: Add scope and displays accordingly.
In this model a battery pack of 10 cells in series(10S1P) is connected to different loads with different temperatures to observe the change of SOC. Here I only observed the 5th cell of the pack because each cell SOC will represent same percentage as other cells.
E. RESULT OBSERVATION:
6 complete cycle(charge & discharge) was simulated in the above model for 2hr and each cycle is taken for 1200sec.
| Condition | SOC(%) AT THE END OF 2 HOUR | Temperature(°C) AT THE END OF 2 HOUR | DIFFERENCES | REASONS |
| charging /discahrging @ 5A with 25°C | 100% | 25.02°C | 0.02°C HIGH | due to continious charging/discharging a negligeble temp rise can be observed. |
| charging /discahrging @ 5A with 35°C | 99.04% | 34.93°C | 0.06% low | due to high temp is feeded to the system an energy loss was observed (1*4.2*0.96%=4.032*10^-3Coulomb) |
| charging /discahrging @ 5A with 25°C | 99.96% | 25.41°C | 0.04% Low | due to high current is feeded to the system an energy loss was observed (1*4.2*0.04%=1.68*10^-3Coulomb) |
From the above table it can be observed that,
- If temperature is higher than the rated temperature mentioned in any battery datasheet a significant amount of energy loss can occur.
- If current is higher than the rated charge/discharge mentioned in any battery datasheet a moderate amount of energy loss can occur.
- Though the differences observed are very low in the above table one thing we need to understand that the model was simulated only for 2 hour, if the same model can be simulated for as complete life span of battery which may be5 to 10years then the differences will be much higher.