Project 2 Thermal modeling of battery pack
Project 2 Thermal modeling of battery pack
For a 10-cell series lithium-ion battery model, simulate the thermal effects and compare life cycle performance at various temperatures, charge & discharge rates using MATLAB.
Solution: -
Introduction
Day to day life automobile industry is transfer to the Electrical vehicle. In electric vehicle the major concern with lithium-ion batteries is that during the charging/discharging process, the battery produces lots of heat, which causes an increase in battery pack temperature, especially in the cases of higher operating current conditions.
The battery pack used in EVs comprises battery modules and each module consists of a large number of cells/batteries connected in series and parallel, which are installed in a confined space.
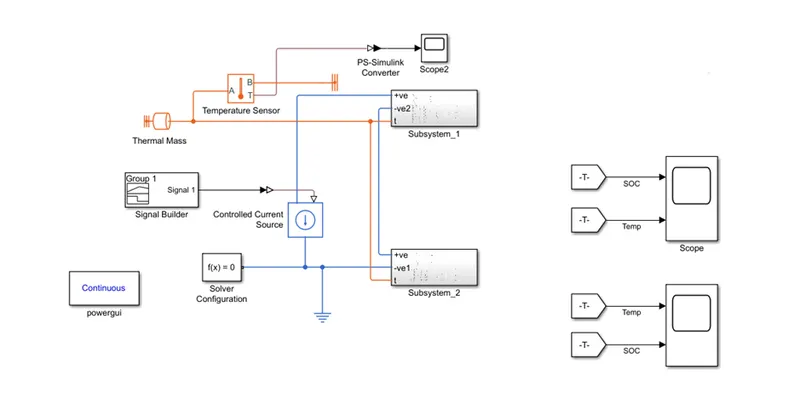
in this project will simulate the project of 10S1P lithium-ion battery pack, we can see the Simulink model
Simulink model: -
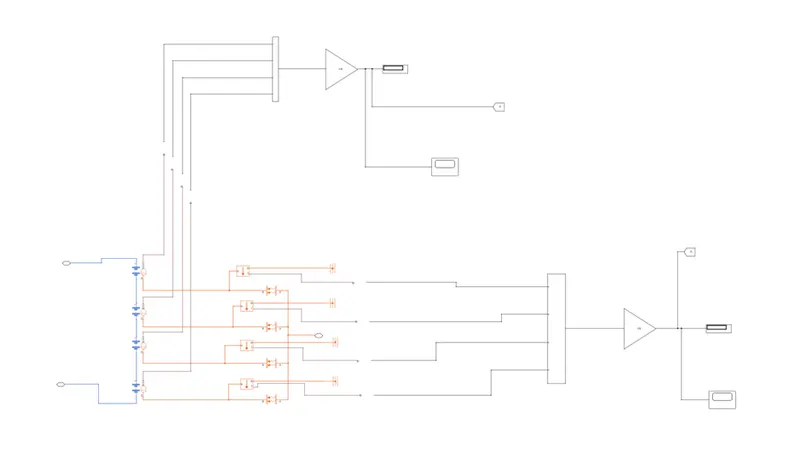
Subsystem_1
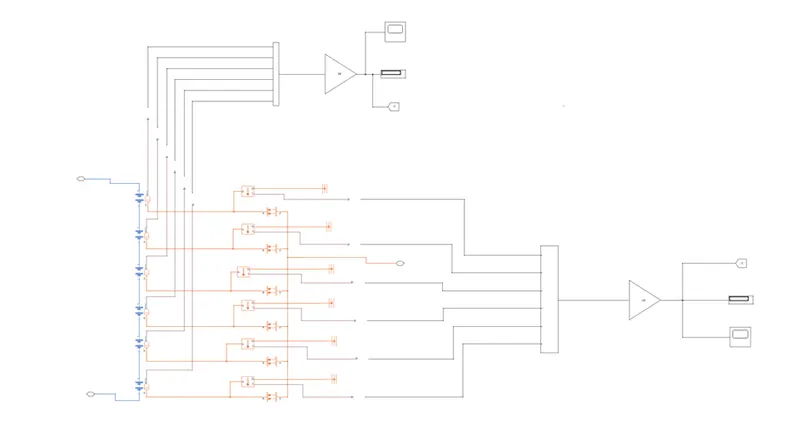
Subsystem_2
We can see, in this Simulink model we can use 10 lithium-ion battery connected in series.
two subsystem fist one 6 battery connected in series and second 4 battery connected in series.
Show the model we can use the Signal builder, Controlled current Source, Temperature Sensor, Thermal mass, battery, Convective heat transfer, Gain, PS-Simulink Converter, Simulink PS-Converter.
Signal Builder: -
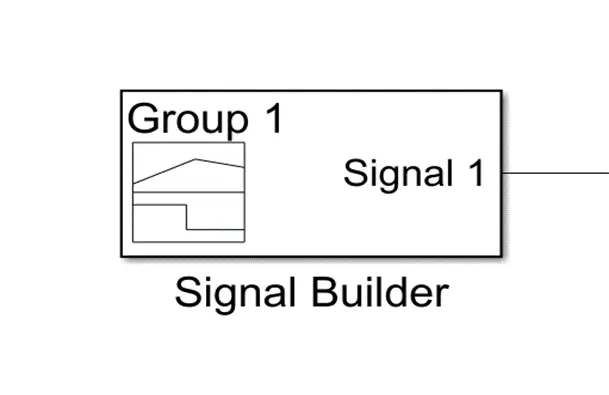
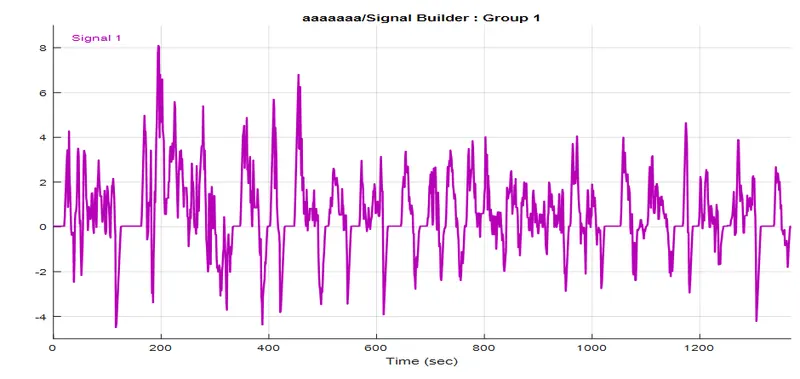
Fistly we can give UDDS current profile to the battery pack with the help of signal Builder, in this UDDS (current Vs time) has bin used to charge and discharge the given period of time 1369 sec.
Controlled current Source: -
The Controlled current Source block converts the Simulink® input signal into an equivalent current source. The generated current is driven by the input signal of the block. The positive current direction is as shown by the arrow in the block icon.
You can initialize the Controlled current Source block with a specific AC or DC source. If you want to start the simulation in steady state, the block input must be connected to a signal starting as a sinusoidal or DC waveform corresponding to the initial values.
Temperature Sensor: -
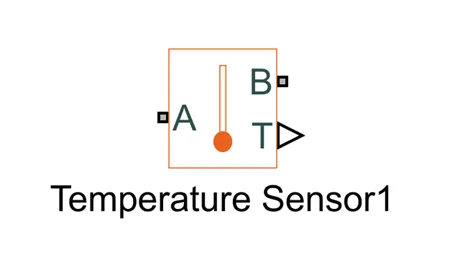
The Temperature Sensor block represents an ideal temperature sensor, that is, a device that determines the temperature differential measured between two points without drawing any heat.
Connections A and B are thermal conserving ports that connect to the two points where temperature is being monitored. Port T is a physical signal port that outputs the temperature differential value.
The block positive direction is from port A to port B. The measured temperature is determined as T = TA – TB.
Thermal mass: -
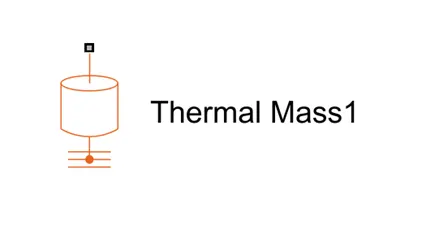
The Thermal mass block represents a Thermal mass, which reflects the ability of a material or a combination of materials to store internal energy. The property is characterized by mass of the material and its specific heat. The Thermal mass is described with the following equation:
Q=c·mdTdt
Battery: -
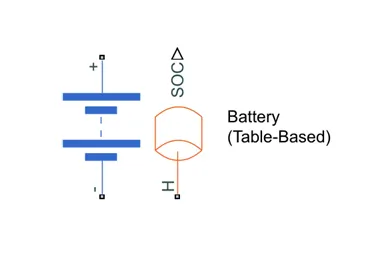
The Battery (Table-Based) block represents a high-fidelity battery model. The block calculates no-load voltage as a function of charge level and optional temperature using lookup tables and includes several modeling options:
- Self-discharge
- Battery fade
- Charge dynamics
- Calendar aging
Convective heat transfer: -
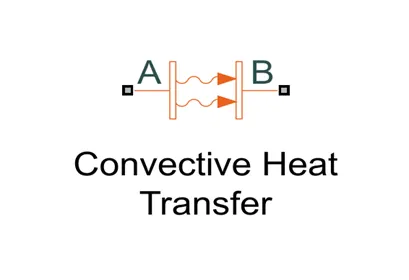
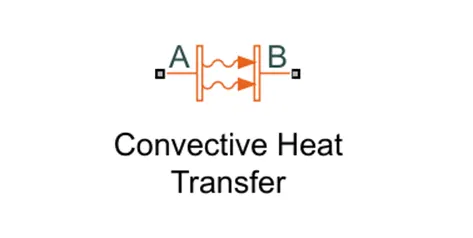
The Convective Heat Transfer block represents a heat transfer by convection between two bodies by means of fluid motion. The transfer is governed by the Newton law of cooling and is described with the following equation:
Q=k·A·(TA−TB)
SOC and Temperacture calculation model: -
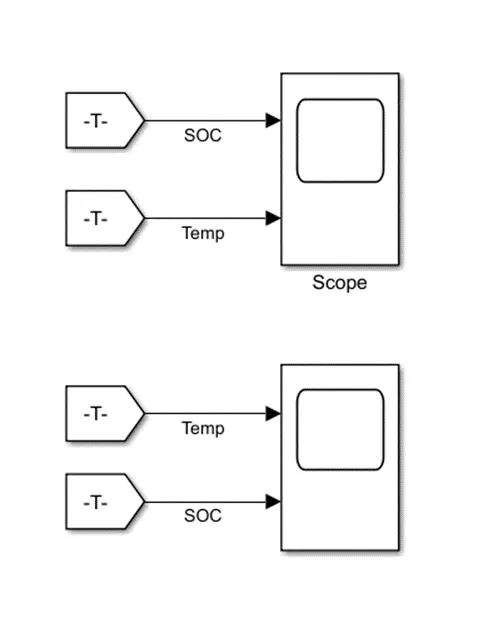
We can use the 2 Goto Block and 2 From block for find SOC and temp.
Results: -
We can see the results for the Fist subsystem 1 to 6 cell and second subsystem 7 to 10 cell.
Now we will be charging by the contact area by 1m^2, 0.1 m^2,10m^2
1m^2
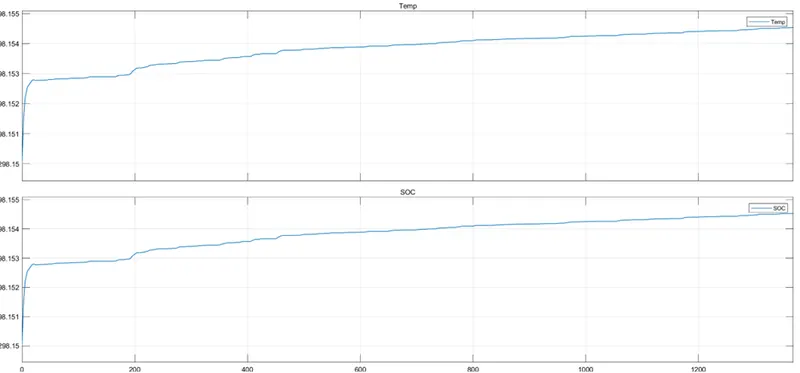
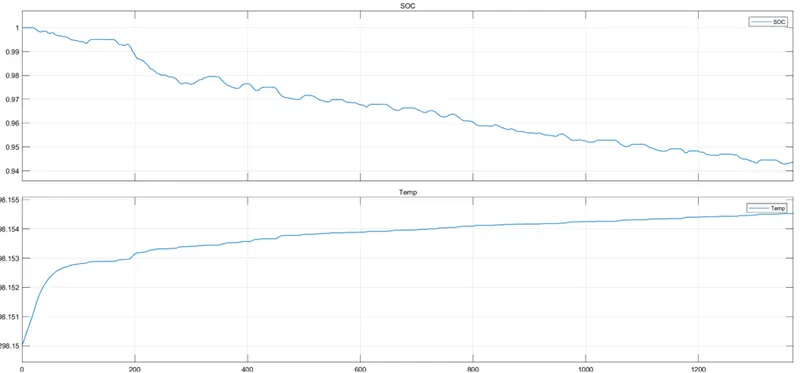
We can see the result if the 6 number of cells connected in series and cell area re 1m^2 at that time SOC are decrease 1 to 0.94 at that time battery are charge discharge continue then we can see the second graph if the temperature is continued increase. 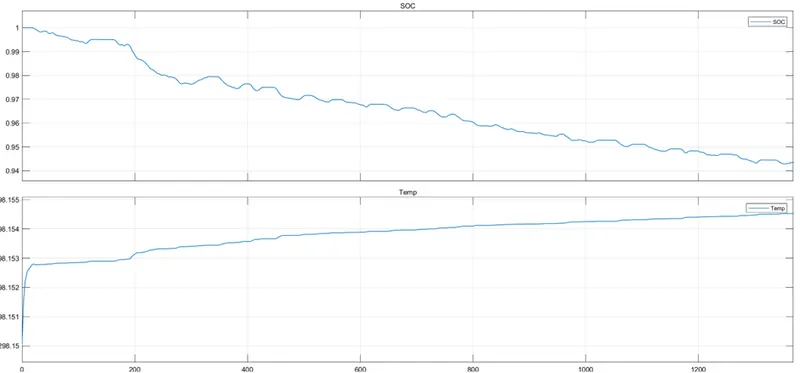
In the same for the remaining connected 4 cells in series we can see and see the output result.
0.1 m^2
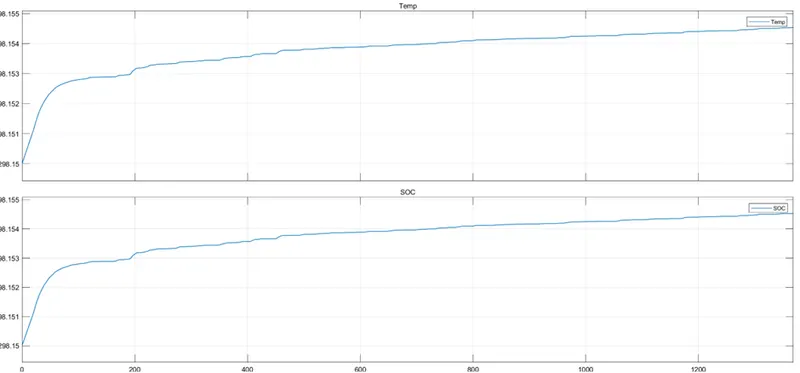
Now, we can change the cell area 0.1m^2 of contact in the all connected series cell then we can see the result.
10m^2
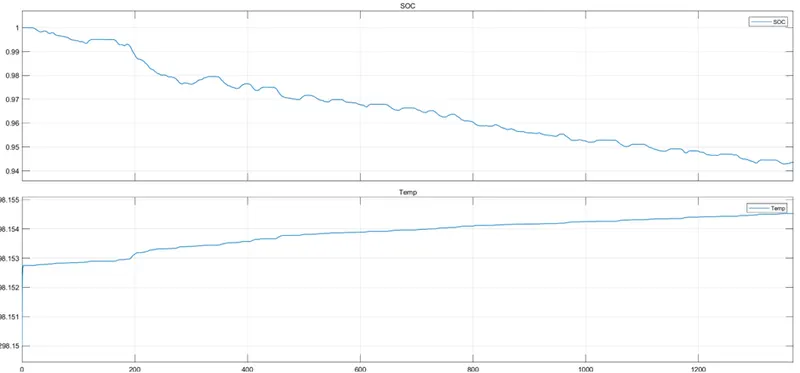
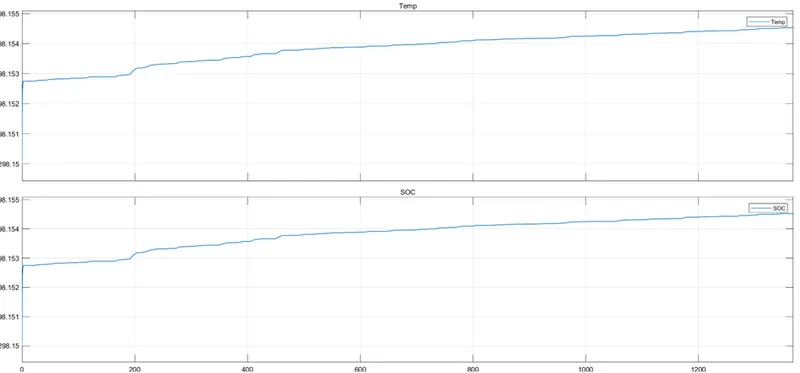
We can see the all three result for cell area contact by 1m^2, 0.1 m^2,10m^2
If the SOC of the battery increase or decrease at that time temperature are increase