Project 2 Thermal modeling of battery pack
Aim:
For a 10 cell series lithium ion battery model, simulate the thermal effects and compare life cycle performance at various temperatures, charge & discharge rates using MATLAB.
Simulink model:
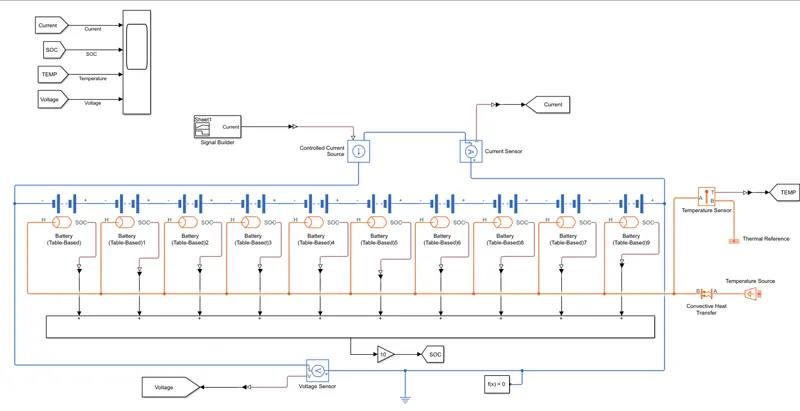
Main blocks and details:
1. Battery (Table-Based)
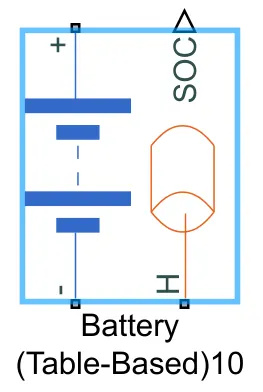
This block models a battery based on tabulated characteristics as functions of state of charge (SOC) and optional temperature (T).
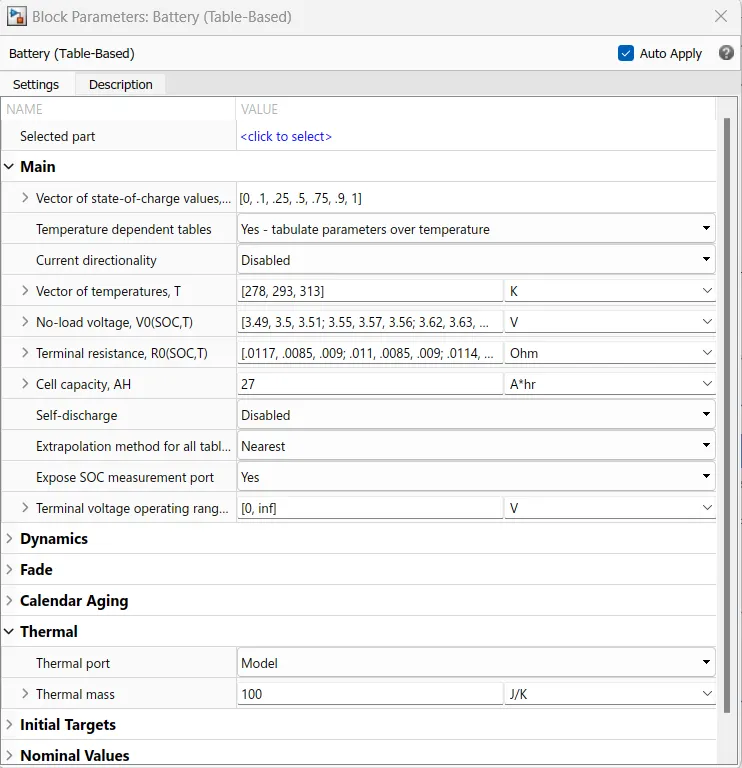
The above figure shows the parameters.
2. Voltage sensor:
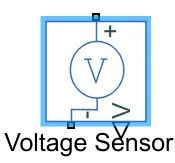
The block represents an ideal voltage sensor, that is, a device that converts voltage measured between any electrical connections into a physical signal proportional to the voltage.
Connections + and - are conserving electrical ports through which the sensor is connected to the circuit. Connection V is a physical signal port that outputs voltage value.
3. Current controlled source:
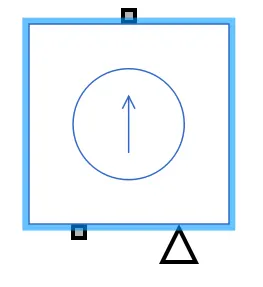
The block represents an ideal current source that is powerful enough to maintain the specified current through it regardless of the voltage across it. The output current is I = Is, where Is is the numerical value presented at the physical signal port.
4. Current sensor:
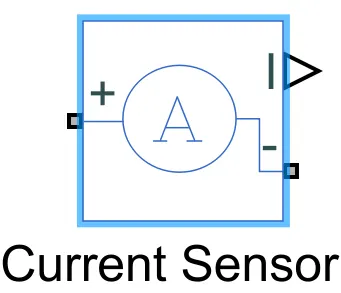
The block represents an ideal current sensor, that is, a device that converts current measured in any electrical branch into a physical signal proportional to the current.
Connections + and - are conserving electrical ports through which the sensor is inserted into the circuit. Connection I is a physical signal port that outputs current value.
5. Convective heat source:
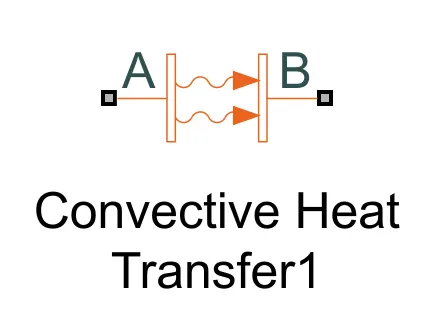
This block models heat transfer in a thermal network by convection due to fluid motion. The rate of heat transfer is proportional to the temperature difference, heat transfer coefficient, and surface area in contact with the fluid.
6. Temperature source:
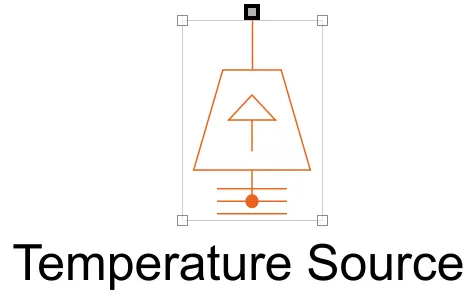
This block represents an ideal energy source in a thermal network that can maintain a constant absolute temperature at the port regardless of the heat flow rate.
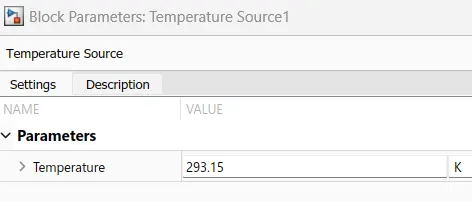
7. Temperature sensor:
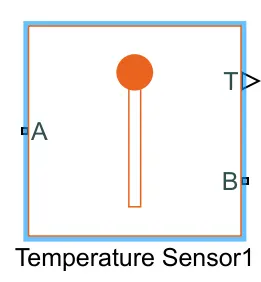
This block measures temperature in a thermal network. There is no heat flow through the sensor. The physical signal port T reports the temperature difference across the sensor. The measurement is positive when the temperature at port A is greater than the temperature at port B.
8. Signal builder:
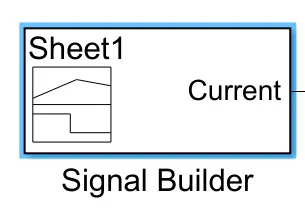
Create and generate interchangeable groups of signals whose waveforms are piecewise linear.
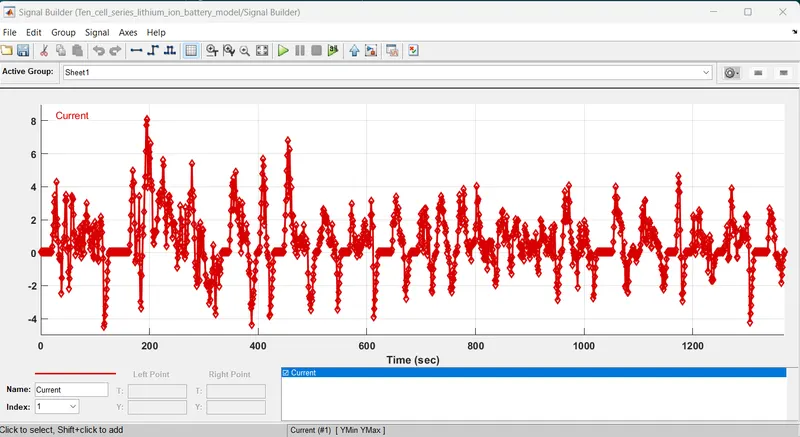
The above signal created by importing UDDS drive cycle data.
Simulink model explanation:
took the table based battery and then kept on thermal and SOC ports and we are using default parameters. Then we conected 10 cells in series with same configuration.so the voltage across the pack is multplied by 10 and the capacity is same through out the pack.
> A voltage sensor is connected to the negetive terminal of the first cell and positive terminal of the last cell. The output of the block is connected to a goto block through a PS-Simulink converter block. The from block is connected to the scope block to recieve the voltage signal.
> SOC port of each cells are connected to a sum block through the PS-Simulink converter and the sum block is connected to a go to block. The from block is conected to the scope to recieve SOC signal.
> The controlled current source is connect to the battery to take the current from the battery and there a current sensor is connected to sense how much current is drawn from the battery and that current is again connected to goto block through ps to simulink converter. The from block is connected to the scope block to recieve the current signal.
> UDDS drive cycle data is used in the form of current with respect to time and a signal builder is used to provide the input to the controlled current sensor.
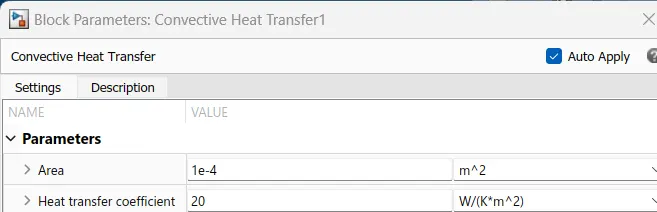
> A convective heat transfer block is connected to the thermal ports of the cells, and the temperature source block is connected to the convective heat transfer block. We may set the contact area and input temperature in the convective heat transfer block.
> To measure the battery temperature, a temperature sensor block is connected between a convective heat transfer block and the thermal ports of the cells. One port of the temperature sensor is connected to the thermal reference block, and another port is connected to a goto block through a PS-Simulink converter. Measured temperature is recieved to the Scope using a from block.
> Finally the solver cofiguration block and electrical referance block are connected to the model.
> The model is simulated for 1369 seconds becouse the the input current is for 1369 seconds only.
Plot result:
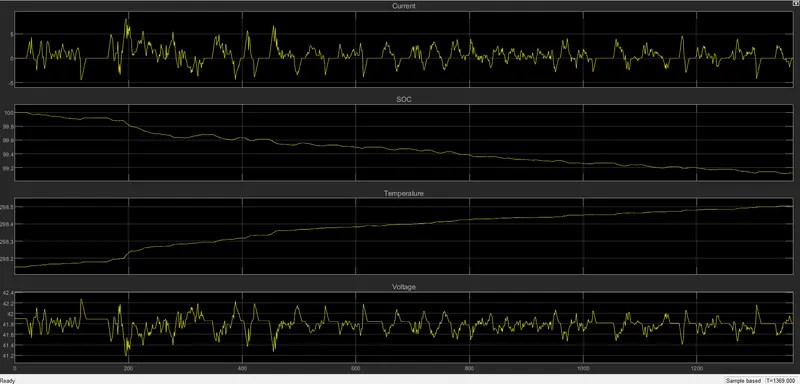
The above graph shows the result for default parameters.
- Here the current is same as given input UDDS drive cycle. The maximum value goes up to 8 and the minimum up to -5 whic shows the regenerative braking.
- The state of charge(SOC) decreases from 100% to 99.1%. Some times it is charging and some times it is discharging according to the current.
- The temperature increases slightly from 298.15k to 298.5k.
- The voltage fluctuation is the final to be discussed. It begins at 41.9 volts and ends at the same 48.9 volts throughout time, increasing and decreasing as the battery is charged or discharged or as per the current drawn from or supplied. 42.3 volts at maximum draw and 41.2 volts at minimum draw.
Changing the temparature to 350k and area to 1 m^3.
Therefore, the result will be
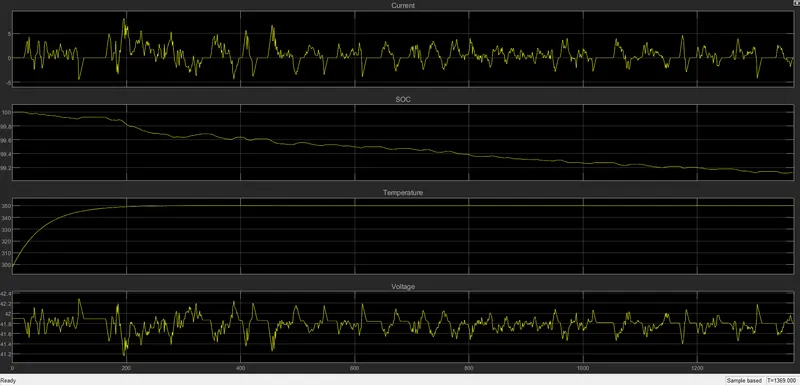
- Here we can see the current is same as earlier result becous it is the input current.
- Becouse of less running time we cannot see any difference in SOC with previouse graph i.e., 100% to 99.1%.
- In temperature we can see from 0 to 200 seconds there is a rise in temperature from 300k to 350k and after 200 seconds it goes constant.
- The Voltage is also similar to previouse graph.
Changing the temperature to 200k and area to 50m^3
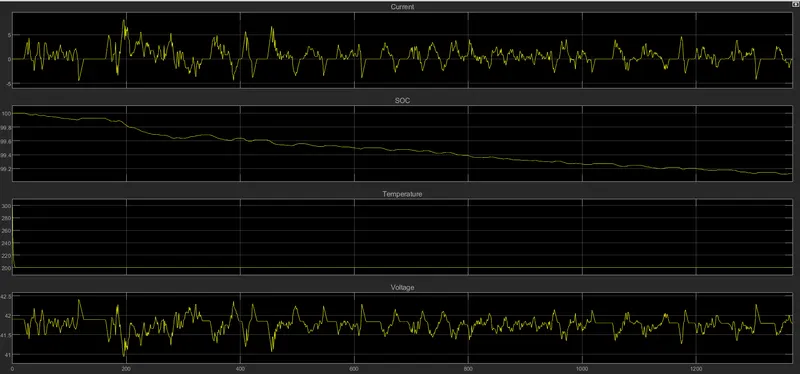
- Here also the current is same as previouse graph
- Becouse of the less running time here also we cannot see any differance in SOC.
- We can see temperature is suddenly decreases from 300k to 200k and it goes constant.
- athe voltage is same as previouse graph.
Conclusion:
Created a thermal model of battery using 10 lithium-ion cells connecting in series and simulated for different temperature and area conditions.
Here when temperature and area changes we cannot see any changes in State of charge(SOC) but in real life Temperature change will always effect the battery life.