Project 2 Thermal modeling of battery pack
Problem Statement -
For a 10 cell series lithium ion battery model, simulate the thermal effects and compare life cycle performance at various temperatures, charge & discharge rates using MATLAB and Simulink.
Model Overview -
-> The model requires you to run a MATLAB script before the model is used that defines the battery parameters such as SoC, Voltage, resistance etc. The script has been taken from a relevant project of a battery pack on the mathworks forum.
% Initialization file for demo ssc_lithium_cell_1RC.mdl. Demo
% based on T. Huria, M. Ceraolo, J. Gazzarri, R. Jackey. "High Fidelity
% Electrical Model with Thermal Dependence for Characterization and
% Simulation of High Power Lithium Battery Cells," IEEE International
% Electric Vehicle Conference, March 2012
%
% Copyright 2012 The MathWorks, Inc.


%% Lookup Table Breakpoints

Battery.SOC_LUT = [0 0.1 0.25 0.5 0.75 0.9 1]';
Battery.Temperature_LUT = [5 20 40] + 273.15;

%% Em Branch Properties (OCV, Capacity)

% Battery capacity
Battery.Capacity_LUT = [
    24  25   26]; %Ampere*hours

% Em open-circuit voltage vs SOC rows and T columns
Battery.Em_LUT = [
    3.4966    3.5057    3.5148
    3.5519    3.5660    3.5653
    3.6183    3.6337    3.6402
    3.7066    3.7127    3.7213
    3.9131    3.9259    3.9376
    4.0748    4.0777    4.0821
    4.1923    4.1928    4.1930]; %Volts

%% Terminal Resistance Properties

% R0 resistance vs SOC rows and T columns
Battery.R0_LUT = [
    0.0117    0.0085    0.0090
    0.0110    0.0085    0.0090
    0.0114    0.0087    0.0092
    0.0107    0.0082    0.0088
    0.0107    0.0083    0.0091
    0.0113    0.0085    0.0089
    0.0116    0.0085    0.0089]; %Ohms

%% RC Branch 1 Properties

% R1 Resistance vs SOC rows and T columns
Battery.R1_LUT = [
    0.0109    0.0029    0.0013
    0.0069    0.0024    0.0012
    0.0047    0.0026    0.0013
    0.0034    0.0016    0.0010
    0.0033    0.0023    0.0014
    0.0033    0.0018    0.0011
    0.0028    0.0017    0.0011]; %Ohms

% C1 Capacitance vs SOC rows and T columns
Battery.C1_LUT = [
    1913.6    12447    30609
    4625.7    18872    32995
    23306     40764    47535
    10736     18721    26325
    18036     33630    48274
    12251     18360    26839
    9022.9    23394    30606]; %Farads


%% Thermal Properties

% Cell dimensions and sizes
cell_thickness = 0.0084; %m
cell_width = 0.215; %m
cell_height = 0.220; %m

% Cell surface area
cell_area = 2 * (...
    cell_thickness * cell_width +...
    cell_thickness * cell_height +...
    cell_width * cell_height); %m^2

% Cell volume
cell_volume = cell_thickness * cell_width * cell_height; %m^3

% Cell mass
Battery.cell_mass = 1; %kg

% Volumetric heat capacity
% assumes uniform heat capacity throughout the cell
% ref: J. Electrochemical Society 158 (8) A955-A969 (2011) pA962
cell_rho_Cp = 2.04E6; %J/m3/K

% Specific Heat
Battery.cell_Cp_heat = cell_rho_Cp * cell_volume; %J/kg/K

% Convective heat transfer coefficient
% For natural convection this number should be in the range of 5 to 25
h_conv = 5; %W/m^2/K
h_conv_end = 5; %W/m^2/K

%% Initial Conditions

% Charge deficit
Battery.Qe_init = 15.6845; %Ampere*hours

% Ambient Temperature
Battery.T_init = 20 + 273.15; %K
-> The model consists of 4 subsystems -
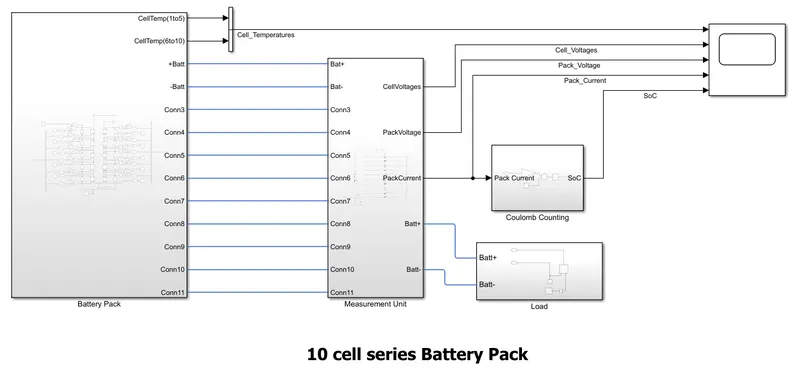
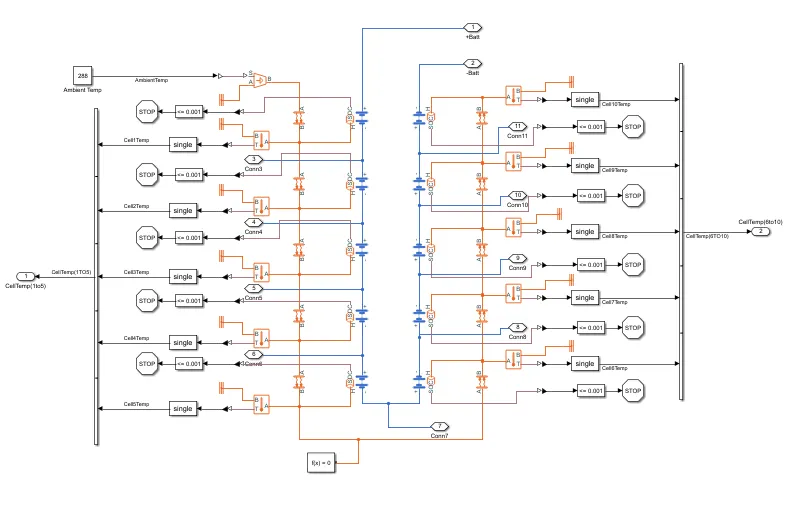
1. Battery Pack - The battery pack is made up of 10 series cells. Each cell has an average nominal voltage of 3.6V and a 25Ah capacity. Each cell is a simscape block named - Battery:(Table Based)(Instrumented and Thermal Port). The variables from the code are used to deine the battery parameters. Thermal port of each cell is connected to a temperature sensor. A temperature source is used to replicate ambient temperature and is connected to the thermal port of each cell through convective transfer block. This means the cells are not in contant and only transer of heat is through convection between the batteries and atmosphere. The instrument port of each cell outputs the SoC of each cell, the value of which is compared to the constant 0.001, which when reached, the simulation should stop. The output of the temperature sensor is converted to single precision data type to reduce computation time and fed to a vector concatenate to gather all signals.
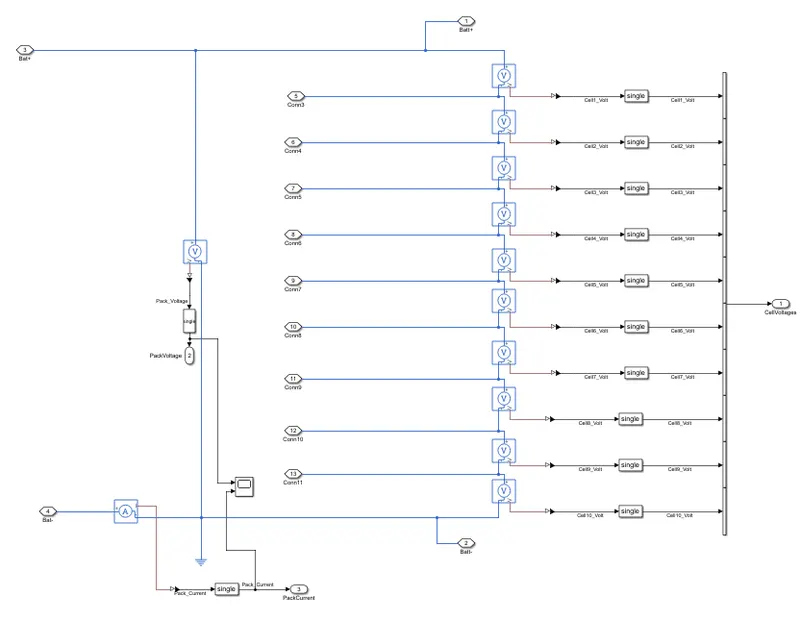
2. Measurement Unit - The subsystem is responsible for measuring the pack current , pack voltage and the voltage of each cell.
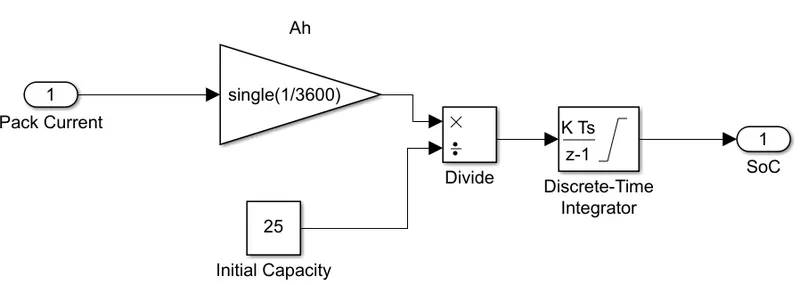
3. SoC estimation - The subsystem uses the coulomb counting method to estimate the state of charge. The Coulomb counting method measures the discharging current of a battery and integrates the discharging current over time in order to estimate SOC. This method can be used in this case safely without worrying about errors since the load current is constant.
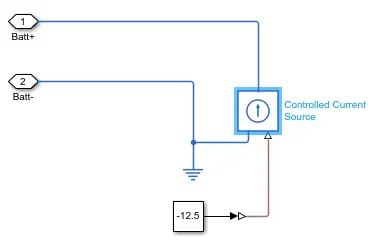
4. Load - The load consists of a controlled current source that charges the battery pack with a positve value of current and discharges the battery pack with a negative value of current.
Observations -
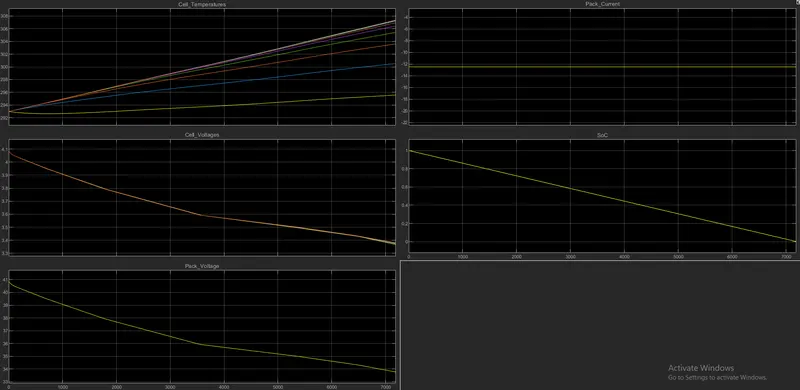
1.) 0.5 c-rate(12.5 Amps discharge current) / Ambient Temp - 288K | 15 degrees celsius - As expected the battery dies after approximately 7200 seconds or two hours. The temperatures stays in control and the voltage drop is as expected too.
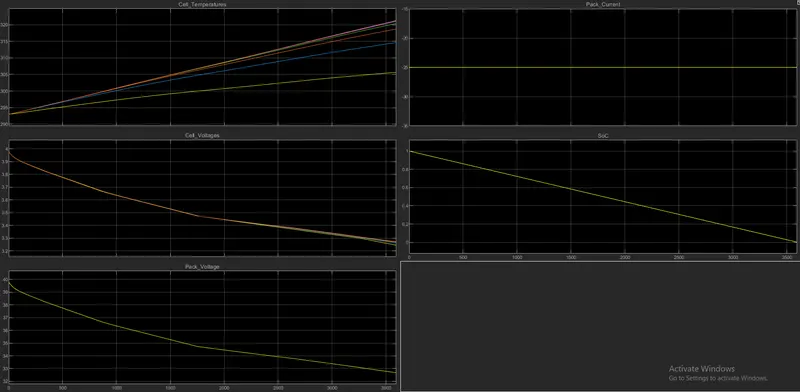
2.) 1 c-rate(25 Amps discharge current) / Ambient Temp - 288K | 15 degrees celsius - The battery lasts one hour and the voltage drop as well as the temprature rise are steeper.
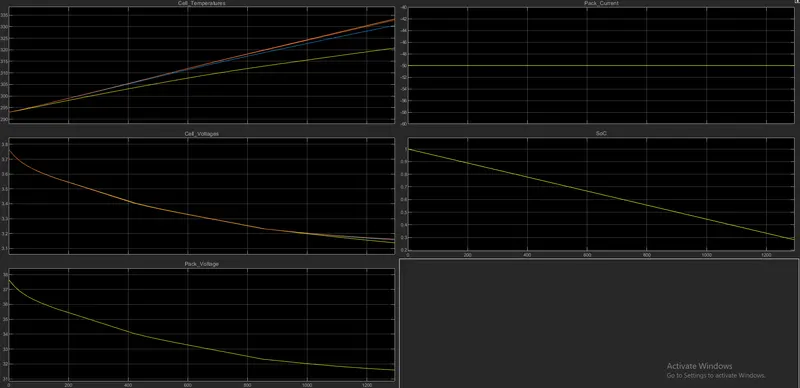
3.) 2 c-rate(50 Amps discharge current) / Ambient Temp - 288K | 15 degrees celsius - This scenario is alomst fatal for the battery because the simulation stops at 1200s with an error that is caused by zero internal resistance one of the cells which showcases a situation of therml runaway since the cell temperature reaches 330k which is approximately 60 degrees celsius which is out of the operating region of the cells. The battery pack needs additional cooling to run for this discharge rate.
4.) 0.5 c-rate(12.5 Amps discharge current) / Ambient Temp - 313K | 40 degrees celsius - Cell temperatures are quite high and the voltage drop too is steeper but the battery pack survives it at the given c-rate.
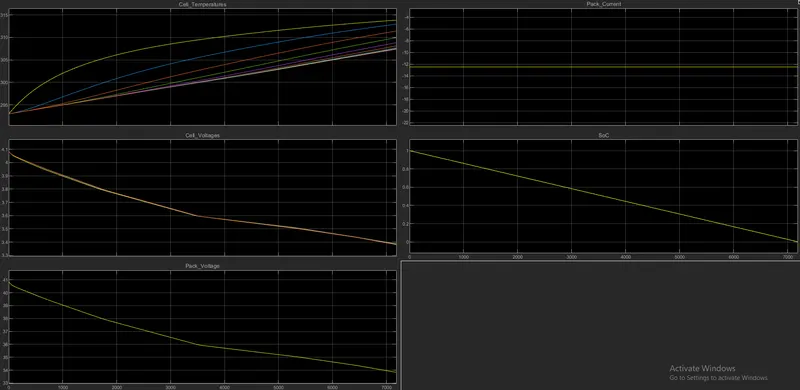
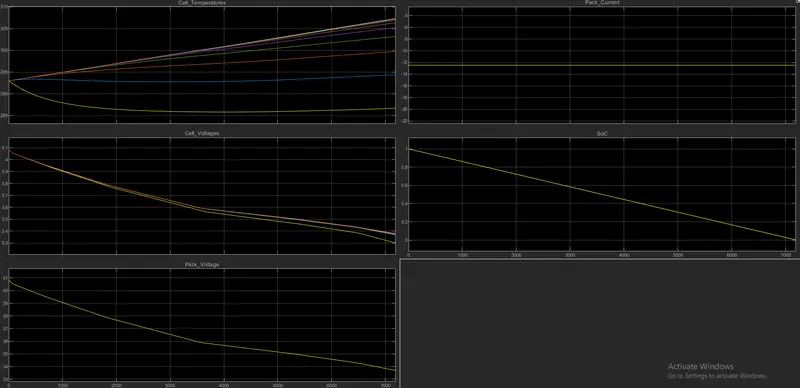
5.) 0.5 c-rate(12.5 Amps discharge current) / Ambient Temp - 275K | 2 degrees celsius - Voltahe drop is steeper due to the high internal resistance but the battery survives the given c - rate and discharge duration.
Google drive link -
https://drive.google.com/drive/folders/1bJevitZlkp83ZMgr6MBU09wYjgZSQQly?usp=sharing