Project 2 Thermal modeling of battery pack
For a 10 cell series lithium ion battery model, simulate the thermal effects and compare life cycle performance at various temperatures, charge & discharge rates using MATLAB.
Answer :
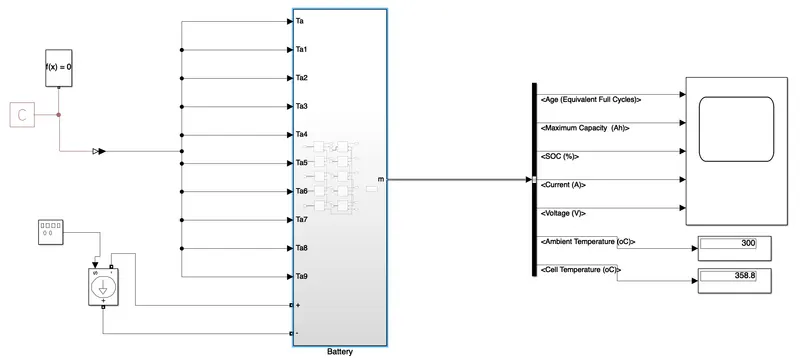
The Function blocks used to design the model as per given requirements are as follows :
- Battery of 10 numbers and all connected in series
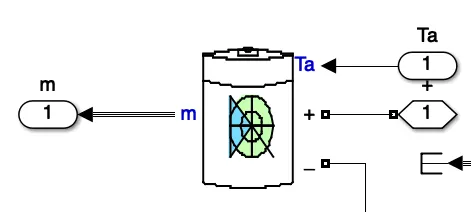
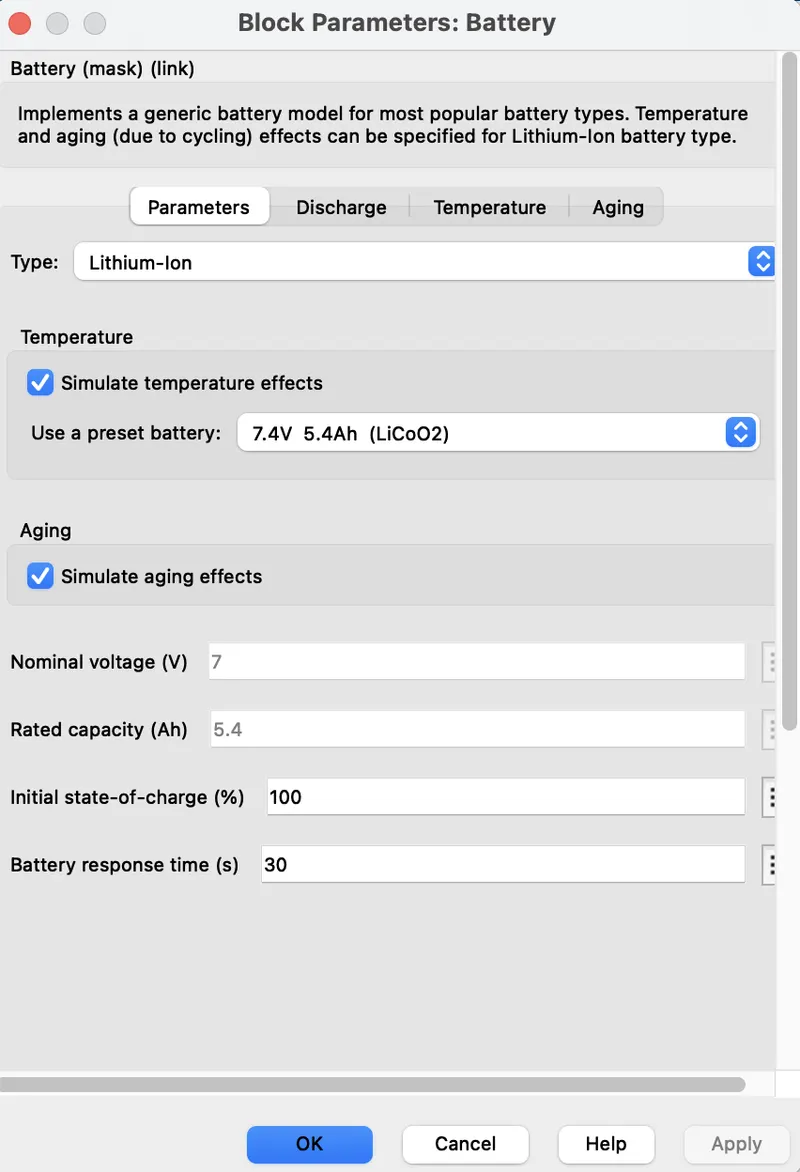
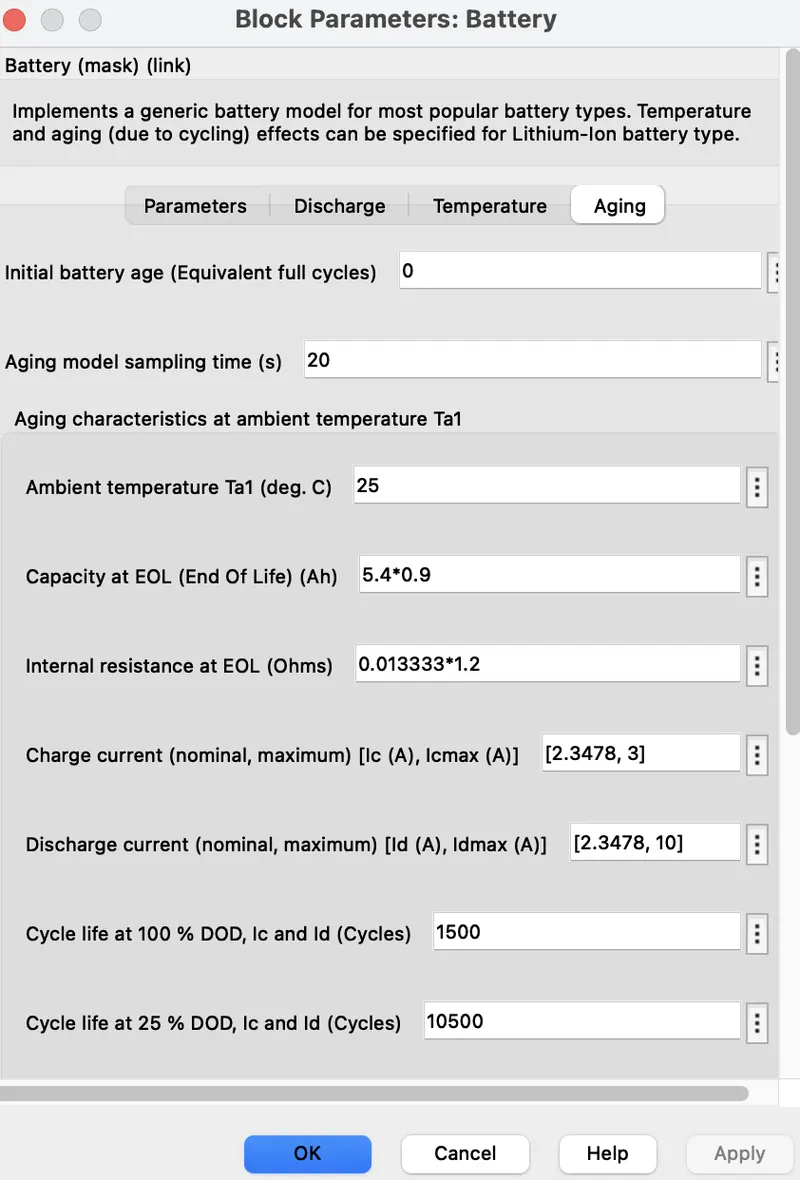
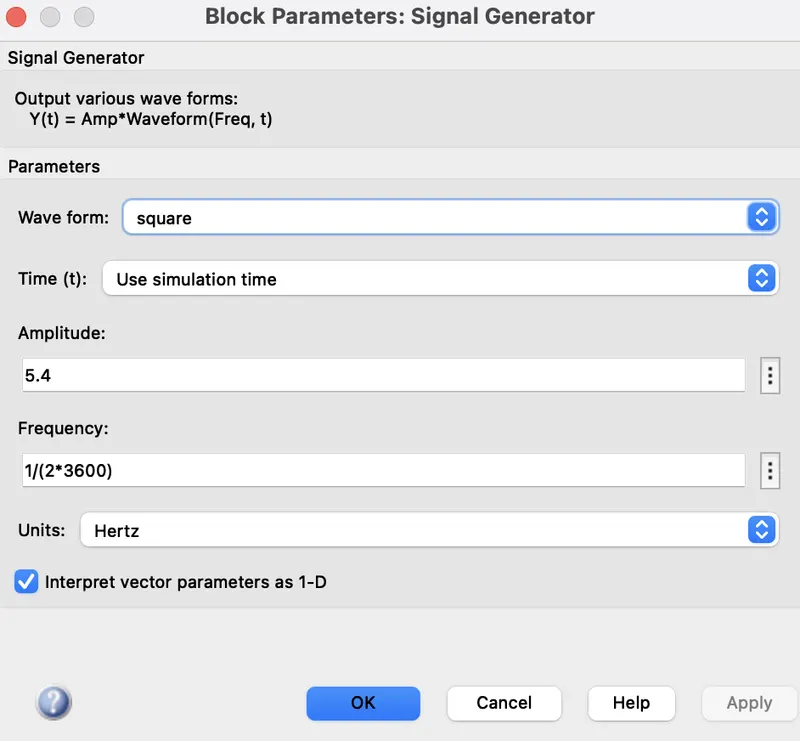
- Square wave Generator as input signal
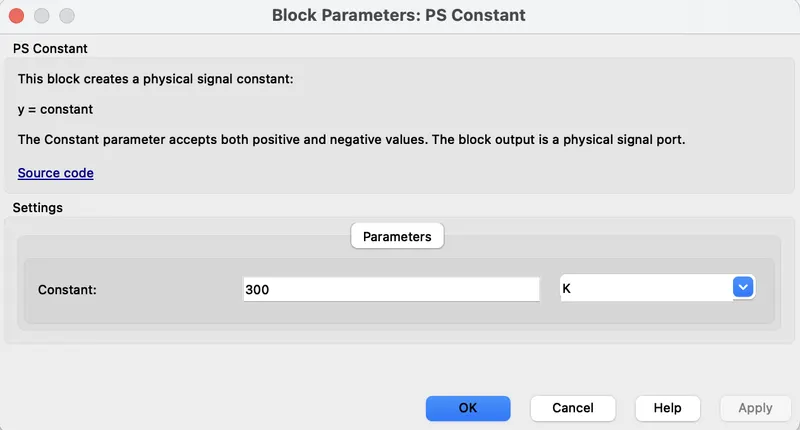
- PS Constant to vary temperature as input
- Controlled Current Source to control the current
- Bus Selector
- PS Simulink Converter
- Solver Configuration
- Powergui
- Scope
- Display
The Design model is below and even the file is attached.
Series of 10 cells are connected in series.
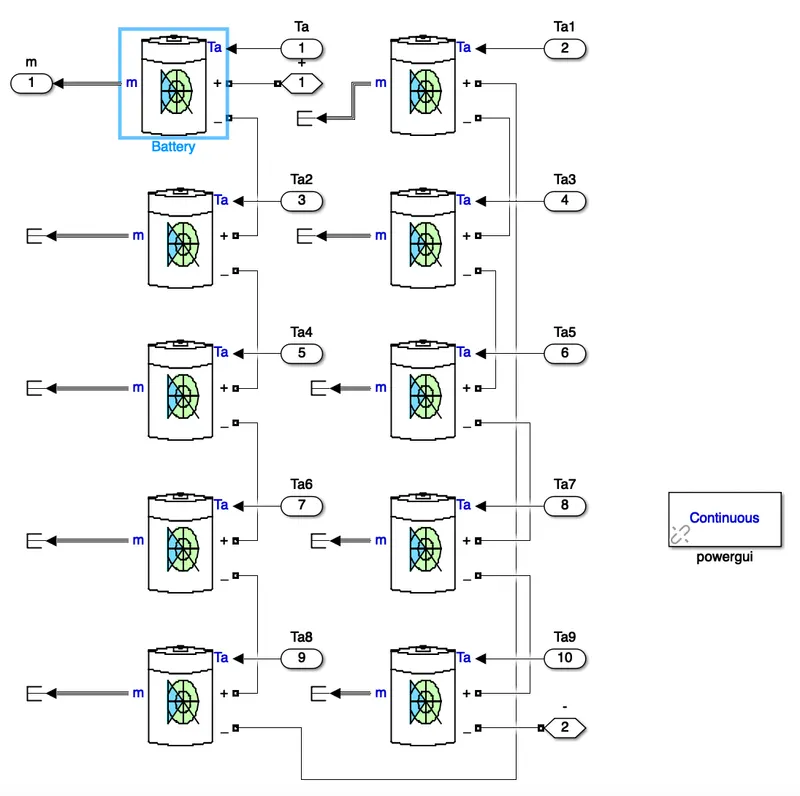
The Simulation is done for 3600 sec of 10 cycles with 1C rate
During 300K
Scope Output :
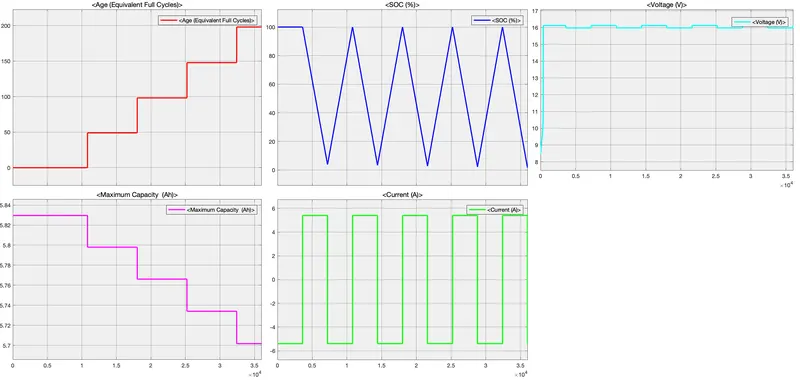
Result :
- Plot 1- It shows that life cycle of battery pack i.e., its around 200
- Plot 2- Shows the SOC, intially the battery is fully charged and discharged almost to 5% and again its starts charging up to 100 depending on the input given.
- Plot 3- Shows the Voltage of battery and its around 16V we can there is slight fall in voltage during discharging.
- Plot 4- Shows the maximum capacity of the battery, We can see that there is fall in capacity and its almost 5.7Ah.
- Plot 5- We can see that the current is fluctuating between +5.4A and -5.4A, its indicates the discharging and charging states of the battery.
- In the display we can see that the ambient temperature we have given is 300K but the cell temperature is 358.8K which is around 1.20% increase of ambient temperature.
During 306K
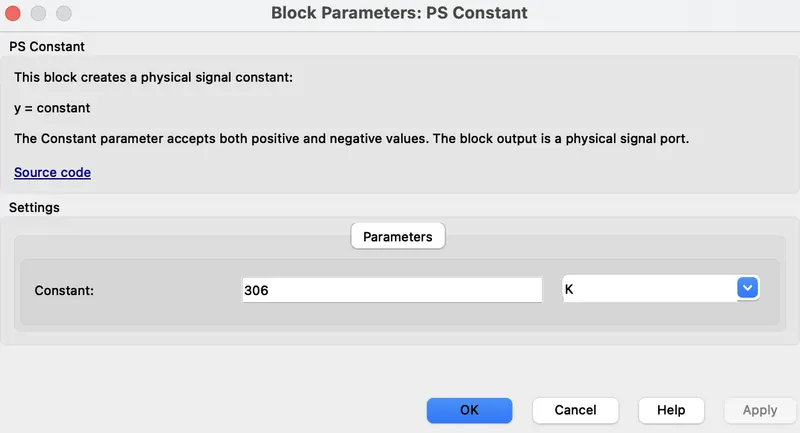
Scope Output :
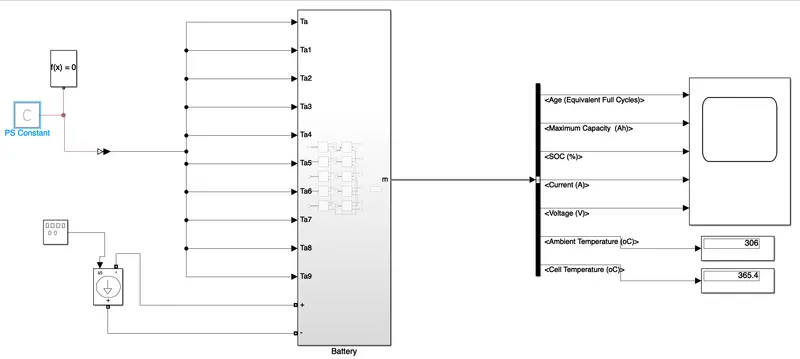
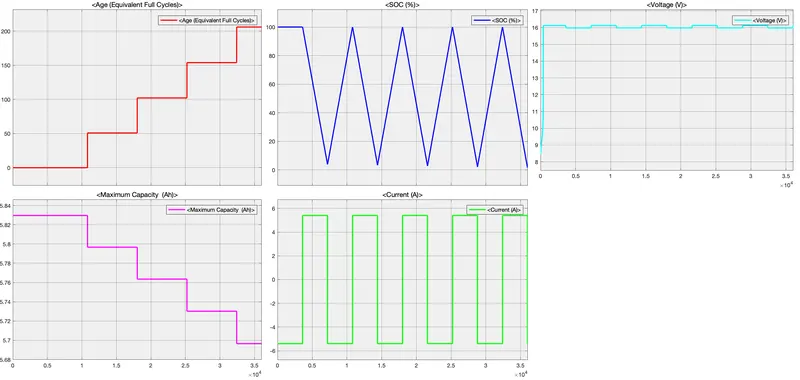
Result :
- Plot 1- It shows that life cycle of battery pack i.e., its around 210
- Plot 2- Shows the SOC, intially the battery is fully charged and discharged almost to 5% and again its starts charging up to 100 depending on the input given.
- Plot 3- Shows the Voltage of battery and its around 16V we can there is slight fall in voltage during discharging.
- Plot 4- Shows the maximum capacity of the battery, We can see that there is fall in capacity and its almost 5.65Ah.
- Plot 5- We can see that the current is fluctuating between +5.4A and -5.4A, its indicates the discharging and charging states of the battery.
- In the display we can see that the ambient temperature we have given is 300K but the cell temperature is 365.4K which is around 1.22% increase of ambient temperature.
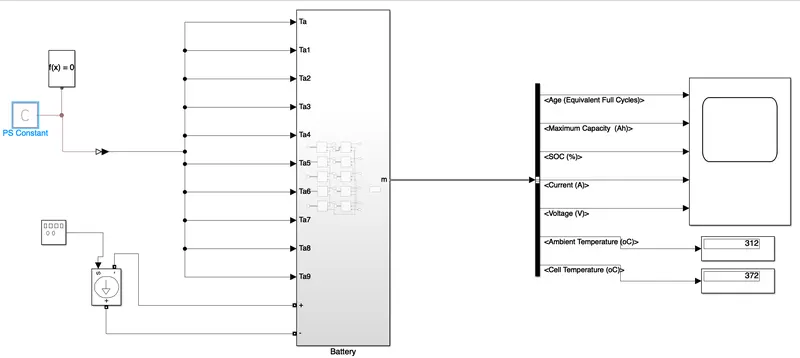
During 312K
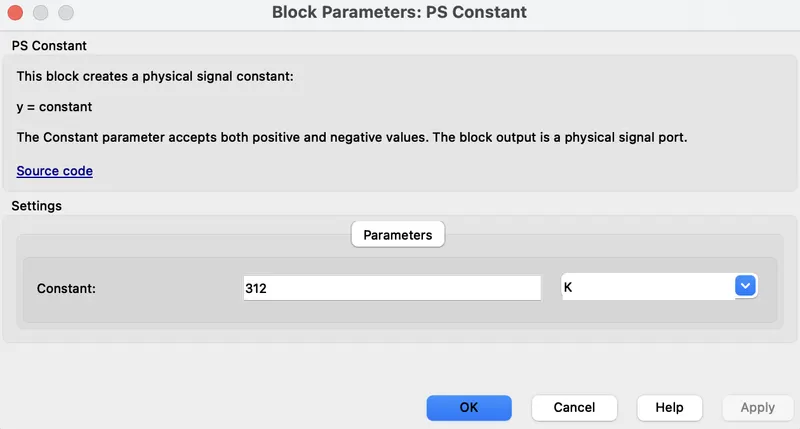
Scope Output :
Result :
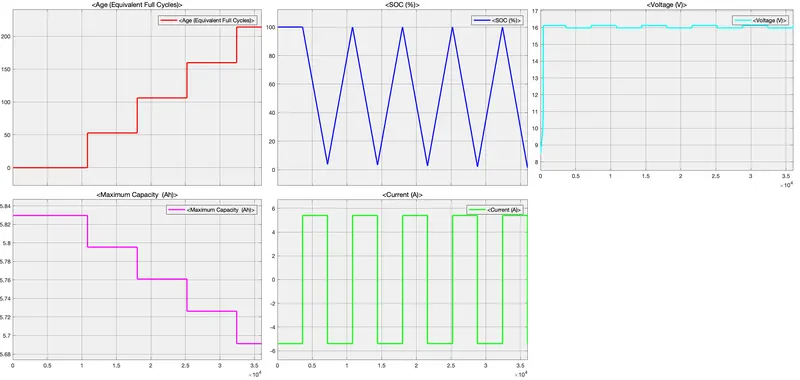
- Plot 1- It shows that life cycle of battery pack i.e., its around 250
- Plot 2- Shows the SOC, intially the battery is fully charged and discharged almost to 5% and again its starts charging up to 100 depending on the input given.
- Plot 3- Shows the Voltage of battery and its around 16V we can there is slight fall in voltage during discharging.
- Plot 4- Shows the maximum capacity of the battery, We can see that there is fall in capacity and its almost 5.60Ah.
- Plot 5- We can see that the current is fluctuating between +5.4A and -5.4A, its indicates the discharging and charging states of the battery.
- In the display we can see that the ambient temperature we have given is 300K but the cell temperature is 372K which is around 1.19% increase of ambient temperature.
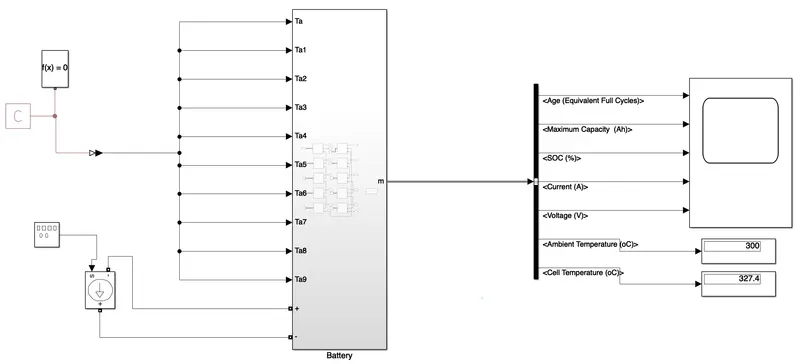
The Simulation is done for 3600 sec of 10 cycles with 0.5C rate
During 300K
Scope Output :
Result :
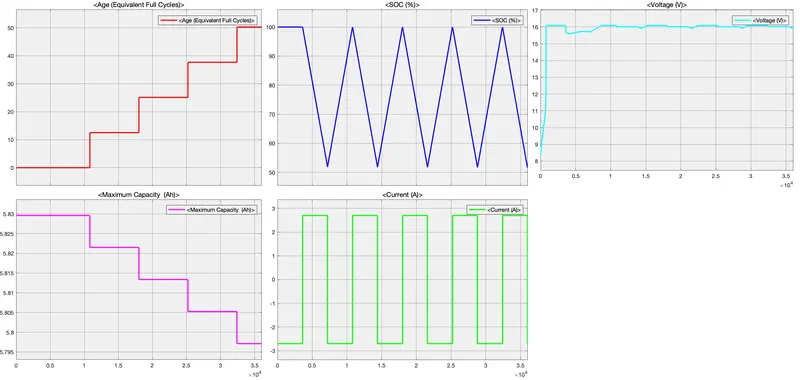
- Plot 1- It shows that life cycle of battery pack i.e., its around 50
- Plot 2- Shows the SOC, intially the battery is fully charged and discharged almost to 50% and again its starts charging up to 100 depending on the input given.
- Plot 3- Shows the Voltage of battery and its around 16V we can there is slight fall in voltage during discharging.
- Plot 4- Shows the maximum capacity of the battery, We can see that there is fall in capacity and its almost 5.8Ah.
- Plot 5- We can see that the current is fluctuating between +2.7A and -2.7A, its indicates the discharging and charging states of the battery.
- In the display we can see that the ambient temperature we have given is 300K but the cell temperature is 327.4K which is around 1.09% increase of ambient temperature.
During 306K
Scope Output :
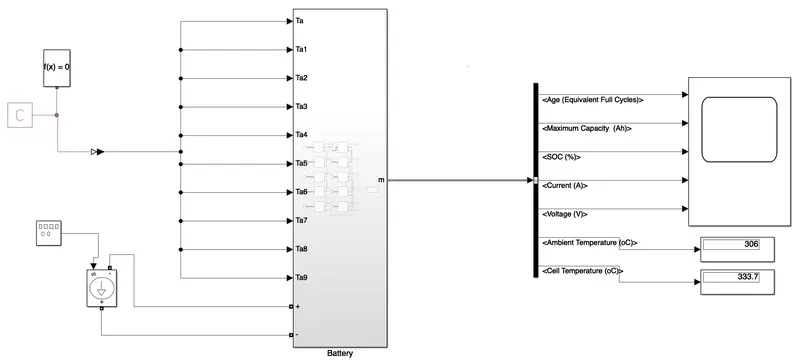
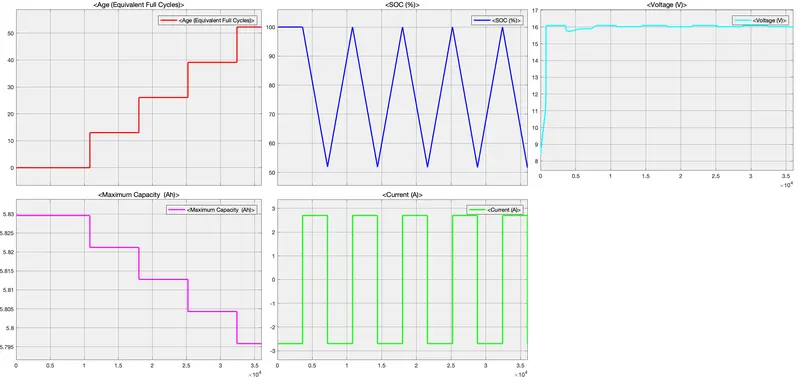
Result :
- Plot 1- It shows that life cycle of battery pack i.e., its around 55
- Plot 2- Shows the SOC, intially the battery is fully charged and discharged almost to 50% and again its starts charging up to 100 depending on the input given.
- Plot 3- Shows the Voltage of battery and its around 16V we can there is slight fall in voltage during discharging.
- Plot 4- Shows the maximum capacity of the battery, We can see that there is fall in capacity and its almost 5.795Ah.
- Plot 5- We can see that the current is fluctuating between +2.7A and -2.7A, its indicates the discharging and charging states of the battery.
- In the display we can see that the ambient temperature we have given is 300K but the cell temperature is 333.7K which is around 1.11% increase of ambient temperature.
During 312K
Scope Output :
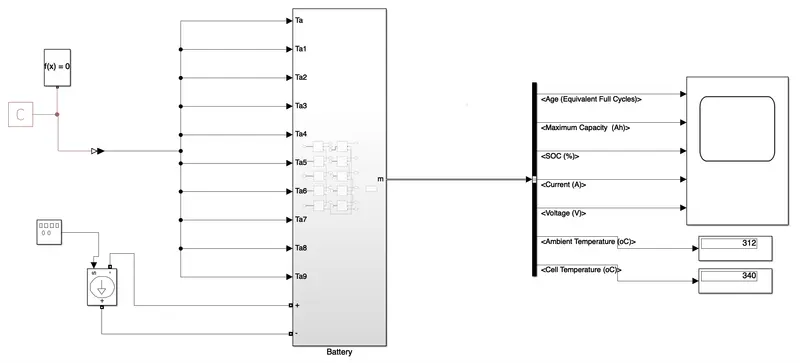
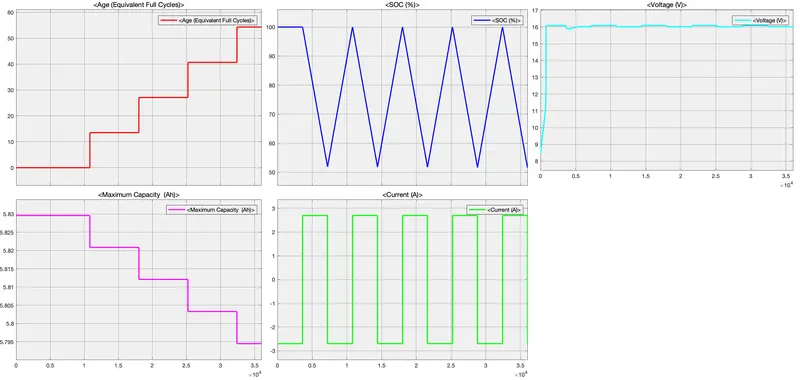
Result :
- Plot 1- It shows that life cycle of battery pack i.e., its around 60
- Plot 2- Shows the SOC, intially the battery is fully charged and discharged almost to 50% and again its starts charging up to 100 depending on the input given.
- Plot 3- Shows the Voltage of battery and its around 16V we can there is slight fall in voltage during discharging.
- Plot 4- Shows the maximum capacity of the battery, We can see that there is fall in capacity and its almost 5.79Ah.
- Plot 5- We can see that the current is fluctuating between +2.7A and -2.7A, its indicates the discharging and charging states of the battery.
- In the display we can see that the ambient temperature we have given is 300K but the cell temperature is 340K which is around 1.13% increase of ambient temperature.
Conclution :
As per my simulation model,
- The rise in temperature increases life of the cycle of the battery pack in both cases.
- Maximum Capacity falls down slightly and slowly depending on the rise in temperature in both cases
- Voltage remains almost same in both cases.
- The Current varies between positive and negative as per C-rate respectively.
- There is around 1-12% increase in the cell temperature when compared to the ambient temperature.
- During 1C-rate SOC is nearby zero but during 0.5C-rate it is almost to 50%.