Project 2 Thermal modeling of battery pack
Project 2:
For a 10-cell series lithium-ion battery model, simulate the thermal effects and compare life cycle performance at various temperatures, charge & discharge rates using MATLAB.
Answer:
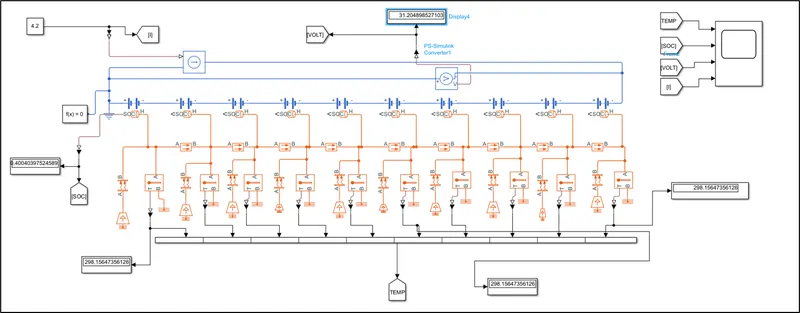
Below is the Simscape model created for the required simulation. The simulations were run at different ambient temperatures (0, 25, & 50 C) and under constant current charge & discharge scenarios.
Key notes regarding the model:
- 10 cells are connected in series each having capacity (4.2Ah) and no load voltage of 3.6V (max).
- In order to analyze the thermal profile of the pack, below design is implemented:
- Ambient temperature effect is added to the system by having convection heat block. The area of heat transfer is entered as 0.0063737 m2 is considered for the 1st & last cell and half of the area for the remaining cells with heat transfer coefficient of 20 W/m2
- Temperature effect of the adjacent battery is added to the system by having conduction heat block. The area of heat transfer is entered as 0.00063737 m2 which is 10% of the surface area
- Temperature of each cell is connected to the concatenate block to display the results
Cell Area Calculation:
Based on the specification sheet and online data, area of the cell is calculated based on the below cell dimensions:
|
Manufacturer |
A123-Systems |
|
Type |
Cylindrical |
|
Model |
ANR26650m1-B |
|
Length [m] |
0.065 |
|
Diameter [m] |
0.026 |
|
Mass [kg] |
0.076 |
|
Surface area of 1 cell |
0.006373714285714290 m2 |
Simulations output:
As per discussed above, extensive simulations were run understand the charge/discharge characteristics of the battery pack with regards to the ambient temperature.
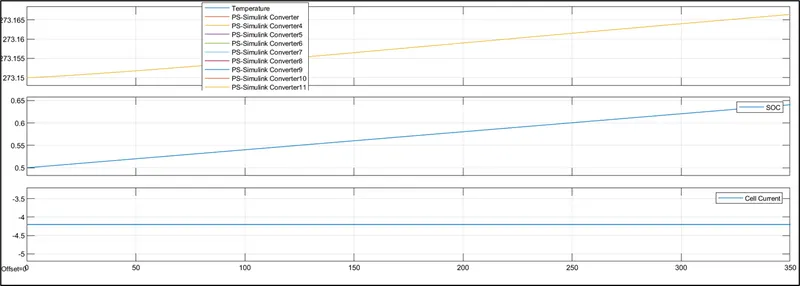
- For charge current: 4.2A, Ambient temperature: 0 C, Run time: 350 sec
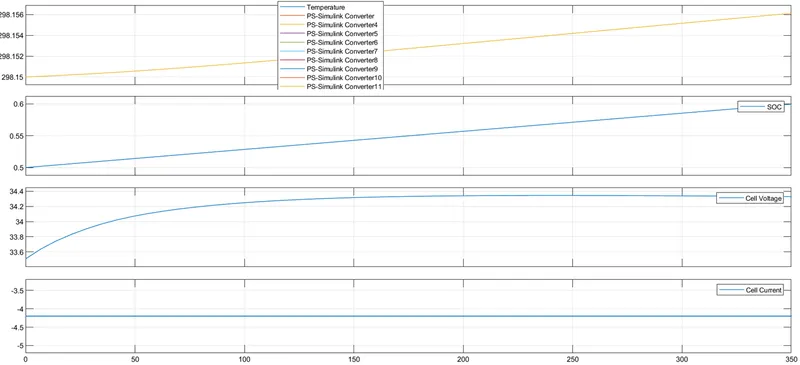
- For charge current: 4.2A, Ambient temperature: 25 C, Run time: 350 sec
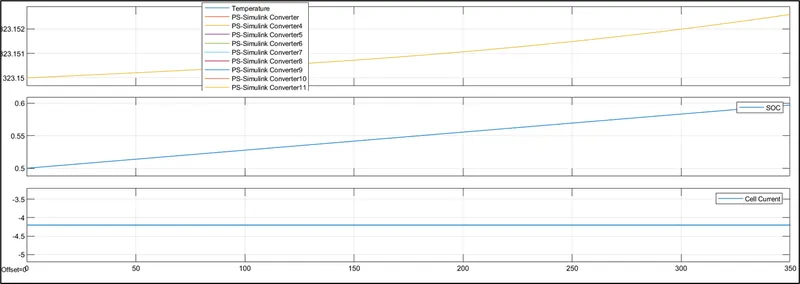
- For charge current: 4.2A, Ambient temperature: 50 C, Run time: 350 sec
- For discharge current: 4.2A, Ambient temperature: 0 C, Run time: 350 sec
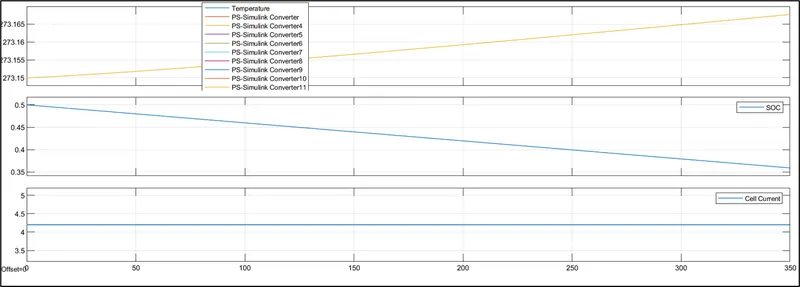
- For discharge current: 4.2A, Ambient temperature: 25 C, Run time: 350 sec
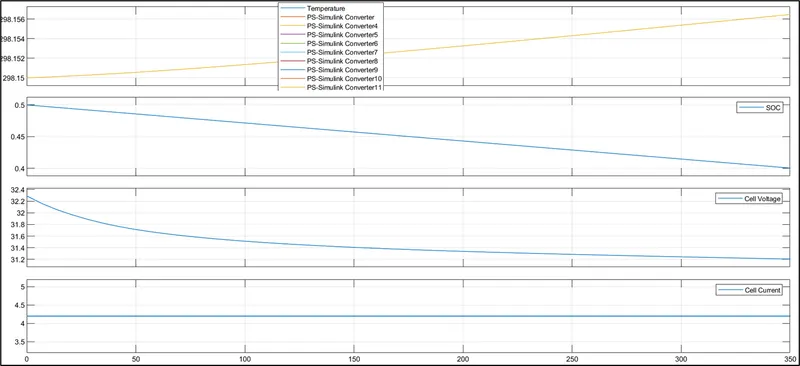
- For discharge current: 4.2A, Ambient temperature: 50 C, Run time: 350 sec
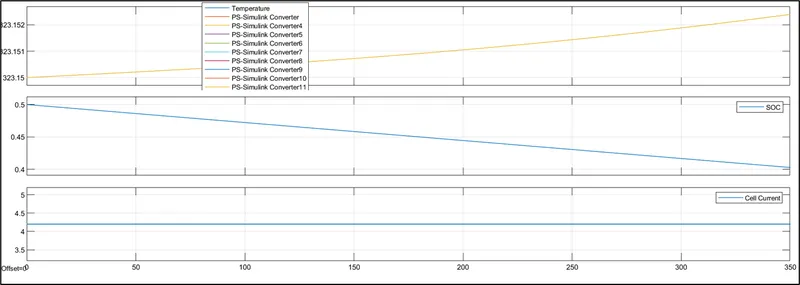
Below is the summary table with all simulations:
Discharge Profile:
|
Simulation Runs |
Ambient Temperature (Initial) |
Discharge Profile |
|||||
|
In Celcius © |
In Kelvin (K) |
Initial SOC |
Final SOC |
Discharge Current or C rate |
Final pack Temperature (K) |
Stop Time (Sec) |
|
|
1 |
50 |
323.15 |
0.5 |
0.402777 |
4.2A or 1C |
323.15239 |
350 |
|
2 |
0.5 |
0.30555 |
8.4A or 2C |
323.1594 |
350 |
||
|
3 |
0.5 |
0.208333 |
12.6A or 3C |
323.170657 |
350 |
||
|
4 |
0.5 |
0.013889 |
21A or 5C |
323.214 |
350 |
||
|
5 |
25 |
298.15 |
0.5 |
0.4004 |
4.2A or 1C |
298.1564736 |
350 |
|
6 |
0.5 |
0.300805 |
8.4A or 2C |
298.176482 |
350 |
||
|
7 |
0.5 |
0.20121 |
12.6A or 3C |
298.2116806 |
350 |
||
|
8 |
0.5 |
0.020319 |
21A or 5C |
298.4784123 |
350 |
||
|
9 |
0 |
273.15 |
0.5 |
0.35909 |
4.2A or 1C |
273.167681 |
350 |
|
10 |
0.5 |
0.218129 |
8.4A or 2C |
273.2225063 |
350 |
||
|
11 |
0.5 |
0.077379 |
12.6A or 3C |
273.3118 |
350 |
||
|
12 |
0.5 |
0 |
21A or 5C |
273.4486 |
248 |
||
Charge Profile:
|
Simulation Runs |
Ambient Temperature (Initial) |
Charge Profile |
|||||
|
In Celcius © |
In Kelvin (K) |
Initial SOC |
Final SOC |
Charge Current or C rate |
Final pack Temperature (K) |
Stop Time (Sec) |
|
|
1 |
50 |
323.15 |
0.5 |
0.59722 |
4.2A or 1C |
323.1526 |
350 |
|
2 |
0.5 |
0.69444 |
8.4A or 2C |
323.1614 |
350 |
||
|
3 |
0.5 |
0.79167 |
12.6A or 3C |
323.18258 |
350 |
||
|
4 |
0.5 |
0.98611 |
21A or 5C |
323.237254 |
350 |
||
|
5 |
25 |
298.15 |
0.5 |
0.5995 |
4.2A or 1C |
298.156123 |
350 |
|
6 |
0.5 |
0.69917 |
8.4A or 2C |
298.1736141 |
350 |
||
|
7 |
0.5 |
0.79874 |
12.6A or 3C |
298.199 |
350 |
||
|
8 |
0.5 |
0.99783 |
21A or 5C |
298.293724 |
350 |
||
|
9 |
0 |
273.15 |
0.5 |
0.64063 |
4.2A or 1C |
273.1664 |
350 |
|
10 |
0.5 |
0.7808 |
8.4A or 2C |
273.211589 |
350 |
||
|
11 |
0.5 |
0.92043 |
12.6A or 3C |
273.2803143 |
350 |
||
|
12 |
0.5 |
0.99874 |
21A or 5C |
273.40027 |
250 |
||
Observations from all the simulations:
- As the temperature increases, the battery pack performance degrades. This is quite evident from the SOC variations after discharge/charge duration.
- This is quite evident from the results obtained in the above tables highlighted in YELLOW. The simulation couldn’t be run for 350 sec (stopped at 248-250 sec) like other scenarios and SOC reached the lower or higher limits faster which detrimentally affects the battery performance.
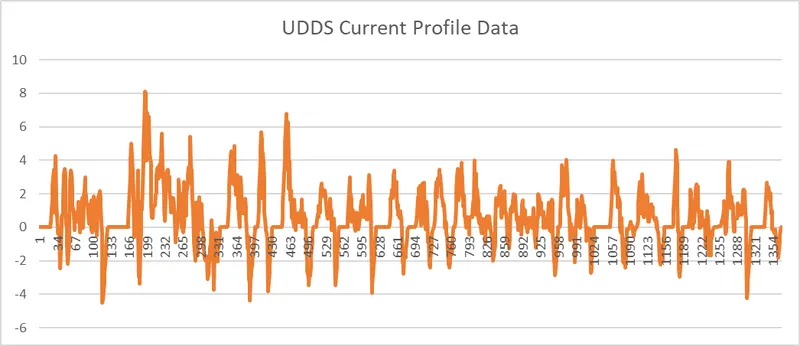
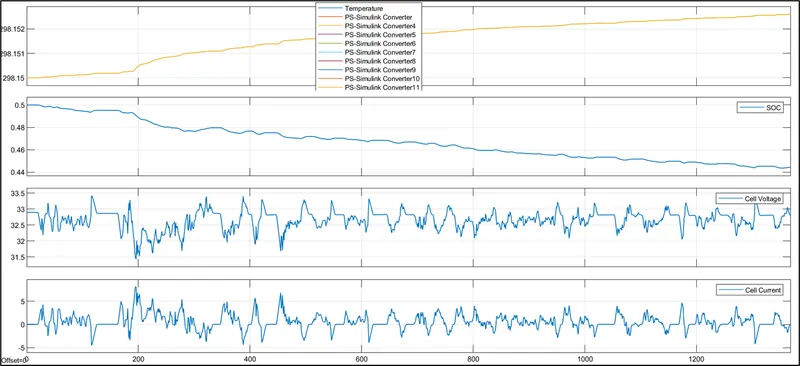
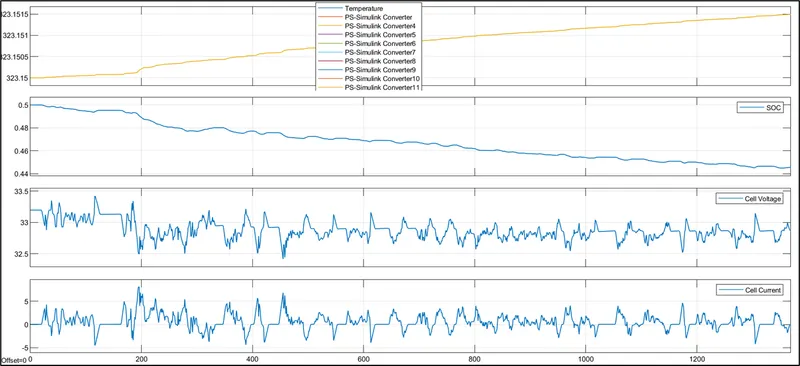
- The battery pack performance was again analyzed using the UDDS current profile data as per below. It was observed that again at very temperatures, the pack performance is degraded. The observations are again compiled in a table and summarized below.
AT 25 degrees:
At 50 degrees:
Output Results with UDDS Data:
|
Simulation Runs |
Ambient Temperature (Initial) |
UDDS Discharge Profile |
|||||
|
In Celcius © |
In Kelvin (K) |
Initial SOC |
Final SOC |
Final pack Temperature (K) |
Initial pack Voltage (V) |
Final pack Voltage (V) |
|
|
1 |
0 |
273.15 |
0.5 |
0.42 |
273.157 |
32.640 |
32.57 |
|
2 |
25 |
298.15 |
0.5 |
0.44 |
298.15 |
32.895 |
32.8 |
|
3 |
50 |
323.15 |
0.5 |
0.44557 |
323.15 |
33.197 |
32.869 |