Project 2 - Supply and Demand Gap Analysis
UBER Supply and Demand Gap Analysis
Aim –
The aim of this is project is to identify and analyze the gap in supply and demand of uber cabs having two pickup points namely airport and city from the dataset downloaded from kaggle.
Introduction –
Supply and demand gap analysis is done by every company to know the reasons for the company’s success or failure and to be prepared based on the customer trend and improve the company’s performance.
Uber is a cab service which provides its services through mobile application. The current dataset taken has the details for five days in the month of July of 2016. The main objective of this project is to analyze the dataset and give recommendations based on our findings.
Methodology –
Step 1: Data Exploration –
In order to take any necessary steps we must understand the data we have, which is data exploration and based on our understanding we can go ahead with the appropriate data cleaning steps required.
Step 2: Data cleaning –
I have used Power BI tool to clean and transform the data as per my understanding and I have replaced values, grouped the data and created a new table where it seemed fit.
Step 3: Data Visualization –
I have used Power BI tool to visualize the data available to gain meaningful insights and better understand the dataset. I have used different visualizations like bar graphs, line graphs which are available in the tool.
Analysis –
The dataset contains the following columns
- Request Id- Gives a unique id when the customer makes a request for the cab.
- Pickup Point – gives the point of pickup of the customer (airport or city).
- Status – gives the status of the request whether it was completed or not (trip completed, no cars available, cancelled).
- Driver id – gives the id of the driver who got the request if cars were available.
- Request timestamp –gives the date and time of the request.
- Drop timestamp – gives the date and time of the drop off.
The dataset contains null values in the driver id when there are no cars available and contains null values in the drop timestamp when the trip was cancelled or when no cars are available.
I have split the columns into date and time for ease of analysis. Further I created a conditional column called hour of the day from the timestamp so as to know the demand of the cabs based on the hours of the day.
Also created a new column considering only successful trips as supply and considering the no cars available and cancelled trips as gap.
I have created a new column called Time of Day based on Hour of Day.
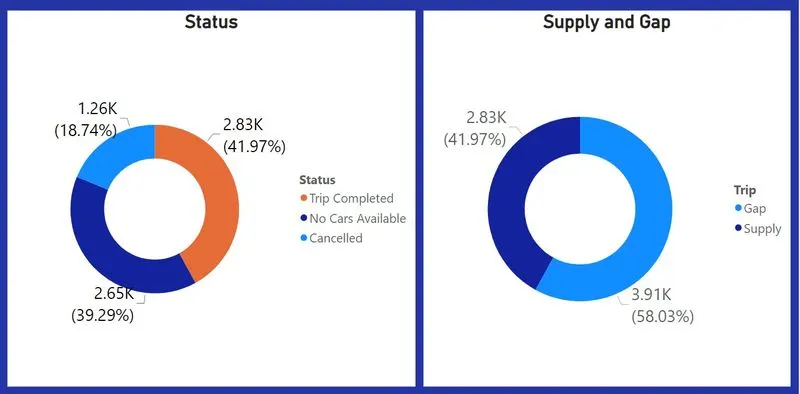
The dataset contains details about 6,745 requests, out of which only 2.83k trips were completed which 41.97% rides were successful and 58.03% of rides were unsuccessful.
Out of the unsuccessful rides 1.26k were due to cancellation of the rides and 2.65k rides were due to unavailability of the cars.
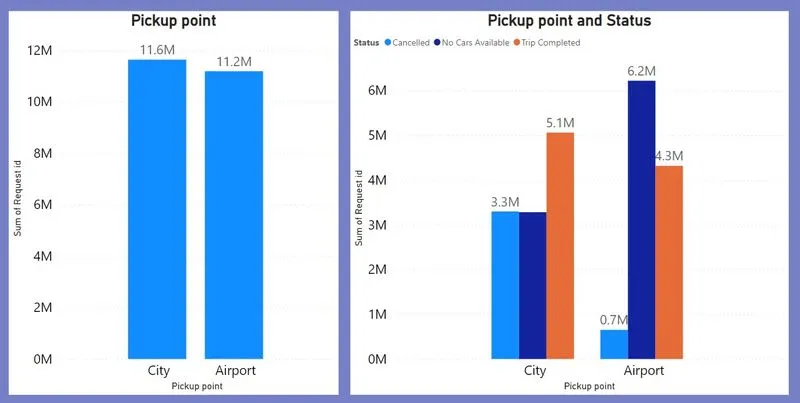
From Above Picture –
- The pickup points Airport and City are almost equal times present in the dataset.
- There are more No cars available from Airport to City. There are more cars Cancelled from City to Airport.
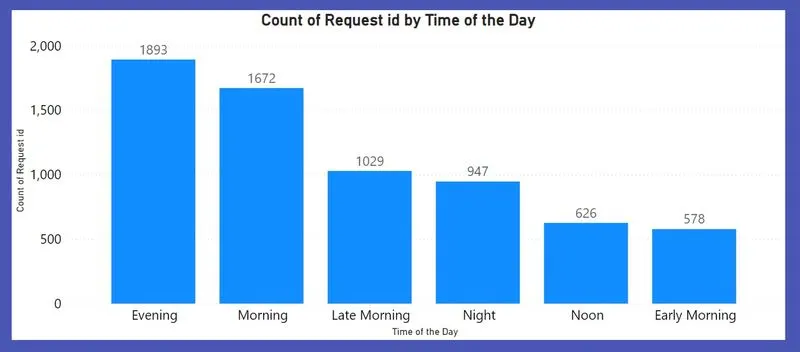
From Above Picture –
Most request are in evening and after morning, there is low count of request in noon and early morning.
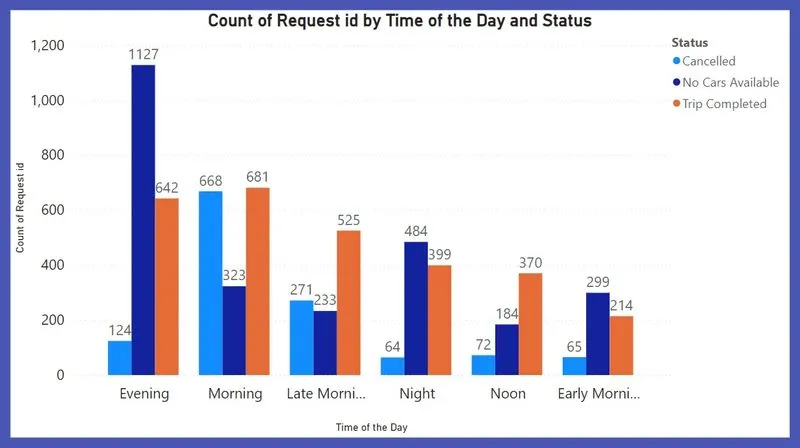
From Above Picture –
- Most No Cars Available are in the Evening.
- Most Cancelled trips are in the Morning.
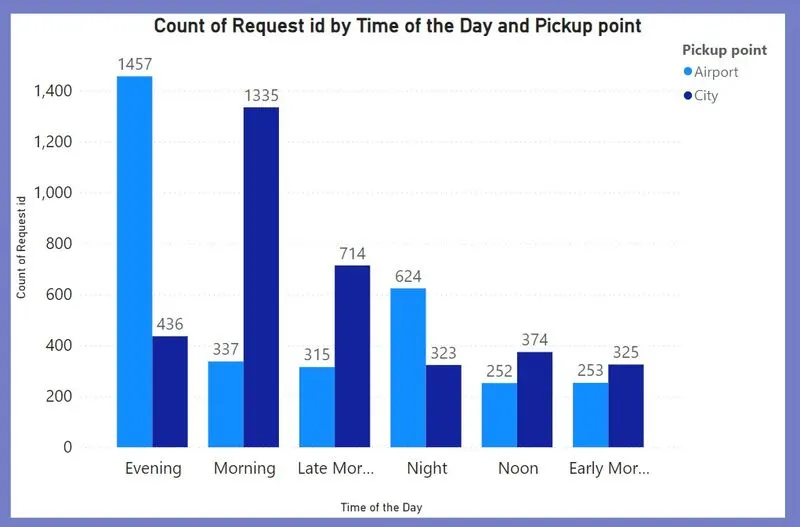
From Above Picture –
- Most request are from airport in evening and least in early morning.
- Most request are from city in morning and least in early morning.
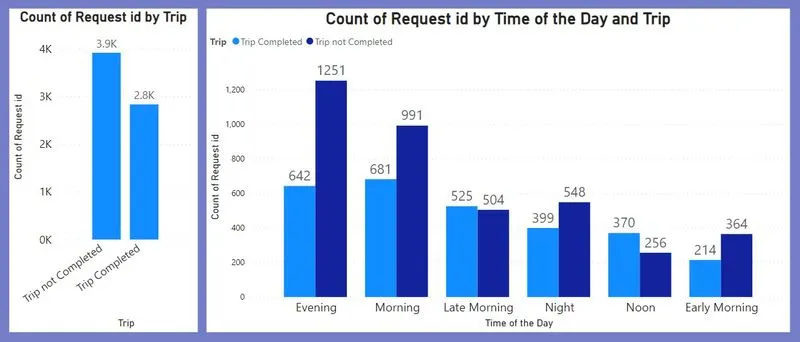
From Above Picture –
- More Trip not completed than Trip Completed.
- More Trip not completed in evening.
- More Trip completed in morning.
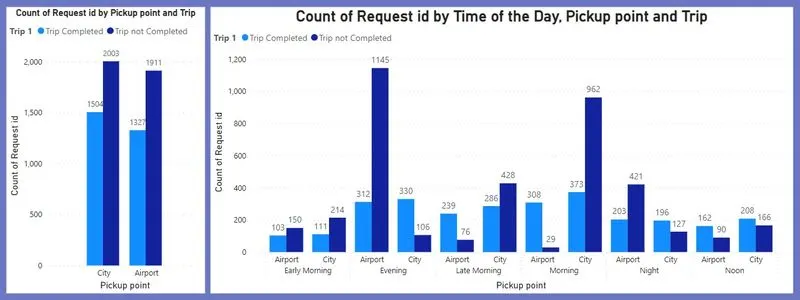
From Above Picture –
- More Trip not completed from City.
- More Trip not completed from City in Morning.
- More Trip completed from Airport in Evening.
Insights –
- In the Peak Morning Slot where the demand for City to Airport trips are high, there are maximum number of trip cancellations leading to great Gap in the Demand & Supply.
- A high gap of 71.85% can be seen during the morning peak hours.
- In the Peak Evening Slot where the demand for Airport to City trips are high, there are maximum number of “No Cars Available” leading to great Gap in the Demand & Supply.
- A high gap of 79.28% can be seen during the evening peak hours.
Recommendations –
- The increase in number of vehicles will be one solution.
- Giving out rewards based on the number of trips during the peak hours without cancelling them.
Conclusion –
Based on the data analysis performed, following recommendation can be used by Uber to bridge the gap between supply and demand –
- For bridging the demand supply gap from airport to city, making a permanent stand in the airport itself where the cabs will be available at all times and the incomplete requests can come down significantly.
- Uber can provide some incentives to the drivers who complete the trip from city to airport in the morning part. This might result the driver to not cancel the request from city to airport trips.
- Last but sure solution to bring down the gap is to increase the numbers of cab in its fleet.
Power Point link -