Project 2 - Supply and Demand Gap Analysis
SKILL-LYNC POWERBI PROJECT-2 REPORT

UBER CABS- SUPPLY AND DEMAND GAP ANALYSIS
1. INTRODUCTION:
The objective of this analysis is to identify and analyze the supply-demand gap in Uber trips between the City and the Airport. The analysis aims to understand the variations in supply and demand across different hours of the day. By doing so, we can uncover any issues or challenges in meeting the demand and find potential solutions to address the problem.
2. PROBLEM STATEMENT:
Uber, a transportation network and taxi company operating through a mobile application, encounters significant problems with driver cancellations and car unavailability in its airport rides within a particular city. These challenges have a detrimental impact on Uber's business performance, resulting in a loss of revenue and a widening gap between supply and demand.
3. METHODOLOGY:
a) Data Collection and Data Cleaning:
To conduct a comprehensive analysis of the Uber supply and demand gap, it is crucial to start with an initial examination of the given dataset. This involves understanding the dataset's structure, identifying the data types of various columns, and gaining a basic understanding of the dataset's content. This initial analysis provides a foundation for further investigation.
There are six attributes associated with each request made by a customer from 11th July 2016 to 15th July 2016:
- Request id: A unique identifier of the request
- Time of request: The date and time at which the customer made the trip request
- Drop-off time: The drop-off date and time, in case the trip was completed
- Pick-up point: The point from which the request was made
- Driver id: The unique identification number of the driver
- Status of the request: The final status of the trip, which can be either completed, cancelled by the driver or no cars available
Data cleaning is an essential step in the Uber supply and demand gap analysis. During this process, it is important to identify and address visible data quality issues. This includes checking for blank entries, removing duplicate data, and converting certain columns to the required data types. By rectifying these issues, the dataset becomes more dependable and suitable for further analysis.
b) Visualizations by addressing the pressing problems:
Overall Customer Service Requests Status-
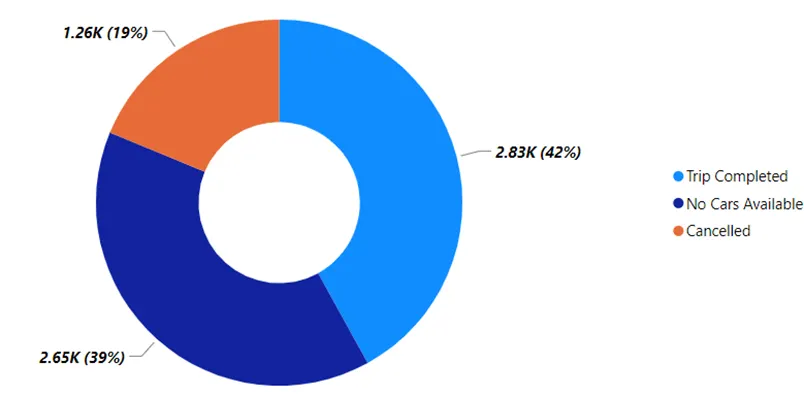
It is observed that a significant portion of customer requests, approximately 58%, were denied. Further analysis reveals that out of these denials, 39.3% were due to the unavailability of cars at the time of the customer's request, while 18.7% were a result of driver cancellations. A graph depicting these findings provides a clear visualization of the customer service rate and the individual contributions of each factor to the overall denial of customer requests.
Let’s Identify the Most Problematic Type of Request Pick up points (Airport or City)-
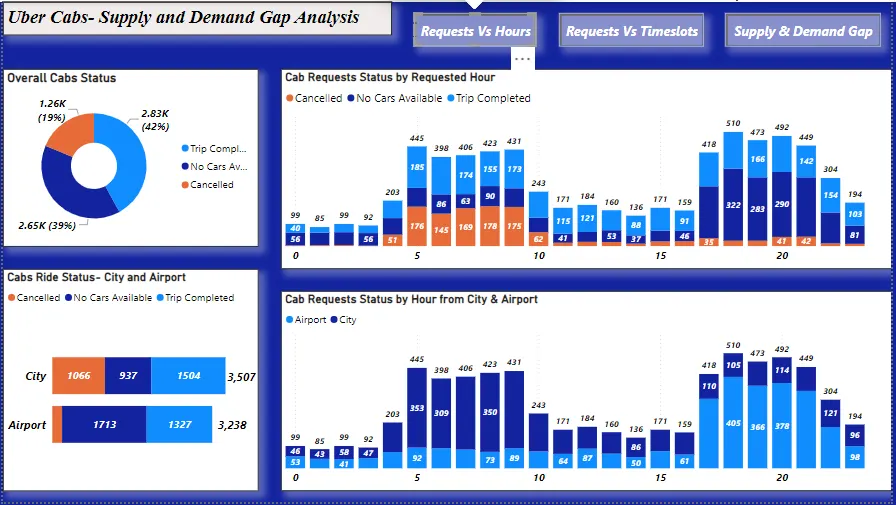
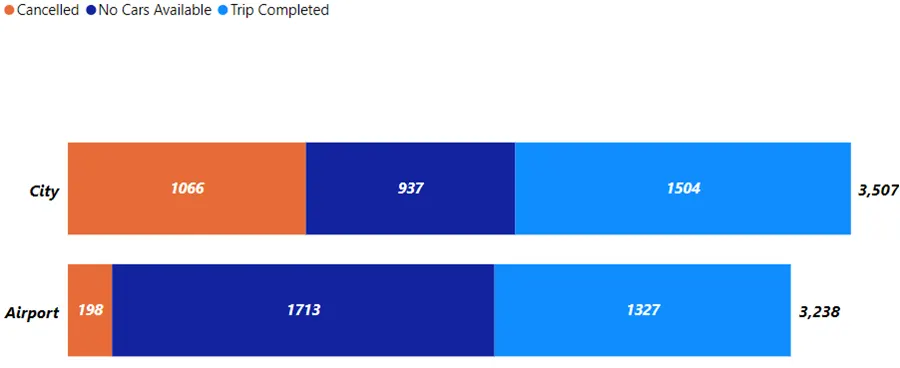
The graph illustrates that a higher number of customer requests are denied for those with a pick-up location in the city compared to the airport. However, when we examine the percentage of total customer requests serviced based on pick-up location, we observe that service requests made from the city are 1.9% higher than those made from the airport. This indicates that a higher percentage of customers booking an Uber taxi from the airport experience service denials. Consequently, customer requests with a pick-up location specified as the airport are more problematic and have a higher likelihood of being denied service.
Let's Aggregate the requests on an Hourly basis-
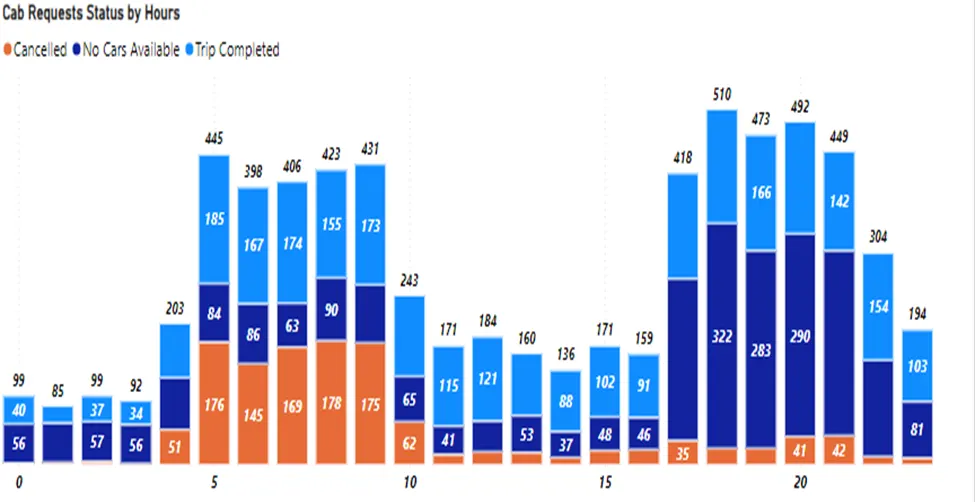
This graph reveals interesting patterns. It is evident that the time slots between 5.00 to 9.00 and 17.00 to 21.00 experience higher demand compared to other time slots. Additionally, within the 5.00 to 9.00 time slot, there is a higher number of cancelled cabs, while the 17.00 to 21.00 time slot faces a higher number of instances where no cars are available.
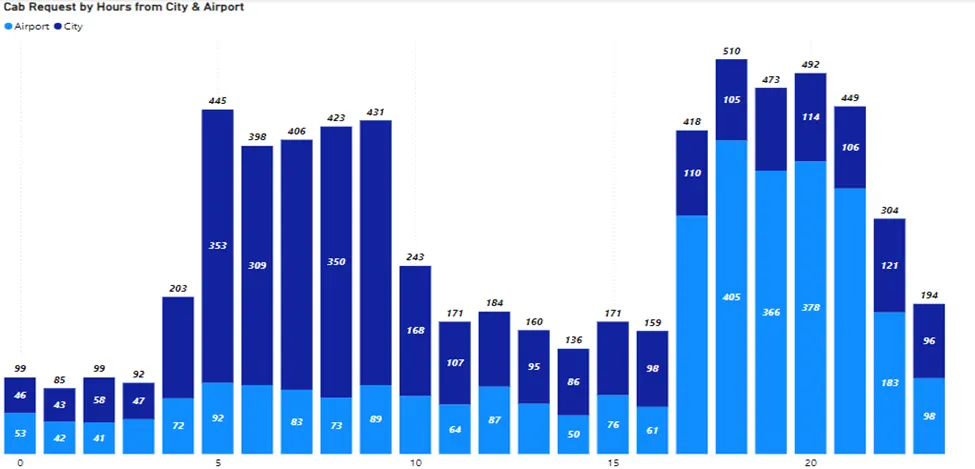 Further examination of the plot indicates that between 5.00 to 9.00, there is a higher number of service requests in the city. Conversely, between 17.00 to 21.00, there are more service requests originating from the airport. These findings highlight the specific time slots during which Uber encounters different challenges, such as cancellations and unavailability of cars, based on the pick-up location and time of day.
Identifying the Most Problematic Timeslot with addressing the key problems-
During the analysis, a focus was placed on specific time slots based on the number of trips. The time slots between 5.00 to 9.00 and 17.00 to 21.00 were identified as having high demand, making them of particular interest.
To facilitate further analysis, various time slots were created, such as:
- Early Morning (0.00 to 5.00)
- Peak Morning (5.00 to 10.00)
- Normal Day Time (10.00 to 17.00)
- Peak Evening (17.00 to 22.00)
- Late Night (22.00 to 0.00)
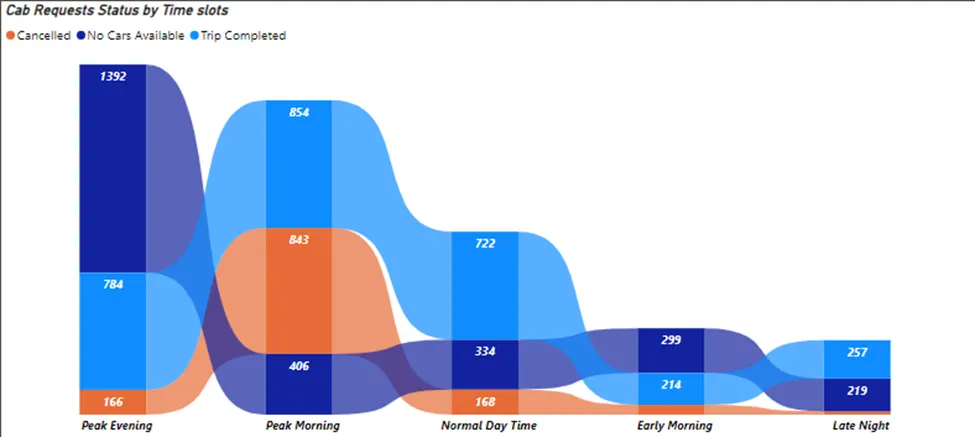
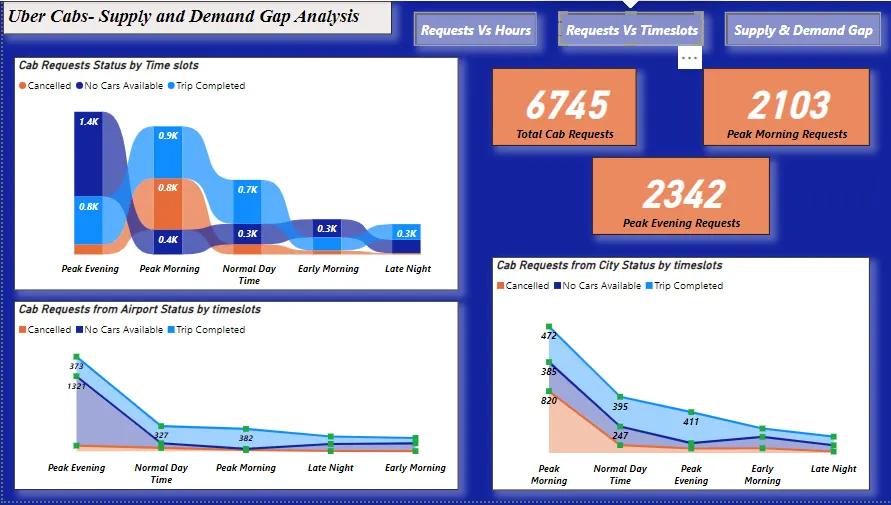
The above graph reveals that the ‘Peak Evening ‘and 'Peak Morning' time slots experience the highest gap between service and demand. This indicates that there is a significant issue in meeting customer requests during these periods.
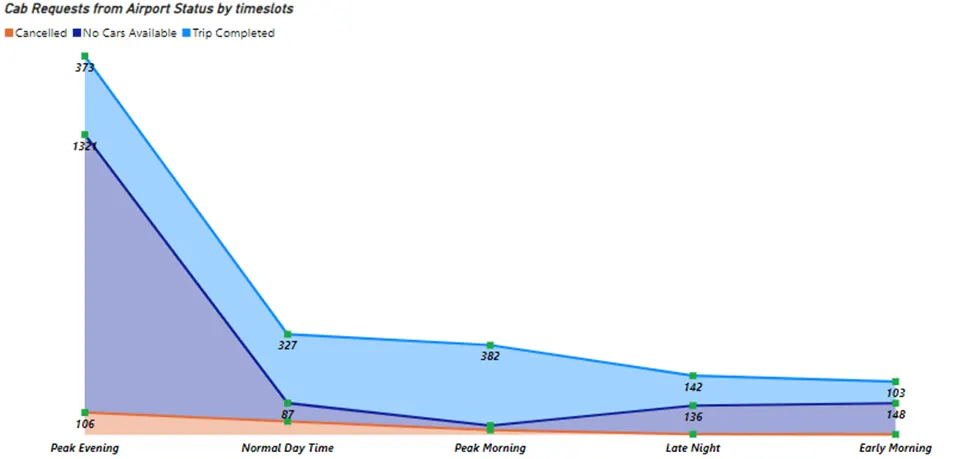
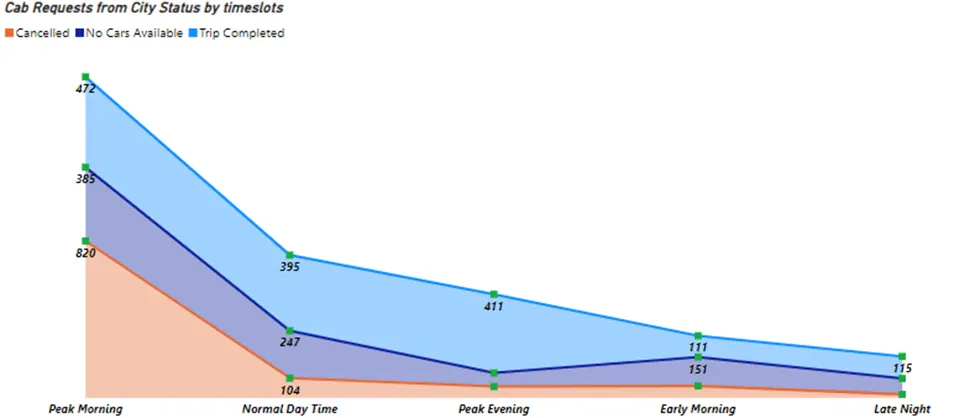
From these Visuals, it was confirmed that the Peak Morning time slot experienced a higher number of cancelled cabs from city, while the Peak Evening time slot had more instances of "No Cars Available" from airport. This information led to a specific analysis of the Peak Morning time slot and cancellations in the city. The subsequent visuals made it evident that during the Peak Morning time slot, the city had the highest number of trip cancellations compared to the airport. And No cars available problems from Airport only during Peak Evening.
Two Problems addressed:
Problem1: Firstly, during the Peak Morning Time slot, there is a high number of customer requests for taxis from the city to the airport being cancelled by the drivers. This points to a potential problem that needs to be addressed.
Problem2: Secondly, during the Peak Evening Time slot, there is a high number of customer requests being denied due to a lack of available cars, particularly for customers booking a taxi from the airport towards the city. This highlights another potential problem that requires attention.
Let’s Analyze the Demand, Supply and Gap in the City during Morning Peak Hour-
High number of customer requests are cancelled during Morning Peak Hour :
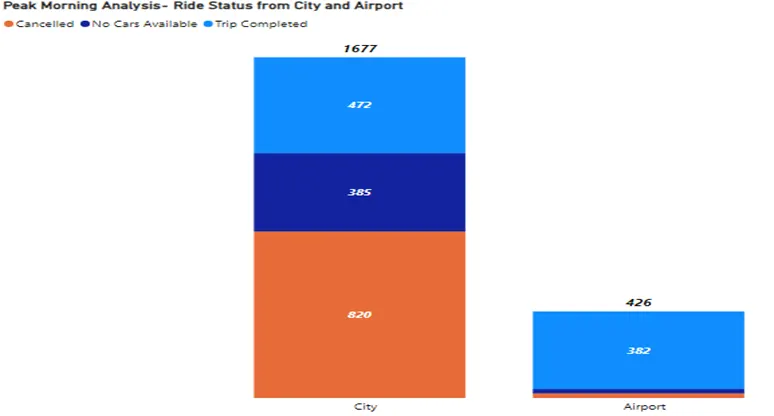
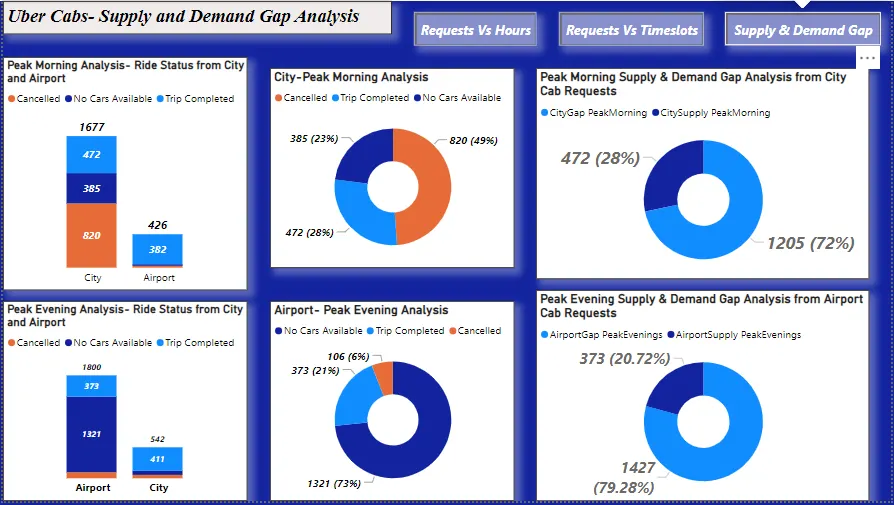
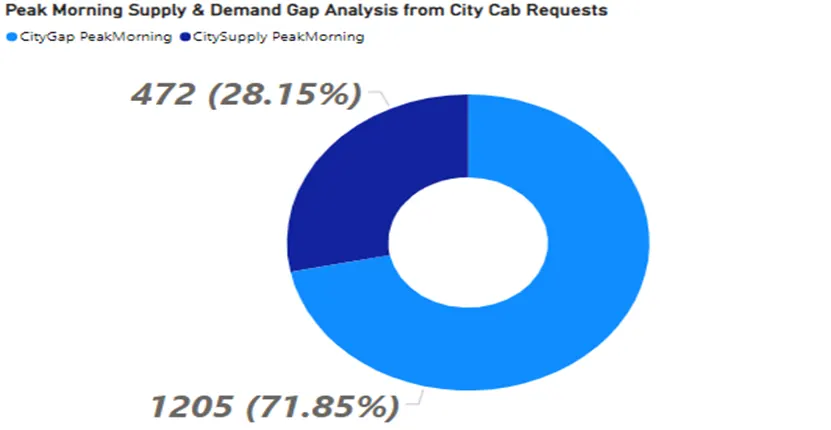
A separate analysis was conducted to assess the demand, supply, and gap within the city. It was assumed that demand equated to the total number of requests, supply represented the total number of completed trips, and the gap referred to the difference between demand and supply. The analysis revealed a significant gap of 1205 trips, indicating a substantial mismatch between demand and supply in the city.
· We assume that:
▪ Demand = Total No. of Requests
▪ Supply = Total Number of Completed Trips
▪ Gap = Demand — Supply
▪ “Cancelled” and “No Cars Available” are Gaps
▪ “Trip Completed” is Supply.
We observe:
▪ Demand or Total Requests = 1678
▪ Supply or Trips Completed = 472
▪ Gap = 1205
ClClearly, we see a big Gap in supply from the below graph:
Analysis- Peak Evening Slot & “No Cars Available” in Airport
Upon analysing the Peak Evening slot of Uber's supply and demand gap, a significant observation emerges regarding the availability of cars at the Airport. The data reveals that during this time slot, the Airport experiences the highest number of instances where "No Cars Available" are reported. This finding is further supported by a bar Chart, which confirms the prevalence of the issue at the Airport.
No Cars Available at Pickup Point Airport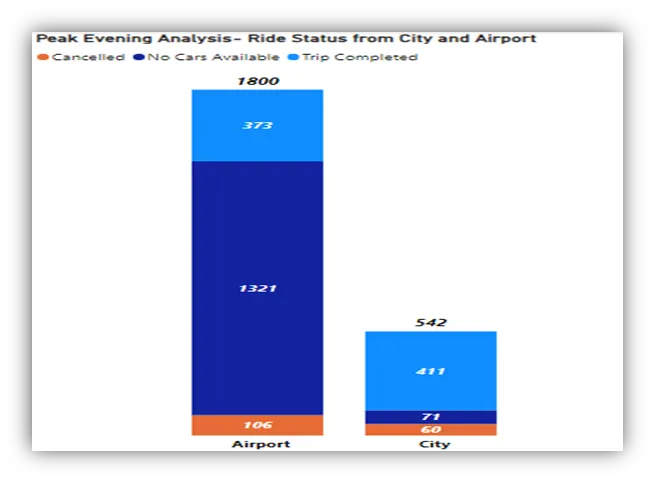 In our analysis, we define the following terms:
- Demand: Total number of customer requests
- Supply: Total number of completed trips
- Gap: Difference between demand and supply
- "Cancelled" and "No Cars Available" represent the gaps in service
- "Trip Completed" represents the supply of service
Based on our observations:
- Total Requests: 1800
- Trips Completed: 373
- Gap: 1427
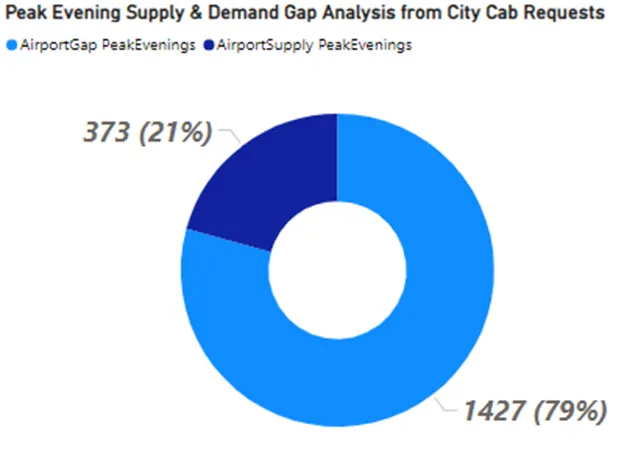
It is evident from the pie chart that there is a substantial supply gap, indicating a significant disparity between demand and the availability of cars during the Peak Evening slot.
The Reason for the Issue of the Supply-Demand Gap-
Peak Morning Slot Problem:
We have identified a significant supply-demand gap during the peak morning slot, specifically for trips from the city to the airport. The primary issue contributing to this gap is the high rate of trip cancellations, resulting in a limited supply of available rides.
Insights:
- High Demand and Low Supply: During the peak morning slot, there is a high demand for rides from the city to the airport. However, the number of completed trips is considerably lower than the total number of requests. Out of 1678 total requests, only 472 trips were completed, leaving a gap of 1205.
- Longer Trip Duration and Idle Time: Trips from the city to the airport typically take longer, especially during the morning hours. Once the driver reaches the airport, they often experience longer idle times due to flight patterns. In the mornings, many flights depart from the city, resulting in fewer incoming flights. Additionally, it is not economically viable for drivers to return empty from the airport to the city.
- Cancellation Rate: The combination of longer trip durations, extended idle times, and the lack of return trips from the airport contributes to a high cancellation rate for trips from the city to the airport. This issue can lead to frustration for passengers who rely on timely transportation to catch their flights.
Peak Evening Slot Problem:
We have observed a significant gap between the demand and supply of Uber rides during the peak evening slot, specifically for trips from the airport to the city. This gap is primarily caused by the unavailability of cars, resulting in a large number of "No Cars Available" notifications for passengers.
Insights:
- High Demand and Low Supply: During the peak evening slot, there is a high demand for rides from the airport to the city. However, the number of trips completed is significantly lower than the total number of requests. Out of 1800 total requests, only 373 trips were completed, leaving a gap of 1427.
- Flight Arrivals and Driver Availability: The high demand for rides during the peak evening slot is mainly due to the arrival of numerous flights, including international ones, at the airport. This influx of passengers creates a surge in demand for Uber rides. However, during this time, many Uber driver-partners start retiring for the day as the night progresses, leading to a shortage of available cars.
- "No Cars Available" Issue: The combination of high demand and limited driver availability results in a significant number of "No Cars Available" notifications for passengers looking for rides from the airport to the city. This issue can cause inconvenience and frustration for passengers who are unable to secure a ride.
4. RECOMMENDATIONS- to Resolve the Supply-Demand Gap:
- Enhanced Monetary Incentives: Uber should consider offering higher monetary incentives for drivers who take peak morning trips from the city to the airport. Increasing the earnings potential during this high-demand period can motivate drivers to accept and complete these trips, reducing the supply-demand gap.
- Targeted Rewards Program: Implementing a rewards program that sets targets for drivers to take up city-to-airport or airport-to-city trips can be effective. Drivers who meet these targets can be rewarded through lucky draw schemes or provided with gift vouchers. This approach encourages drivers to actively participate in fulfilling the demand during peak hours.
- Incentivize Airport-to-City Trips at Night: To increase the availability of cars at the airport during the evening hours, Uber can introduce incentives specifically for airport-to-city trips. By offering additional benefits or earnings for these trips, more drivers from the city will be encouraged to reach the airport, reducing the "no cars available" issue.
- Discourage Politely Early Retirements: Uber should communicate with its drivers and discourage them from retiring early in the evening. By emphasizing the potential earning opportunities during the peak evening slot, drivers can be encouraged to continue providing services during this high-demand period.
- Driver Orientation Classes: Conducting orientation classes for drivers and sharing insights obtained from the analysis of the supply-demand gap can be beneficial. By educating drivers about the demand patterns at different times of the day, they can make informed decisions about where to position themselves to maximize their earnings and contribute to filling the supply-demand gap.
Implementing these recommendations can help Uber address the supply-demand gap during peak morning and evening slots, providing a better experience for both drivers and passengers.
5. CONCLUSION:
The analysis of the supply and demand gap for Uber cabs during peak morning and evening slots reveals several key insights. The observations indicate a significant gap between the demand for trips and the availability of cars, leading to issues such as trip cancellations and "no cars available" notifications from the City and airport.
By implementing these recommendations, Uber can effectively bridge the supply-demand gap during peak morning and evening slots, leading to improved customer satisfaction and a more efficient utilization of driver resources.
Dashboard: