Project 2 - Supply and Demand Gap Analysis
Supply and Demand Gap Analysis- Uber Ride
Aim:
To identify the Supply and Demand Gap Analysis of Uber Ride from City to Airport and Vice versa.
Introduction:
Uber provides Mobility as a service allowing users to book a car and driver to transport them in a way similar to a taxi, food delivery, package Delivery, couriers, and freight Transport.
In this Analysis, we are focusing on Supply and demand gap Analysis of Uber Ride which is offered from City to Airport and Vice-versa. What is the possible cause for the demand gap and factors affecting the gap.
Problem Statement:
o Identify the supply and demand gap.
o Identify the reason for the demand gap.
o The areas which needs to be focused to maximize the customer satisfaction.
Methodology:
Getting the Dataset:
The dataset has been downloaded from the source: Kaggle
Link: https://www.kaggle.com/code/goyalshalini93/uber-supply-demand-gap-analysis-eda
It has a total of 6745 rows and 6 columns.
Initial Analysis:
Looking into the available dataset and understanding the structure of dataset and basic ideas.
Data Cleaning:
- The dataset has been loaded and it contains 2650 values as “NA” for the Driver id for which the status is “No Cars Available”.
- Transformed the Request Time stamp into Date and Time column.
- New column has been introduced for Classifying the Time slots based on booking time as follows:
02:00 AM to 05:00 AM — Early Morning
05:00 AM to 10:00 AM — Peak Morning
10:00 AM to 05:00 PM — Normal Day Time
05:00 PM to 10:00 PM — Peak Evening
10:00 PM to 02:00 AM — Late Night
Tool:
Power BI is used as a visualization tool for analyzing and visualizing the Supply and Demand Gap Analysis of Uber Ride.
Analysis:
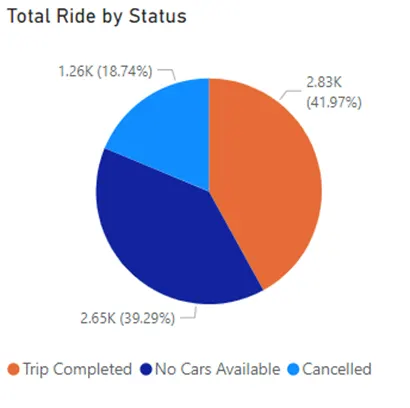
The above Pie chart shows that there are more number of cancellation happening.
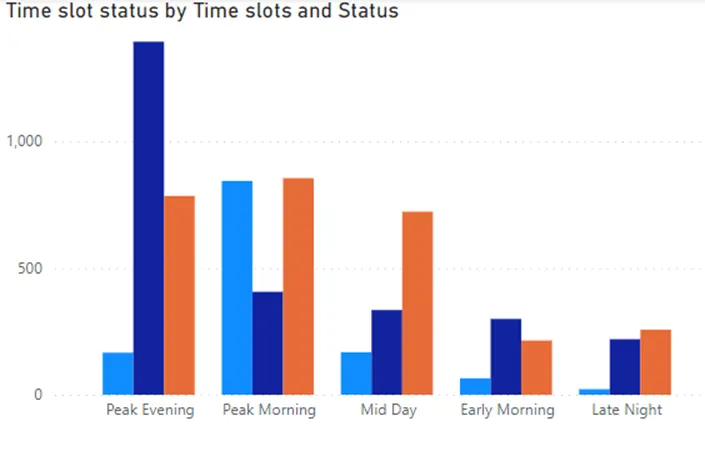
This clearly shows Uber needs to expand its services during the Peak evening around 1392 requests were ignored due to the non-availability of cars.
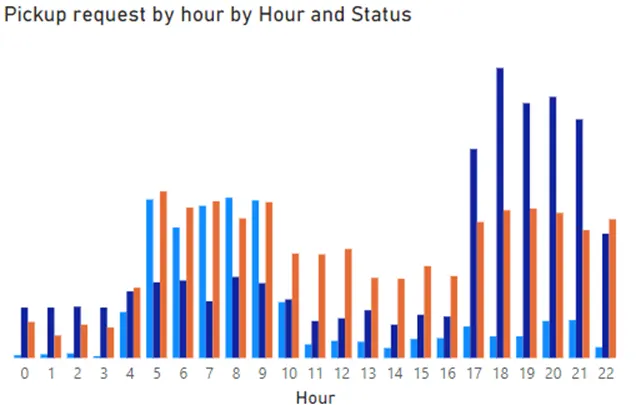
It clearly shows that during the 5:00 AM to 10:00 AM and 5:00 PM to 10:00 PM has highest request for the cab.
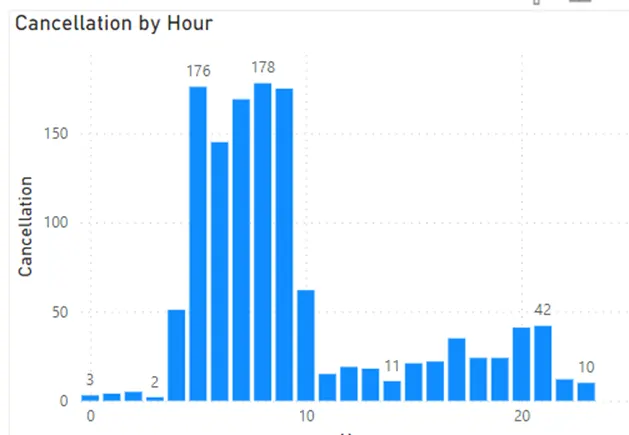
Maximum number of cancellation are raised during the peak morning from 5:00 AM to 10:00 AM.
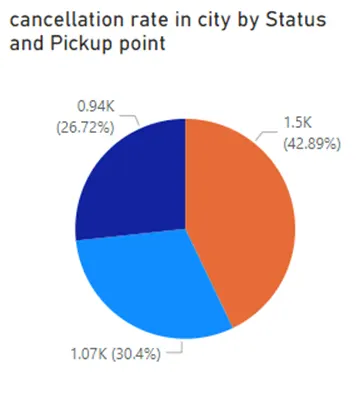
The above chart shows that most of the cancellation has been happening in city.
Insights:
o Over all 18% of cab requests are cancelled
o During Peak hours(Evening & Morning) maximum number of “No cars available” has been recorded.
o Airport holds more than 50% of request are declined with No cars availability
Reccomendation:
Increase its taxi service in airport and during Peak hours.
Identifying the reason for cancelling the cab request.
Conclusion:
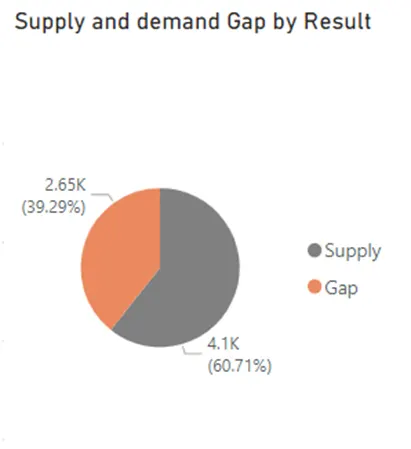
Through the Analysis it has identified that 39% of supply Gap is visible. Uber has to focus on the supply gap due to lack of taxi service.