Project 2 - Supply and Demand Gap Analysis
Retail Supply and Demand Gap Analysis
Aim:
The aim of this Retail Supply and Demand Gap Analysis is to pinpoint discrepancies between product supply and customer demand, enabling strategic adjustments to optimize inventory management and enhance customer satisfaction.
Introduction:
In today's dynamic retail landscape, achieving a delicate balance between supply and customer demand is essential for operational efficiency and customer satisfaction. This introduction sets the stage for our Retail Supply and Demand Gap Analysis, which delves into the intricate interplay between our product supply and the evolving preferences of our valued customers. By closely examining these dynamics, we aim to uncover insights that will empower us to bridge any gaps, streamline inventory management, and ensure that we meet customer expectations with precision.
Problem statement:
- The Retail Supply and Demand Gap Analysis addresses the challenge of effectively aligning product supply with fluctuating customer demand in our retail operations.
- This discrepancy has led to instances of stockouts and excess inventory, impacting both customer satisfaction and operational efficiency.
- Our objective is to identify the underlying causes of this supply-demand gap and devise actionable strategies to optimize inventory management, enhance resource allocation, and ultimately enhance our ability to meet customer needs efficiently.
Methodology:
The methodology for the Retail Supply and Demand Gap Analysis involves a multi-stage approach:
- Data Collection: Gather historical sales data, inventory records, and customer purchasing patterns. This comprehensive dataset forms the foundation of the analysis.
- Demand Analysis: Utilize statistical tools to analyze customer behavior, identify demand trends, and assess seasonality or specific market influences affecting product demand.
- Supply Analysis: Evaluate inventory levels, production capacity, and order fulfillment data to understand the current supply situation.
- Descriptive Analysis: Initial descriptive statistics will provide an overview of global and regional vaccination trends, highlighting disparities in coverage and identifying potential patterns.
Analysis (Data sheets pertaining to it):
- Total Sales by Year
- Total Sales by Store type
- Quantity by Gender
- Total Sales by product Category and Product Sub category
- Quantity by Age and Gender
Insights:
<!-- [if !supportLists]-->· <!--[endif]-->Total Sales by Year
<!--[endif]-->
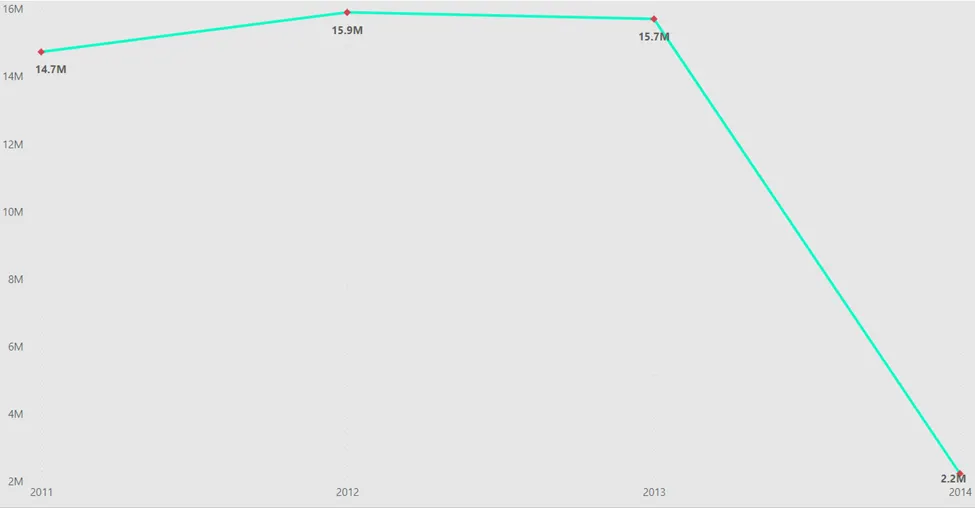
<!-- [if !supportLists]--> i. <!--[endif]-->The chart displays a clear sales performance across a four-year span. In 2011, sales stood at a substantial 14.7 million units, demonstrating a robust market presence.
<!-- [if !supportLists]--> ii. <!--[endif]-->The subsequent year, 2012, witnessed a further increase, with sales reaching 15.9 million units, indicating a sustained growth trajectory.
<!-- [if !supportLists]--> iii. <!--[endif]-->Despite a marginal dip in 2013, where sales slightly decreased to 15.7 million units, the product maintained a strong market presence.
<!-- [if !supportLists]--> iv. <!--[endif]-->However, a significant shift occurred in 2014, where sales drastically declined to 2.2 million units, marking an abrupt and noteworthy change in the product's sales trajectory.
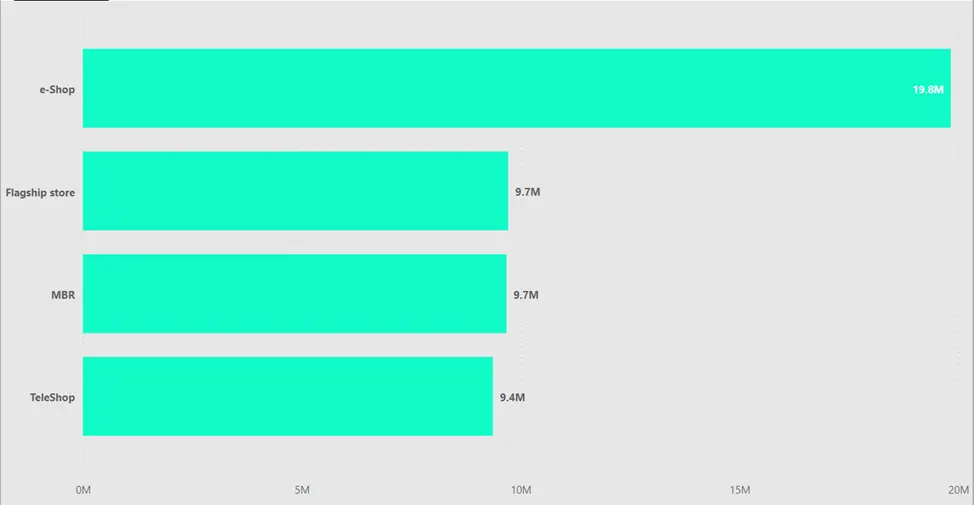
<!-- [if !supportLists]-->· <!--[endif]-->Total Sales by Store type
<!--[endif]-->
<!-- [if !supportLists]--> i. <!--[endif]-->The chart provides a comprehensive overview of sales distribution across various platforms. Notably, the E-shop emerged as the leading contributor with sales amounting to an impressive 19.8 million units.
<!-- [if !supportLists]--> ii. <!--[endif]-->The Flagship store and MBR (Multi-Brand Retailer) followed closely, both achieving sales of 9.7 million units. Additionally, the Teleshop platform demonstrated a strong performance, with sales totaling 9.4 million units.
<!-- [if !supportLists]--> iii. <!--[endif]-->This data highlights the diverse avenues through which sales were accomplished, showcasing the E-shop's dominant presence and the balanced contributions of other platforms to the overall sales success.
<!-- [if !supportLists]-->· <!--[endif]-->Quantity by Gender