Project 2 - Supply and Demand Gap Analysis
SUPPLY AND DEMAND GAP ANALYSIS HUMAN RESOURCES
Aim:
The main aim of the project is to analyse the employee achievement and their position status in the company and also analyse the period of the employee in the company. Analysing the human resources dashboards we improve the workforce performance and other relevant procedures of the company.
Introduction:
The objective of the project provide the HR analytical dashboard and these HR analysis reports are used to improve the process and ability to handle the business. Then it helps the business or companies to apply the planning approach to growth and development. By using HR analysis reports develop the recruiting process it helps to determine the talent gap in the organization and also used to understand how to improve the workforce productivity by making employee friendly work environment.
Problem Statement:
The Human resource management difficult to make the decision in the process of the hiring and recruitment planning and also in measuring the employee performance, satisfaction. In the time of the promotion for employees hard to find the person who has good at working process.
We can find the pattern of the employees are worked in the particular organization.
Assigning the position based on its performance.
Count the employee special project and performance score.
See the summary of the salary its position.
Methodology:
1.Data Pre-processing & cleaning:
In data pre-processing it is the step to pre-process the data means we have to clean the data with the help of the Power BI in that we use power query editor by clicking transform data in that we remove the null values, duplicate values and fill missing values and we make first row as header an then we check the data type make the data in good manner and arrange the data in specific format.
2.Exploratory Data Analysis & Visualization:
After the cleaning of the complete data, we add the data into power bi by clicking close and apply in the power query editor. Then the interpretation of the data is explored some important information in the data.in this we can replaced the null values into 0. then explore the data using some power bi functions making summarization of the data and did some related operations. In visualization, with the help of the power bi desktop software to make dashboard, inserting the charts and graph and also calculates the headcount by position, gender, department, employee satisfaction, age and we by inserting specific charts for analyse data in HR analytics dataset it makes easy to understand the process of the human resources analysis.
We use some Power BI functionalities like:
- Import Function
- Power Query
- DAX
- Visualization Charts
Analysis:
By looking above, the data visualizations dashboard, charts and graph we find some points.
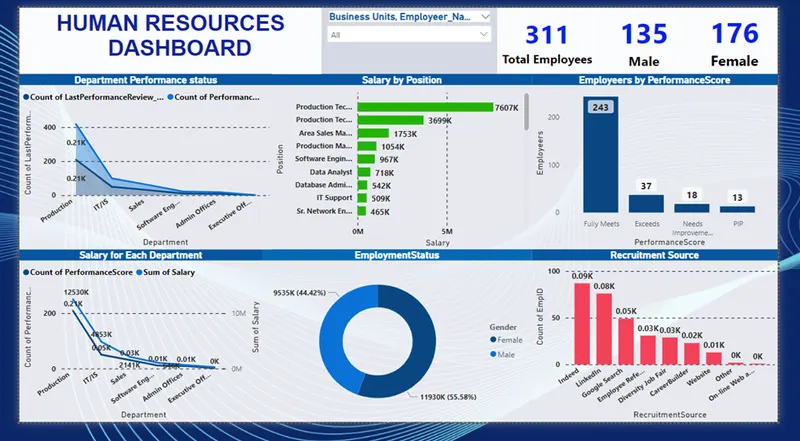
- Human resources dashboard in that list of distinct employees in that we categorize the based on the gender.
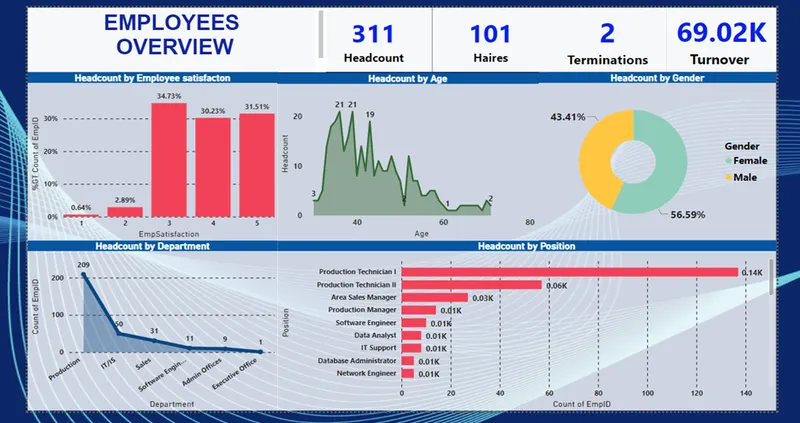
- In the above dashboard we can see headcount by position, department, age range.
- The total 311 employees are working in the organization
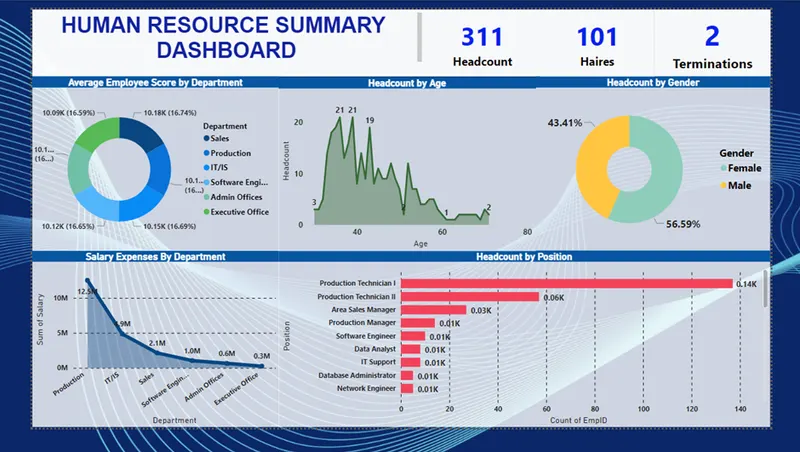
- We count total hairs, termination, turnover of the organization.
- Based on the employee performance the organization gives a particular position.
- We can also analyse the employment status.
- Total 124 members are married and 137 are singles.
Insights:
In conclusion we can take a look at the final report for further analysis.
- In this we use the power bi to create multiple dashboards focused on the individual factors to derive insights and predictions.
- HR dashboard department status, position salary, employee performance score, salary for department. employee status, Recruitment Sources.
- Employee dashboard contains charts headcounts by age, employee satisfaction, gender, department, position.
- HR summary contains hairs and terminations cards and charts like salary expenses by department, average employee score and others same as employee dashboard.
- The Employee overview dashboard that combines a that employee performance.
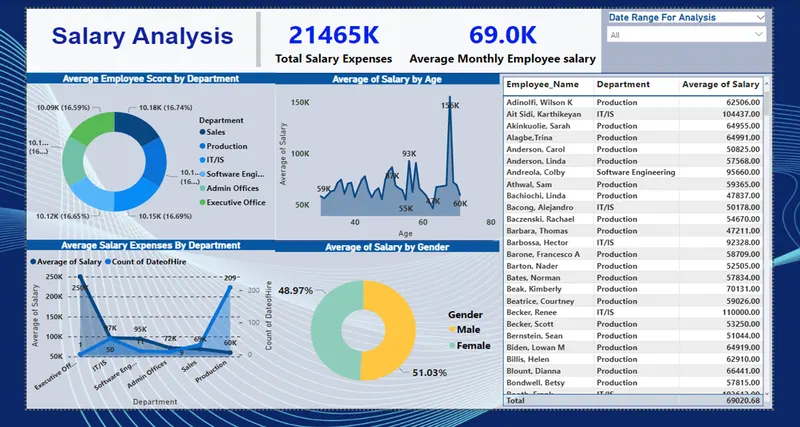
- Salary Analysis dashboard in this we can see complete salary of the organization.
Recommendations:
We can collect the good dataset for the process of data analysis.
We can work large dataset and analyse them with the proper format.
We recommend good dashboard and charts to easily data analysis.
We can perform the operations with different categories.
In this We can develop effective training program.
In this we can provide more regular feedback from employees.
Conclusions:
Human Resources analytics that are helps to use decision making that can business solutions by improving productivity.
By seeing these dashboards, we can conclude and the HR dashboards are used to show the real-time human resources process, taking related data and then using this data to make decisions to manage employees and reach the business goals.