Project 2 - Supply and Demand Gap Analysis
Supply And Demand Gap Analysis
Aim:
This project aim is an analytical method used to display human resource insights, and metrics with the purpose of improving workspace performance. The main approach is to improve the decision-making capability to achieve organization goals.
Introduction:
In this project it shows total employees are worked in organization. The employee is individual churn by deemed a significant problem for many organizations. It shows a particular employee are work in which position. It is used to improve workspace performance. And also, it shows different managers name with the different departments.
Problem Statement:
It is the time for promotion for employees who has good in working. Access which employee should be laid off if the organization needs to do so for variety of reasons.
- We can find out how many peoples are worked in particular organization.
- Counts the performance score.
- See the sum of sales by positions.
- See how many peoples are married, singles and etc.
- Counts the employee special projects.
- Assign position ID based on its performance.
Methodology:
In the organization they are different stages are present. The human resources data collection and analysis includes, organize how to collect the data, understands the data, analyse and compare, take action and earn recognition.
Tool Design:
Dashboard design based on employee’s data, view overall data, geographically, expertise wise, date of joining and also date of termination etc.
Data Pre-Processing and Cleaning:
In this step first we clean the data with the help of power query editor. We clean the data in a particular manner like, use first row has header, replace the duplicate values and also arranging the data in specific format. And also, some missing values. In this we can clean the data.
Data Interpretation:
After cleaning the data, we can add the data into power bi with the help of close and load option in power query editor. In data interpretation found some important information. In this data we can replace null values with 0. DAX is a collection of functions to calculate and return one or more values. DAX helps to create new information from data already in data model.
Data Visualization:
In visualization, with the help of power bi desktop software to make graph and charts and analyse an employee performance in organization.
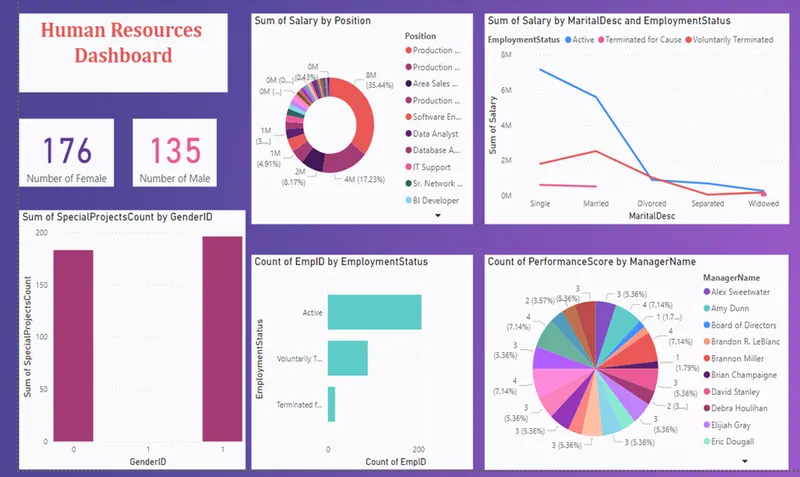
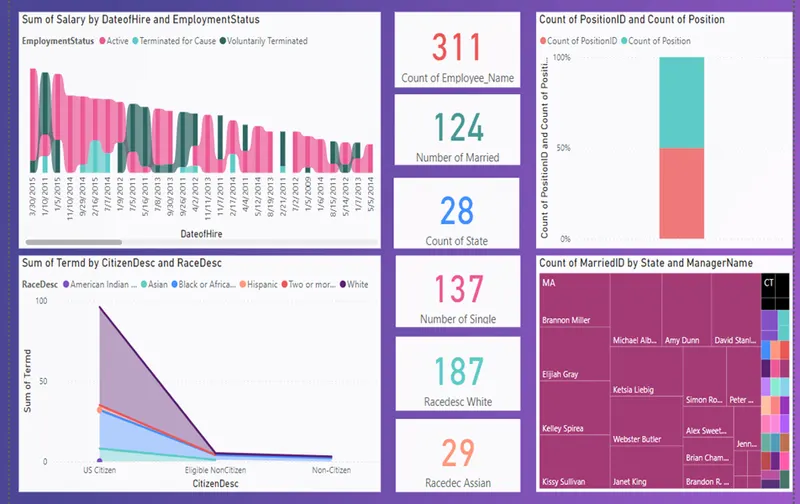
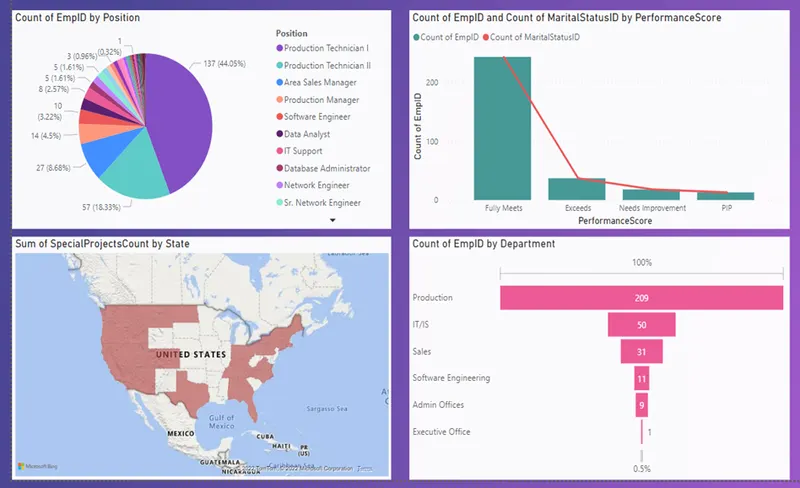
Here some relevant graphs and charts are attached:
Analysis:
- From the above visualization find some points.
- The dataset is available for list of distinct employees.
- The total of 311 employees are working in organization.
- Based on employee performance the organization gives a particular position.
- Total 124 members are married.
- Total 137 members are single.
- We can also analyse the employment status.
Insights:
- In conclusion, we can take a look at the final report for further analysis.
- The employee dashboard combines lot of factors that the employee’s performance. We can use Power BI to create multiple dashboards focused on individual factors to derive insights and predictions.
- Total employees in a special project.
- Employees due for give a position.
Recommendations:
- We can perform operations with various categories.
- We can collect good dataset for analysis.
- To analyse the data for more effective and create proper format of the chart.
- We can analyse the data of the overall organization.
- Develop an effective training program.
- Provide more regular feedback from employees.
Conclusions:
Human resources are a decision-making that can business solutions by improving productivity. This model shows the real-time human resources processes, taking related data and then using this data to make informed decisions to manage employees and reach the business goals.