Project 2 - Supply and Demand Gap Analysis
Project 2 - Supply and Demand Gap Analysis ( Uber Dataset )
By Mohit Bhupendra Jambhale
Aim:
To identify the root cause(s) of the problem of cancellation of requests for taxis at Airport and City trips, and to recommend ways to improve the situation in order to improve the availability and reliability of the client's car services. This will involve analyzing the data and presenting insights into the root cause(s) of the problem and possible hypotheses for why it is occurring, as well as recommendations for how to address the issue.
Introduction:
We may have some experience of travelling to and from the airport. We have used Uber or any other cab service for this travel? Did you at any time face the problem of cancellation by the driver or non-availability of cars?
Well, if these are the problems faced by customers, these very issues also impact the business of Uber. If drivers cancel the request of riders or if cars are unavailable, Uber loses out on its revenue.
Problem statement:
The goal of this analysis is to identify the root cause(s) of the problem of cancellation and non-availability of cars, and to recommend ways to improve the situation. Through this analysis, we will be able to provide the client with insights into the root cause(s) of the problem and possible hypotheses for why it is occurring, as well as recommendations for how to address the issue. The ultimate objective is to help the client find solutions that will improve the availability and reliability of their car services.
Methodology:
- Import and organize the data: This involves importing the data into Power BI and organizing it in a way that is suitable for analysis. This may involve cleaning and transforming the data, as well as creating relationships between different data tables.
- Explore and visualize the data: Use the various visualization tools in Power BI to explore the data and identify trends, patterns, and relationships. This may involve creating charts, maps, and other visualizations to represent the data in a way that is easy to understand.
- Analyze the data: Use the analytical tools in Power BI to perform more in-depth analysis of the data. This may involve using functions and formulas to calculate metrics and perform statistical analysis, or using machine learning algorithms to identify trends or patterns in the data.
Analysis (Data sheets pertaining to it):
Dataset:
There are six attributes associated with each request made by a customer:
- Request id: A unique identifier of the request
- Time of request: The date and time at which the customer made the trip request
- Drop-off time: The drop-off date and time, in case the trip was completed
- Pick-up point: The point from which the request was made
- Driver id: The unique identification number of the driver
- Status of the request: The final status of the trip, that can be either completed, cancelled by the driver or no cars available
When we check the data, we find that only 5 days for the month of July was provided for analyzing. Since the aim of this project is to find the reason for the cancellation, we need to check the details at the day level and at what time the cab requests are getting cancelled.
Data Cleaning: In this process we have checked all the data are in the required formats. Since we require to check the time of the request separately, the request time has been split as date and time in power query editor.
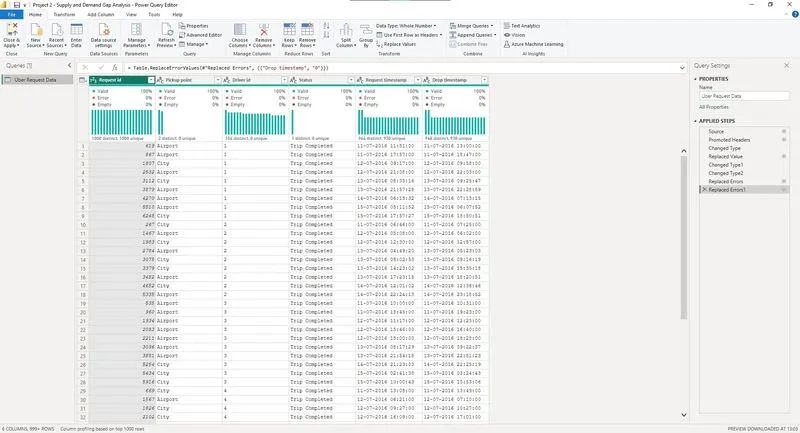
After this the data is applied to PowerBi dashboard.
Data Visualization:
Once the data is loaded to the PowerBI, we need to prepare some measures of the data to add in the visualization.
First and foremost, we need to take care that we don’t need the SUM of the Request ID but their COUNT.
We need to make measures of the following:
- Count of different statuses
- Count of Total Requests
- Percentage of the Different statuses
- Creating bin for the time brackets.
Insights:
The details of the visualization are as follows:
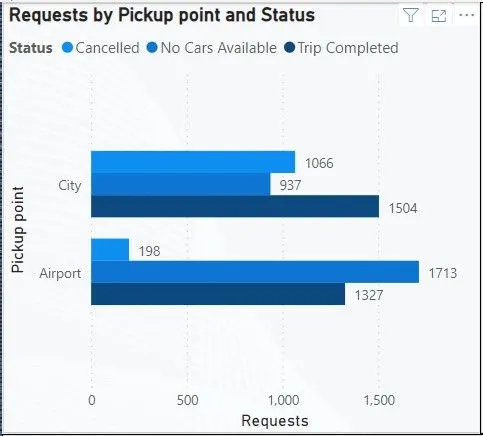
- Clustered Bar Chart:
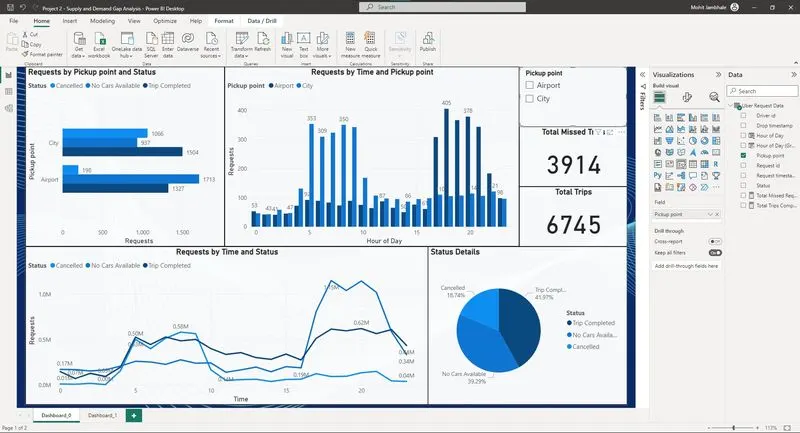
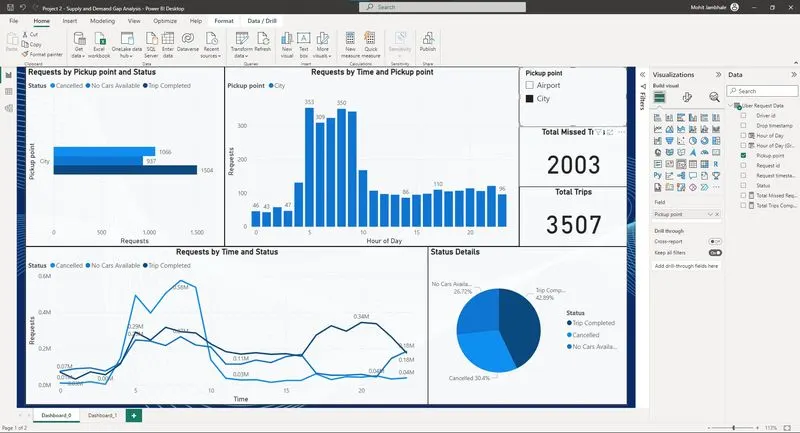
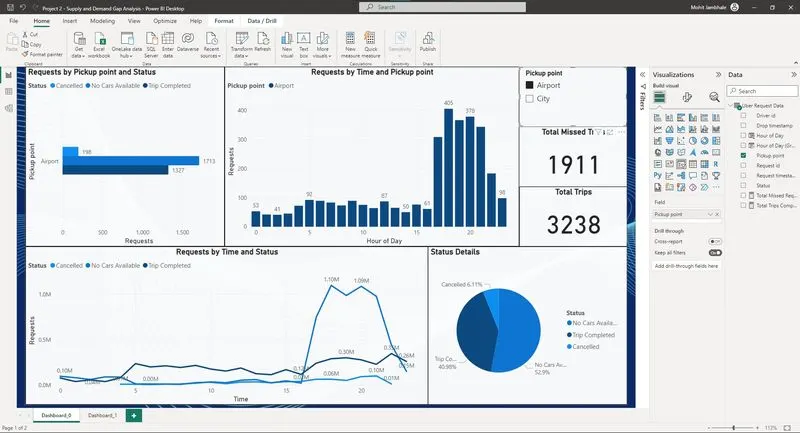
To show the data of the total requests from different pickup points and showing the status as Legends. Here we understand that the requests from airport is because of No cars are available and for requests from City the majority is due to cancellation by driver.
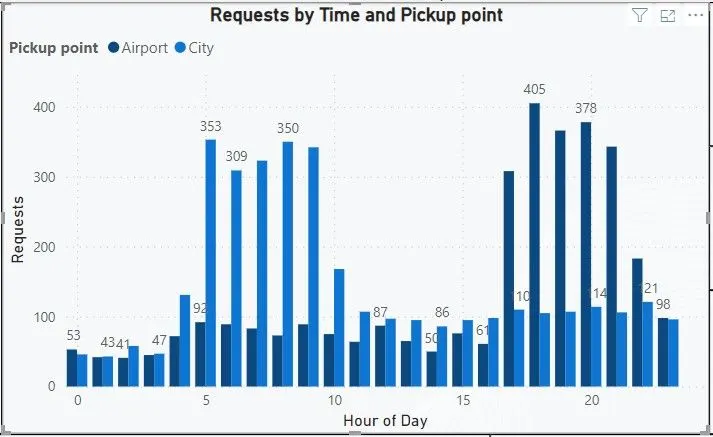
- Clustered Column Chart:
This chart shows the Total Requests categorized per Time with pickup point.
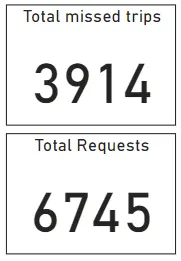
- Cards:
Two cards are made to summarize the total of the Requests and the Total missed Requests due to No car and cancellation by drivers.
- Pie chart:
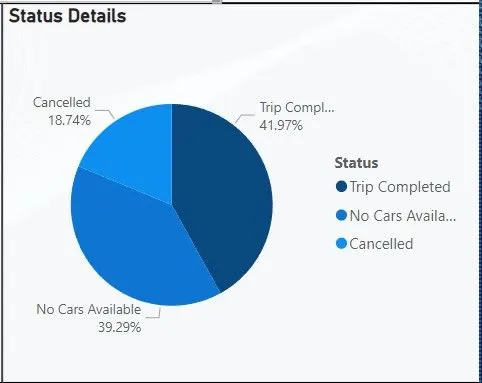
Pie chart is made to show the total of the status and the percentage contributed to each status. We find that the data show that the total of the Trip completed is less than 45% from these locations. And the remaining 55% can be considered as loss to the company as they are missed trips.
- Slicer:
Adding slicer with the 2 locations of the trip to analyze how much trips are received from both locations.
- Line chart:
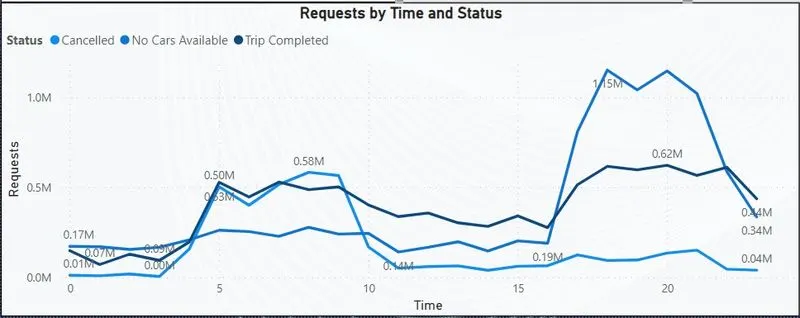
For further analysis line chart is used with the Requests and the time of request showing the different status in different lines.
Here we notice that there is a spike in cancellations from 6 am to 9 am for requests from City. The reason may be due to the heavy traffic due to working hours at that time and drivers are cancelling.
When we check the Airport data, we see that after 4 PM till 11 PM there are no cabs in the area and majority of the trips are missed.
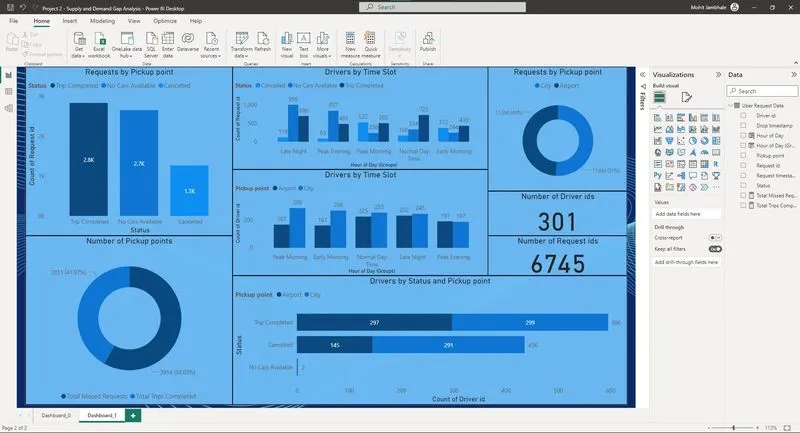
Dashboard 1:
Dashboard 2:
Recommendations:
City Data:
Airport Data:
From the above data we can finalize that if the company can get hold of those missed trips a major portion of revenue can be recovered.
For this we can propose the following data:
- Increase the number of drivers on the road during peak demand times: By having more drivers available during the times when demand is highest, you may be able to reduce the number of cancellations and increase the number of completed trips.
- Encourage drivers to work during peak demand times: You could consider offering incentives or bonuses to drivers who are willing to work during the times when demand is highest. This could include things like higher pay rates or other perks.
- Implement a surge pricing model: Surge pricing involves temporarily increasing prices during times of high demand in order to encourage more drivers to work and to ensure that there are enough cabs available to meet the demand. This can help to reduce the number of cancellations and ensure that there are enough cabs available for passengers.
- Improve the driver experience: If drivers are cancelling trips due to heavy traffic or other issues, you may be able to improve the driver experience by providing them with tools or resources to help them navigate more efficiently or by offering additional support.
- Expand your service area: If you are seeing a lack of available cabs in the Airport area after 4 PM, you may want to consider expanding your service area to include more nearby neighborhoods or areas where you can recruit more drivers. This could help to increase the number of cabs available to meet demand.
Conclusions:
In conclusion, the report has identified two significant issues impacting the performance of the transportation service: a spike in cancellations from 6 am to 9 am for requests from City, and a lack of available cabs in the Airport area after 4 PM. These issues are likely causing frustration for both passengers and drivers, and may be impacting the overall performance and success of the business.
To address these issues, several potential solutions have been proposed. These include increasing the number of drivers on the road during peak demand times, encouraging drivers to work during peak demand times, implementing a surge pricing model, improving the driver experience, and expanding the service area. Each of these solutions has the potential to help address the identified issues and improve the overall performance of the transportation service.
Going forward, it will be important to carefully consider these recommendations and determine which ones are most appropriate and feasible for the business. Further data and analysis may be needed in order to fully understand the root causes of these issues and determine the most effective solutions. By addressing these challenges, the transportation service can continue to provide a reliable and high-quality service to its passengers and drivers.
Reference:
Data provider : Kaggle raw dataset