Project 2 - Supply and Demand Gap Analysis
Uber
Supply and Demand Gap Analysis
Introduction:
- In this analysis, we explore the critical relationship between customer demand and driver availability within Uber's ride-hailing platform.
- Understanding and effectively managing this gap is crucial for optimizing operations and enhancing the overall user experience.
Objective:
- Our objective is to uncover insights and recommendations that bridge the supply and demand gap in the Uber ecosystem.
- By analyzing comprehensive datasets and utilizing advanced analytics techniques, we aim to provide valuable strategies for operational excellence.
Methodology:
- We have implemented thorough data collection methods and harnessed the capabilities of powerful analytical tools like Power BI to extract valuable insights from the data.
- Our methodology includes data cleaning, exploratory data analysis, and visualization techniques to gain a comprehensive understanding of the supply and demand dynamics.
Deliverables:
- Through this presentation, I will share key findings, actionable recommendations, and data-driven insights to help Uber optimize their operations and address the supply and demand challenges.
- We believe that this analysis will provide valuable insights for Uber's strategic decision-making processes.
Problem statements:
- Disparity in Pickup Point Distribution:
- Address gap between city and airport demand for balanced driver availability.
- Variations in Pickup Point Distribution by Status:
- Identify areas with service disruptions or unmet demand by status.
- Daily Distribution of Pickup Points in the City:
- Optimize driver availability by understanding fluctuating city demand.
- Hourly Distribution of Pickup Points in the City:
- Allocate drivers effectively during peak city demand hours.
- Hourly Distribution of Pickup Points at the Airport:
- Optimize driver availability during high-demand airport hours.
- Frequency of Airport Pickup Points by Time and Status:
- Address disruptions and unfulfilled requests at airports.
- Frequency of City Pickup Points by Time and Status:
- Identify city areas with service disruptions or unmet demand.
- Frequency of Time by Pickup Point and Status:
- Balance supply and demand based on time and location.
- Frequency of Time by Status:
- Understand ride request distribution for efficient driver availability.
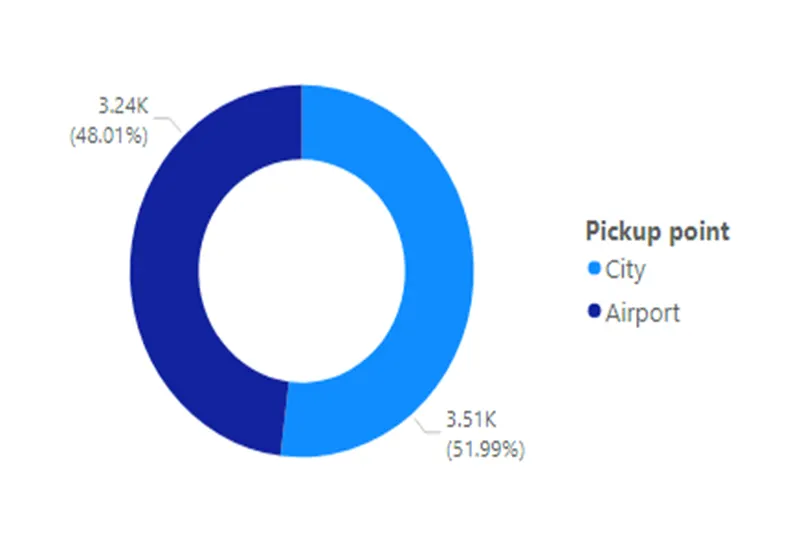
Distribution of Pickup Points:
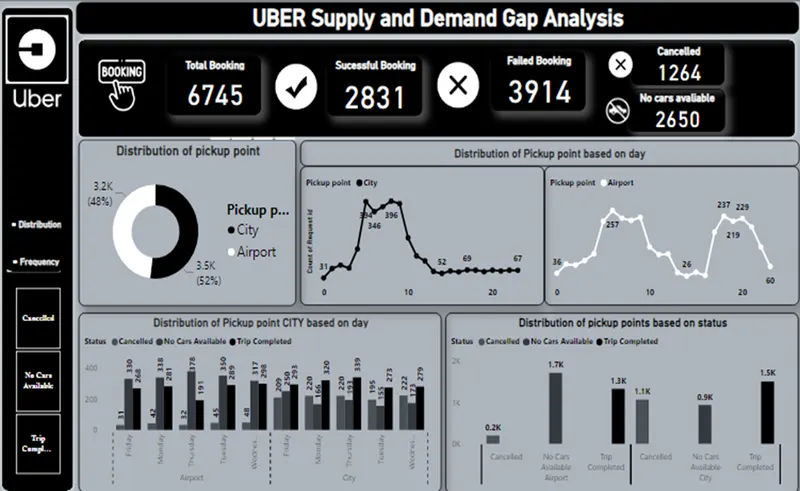
- The total count of pickup points for City as 3.5k and for Airport as 3.2k.
- Emphasize the importance of understanding the distribution of pickup points for effective resource allocation and service optimization.
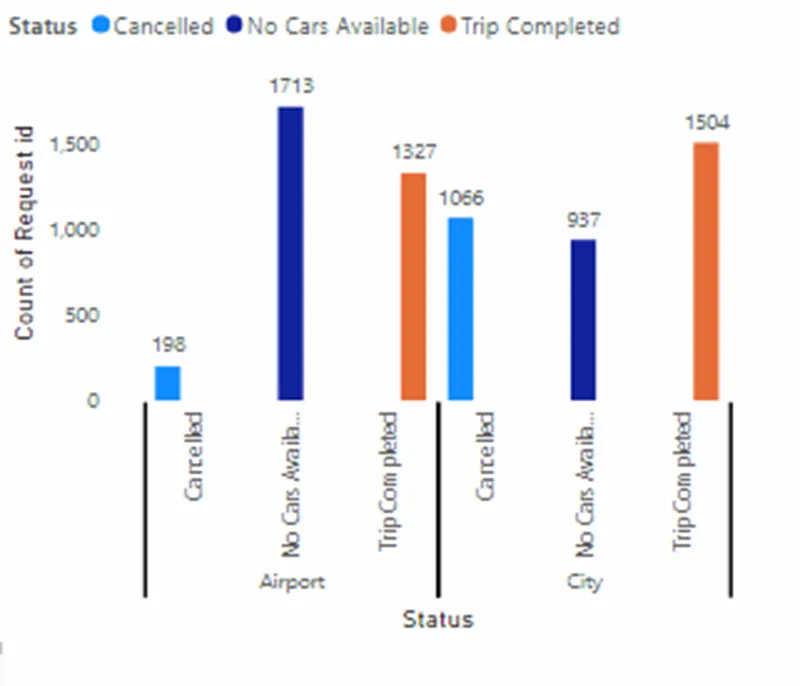
Distribution of Pickup Points based on Status:
- The airport has higher cancellation rates and instances of no cars available compared to the city.
- Addressing the supply-demand gap at the Airport is crucial for improving customer satisfaction.
- Efforts should be made to reduce cancellations and improve car availability in both locations.
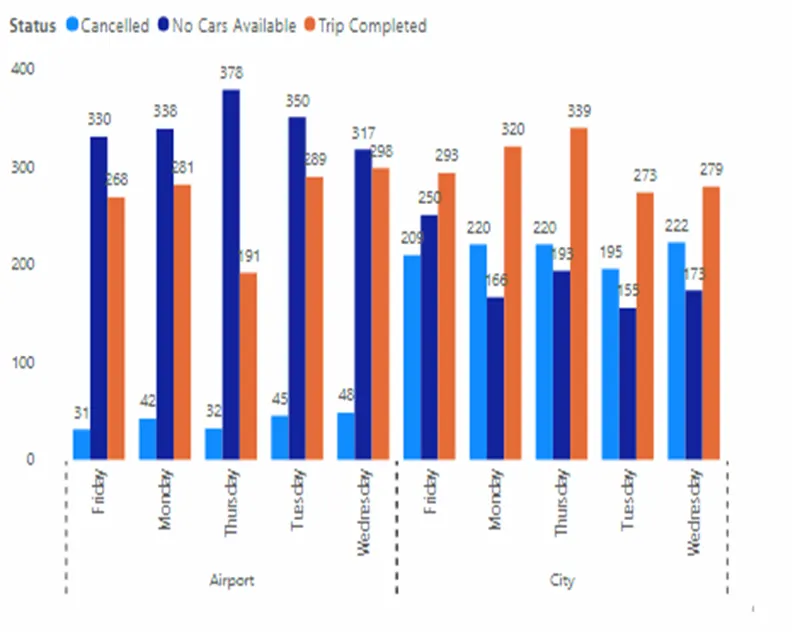
Distribution of Pickup Points based on Day:
- Consistent distribution patterns of pickup points based on weekdays.
- Fridays have better supply-demand coordination with lower cancellations and unavailability of cars.
- Mondays and Thursdays face challenges with higher cancellations and unavailability of cars.
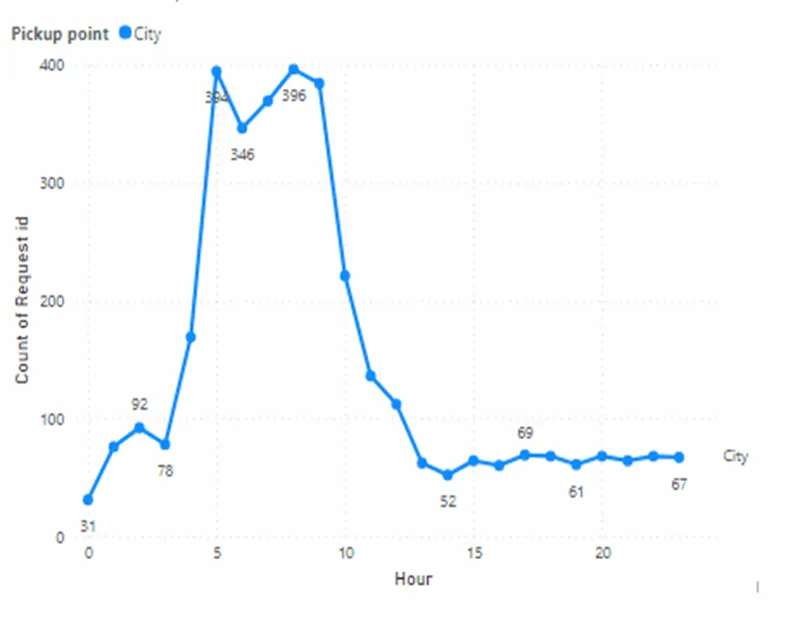
Distribution of Pickup Point CITY based on Hour of the Day:
- Peak demand for rides occurs during the morning commute around 8-9 AM.
- Peak demand for rides occurs during the morning commute around 8-9 AM.
- Another surge in demand is observed during the evening commute and post-work hours.
Distribution of Pickup Point Airport based on Hour of the Day:
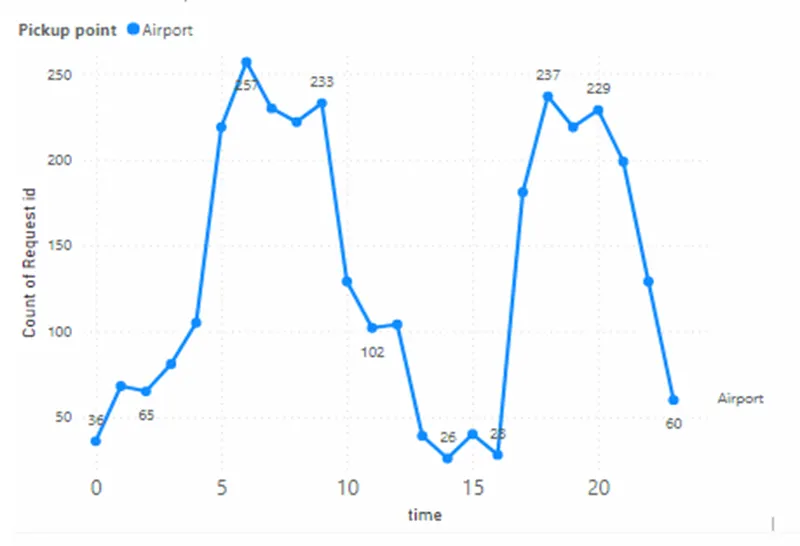
- The chart reveals a noticeable decrease in the count of request IDs for airport pickups during the afternoon hours.
- Specifically, there is a dip in demand between 12 PM and 4 PM, with the lowest point occurring around 2 PM.
- This period of lower demand can be considered a "daytime lull" for airport pickups, indicating a potential opportunity for drivers to focus on other areas or tasks during this time.
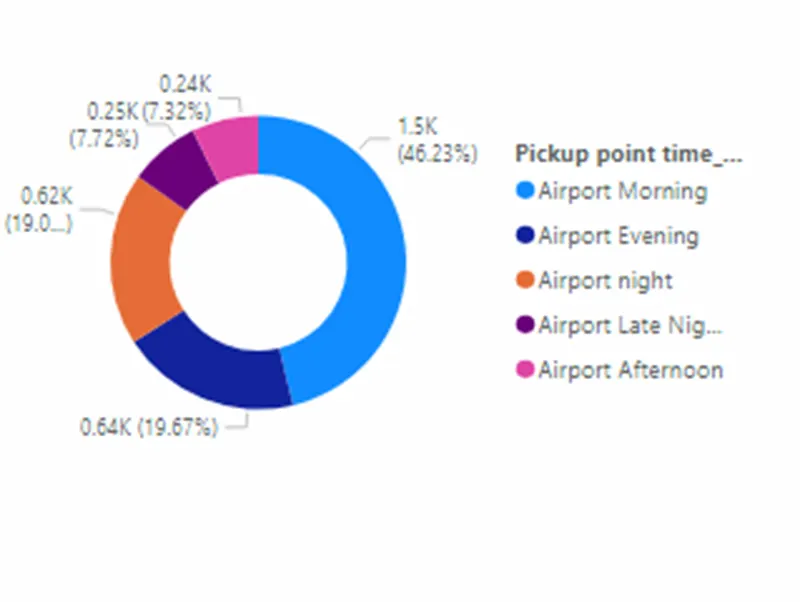
Frequency of Airport Pick-up Points based on Time of the Day and Status:
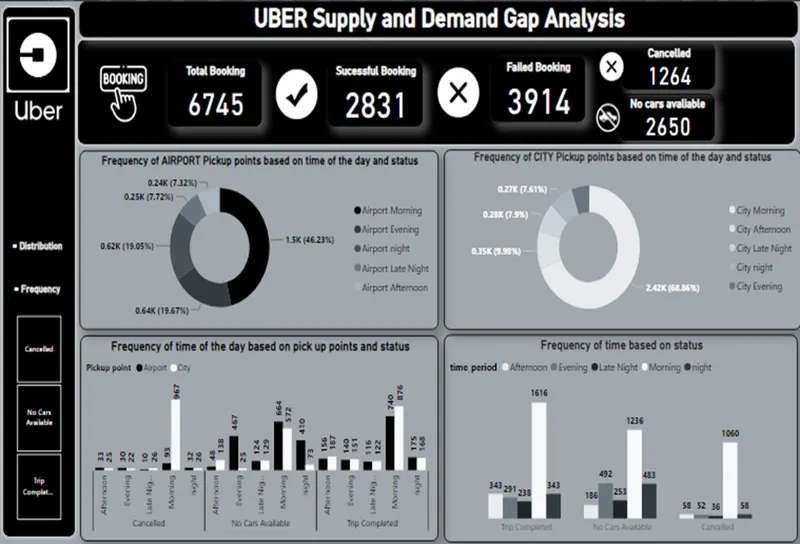
- Morning time: The most popular period, indicating high demand in the morning.
- Evening time: A significant period with considerable demand during the evening hours.
- Night and late nighttime: Both periods show notable demand during nighttime hours.
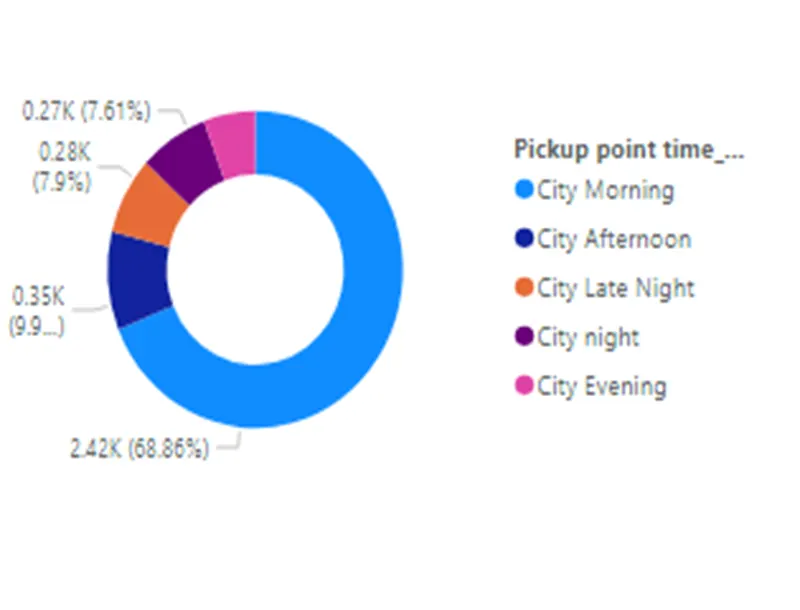
Frequency of City Pick-up Points based on Time of the Day and Status:
- Morning time: Most pickup requests in the city occur during the morning hours, indicating high demand.
- Evening, Night, and Late nighttime: These time periods experience relatively lower pickup request volumes in the city.
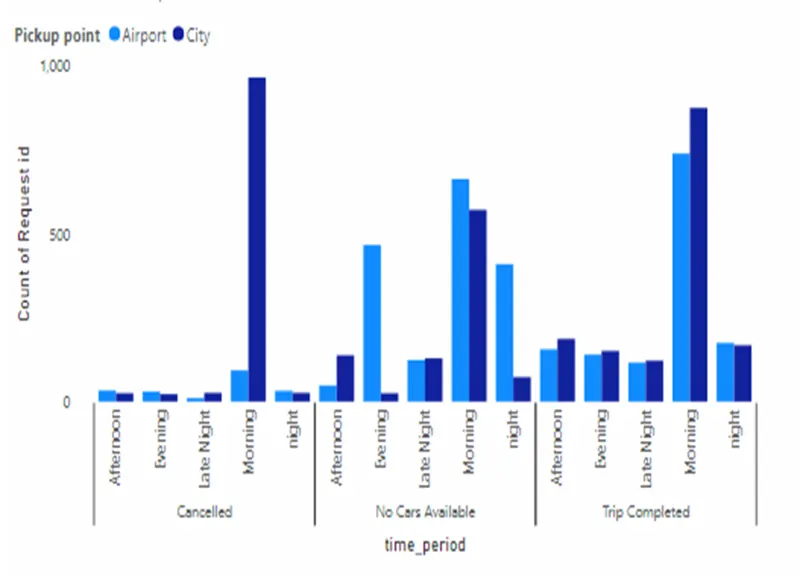
Frequency of time of the day based on pick up points and status:
- The Airport experiences a higher frequency of cancelled requests and instances of no cars available compared to the City, indicating potential service gaps that need to be addressed.
- Trips completed at the Airport are generally higher in the morning, while the City shows more trip completions during the evening and afternoon periods.
- The data suggests a need to focus on improving service availability and managing resources effectively to meet customer demand at both the Airport and City pickup points.
DASHBOARD:
INSIGHTS:
- Demand: City has higher pickup demand than Airport, highlighting the need for optimized resource allocation.
- Supply-Demand Gap: Airport faces more cancellations and unavailability of cars, necessitating attention to address the gap.
- Peak Times: Mornings and evenings are peak pickup hours in both the City and Airport, requiring sufficient car availability.
- Day of Week: Thursdays have more cancellations in City, while Mondays show higher cancellations at Airport.
- Airport Patterns: Early morning sees a surge in Airport pickups, indicating the need for adequate resources.
- City Patterns: Morning hours in City have more cancellations and the unavailability of cars, requiring improvement.
RECOMMENDATIONS:
- Increase car availability during peak hours and at the Airport.
- Address cancellations, especially in the morning and on Thursdays.
- Address cancellations, especially in the morning and on Thursdays.
- Address cancellations, especially in the morning and on Thursdays.
- Monitor and adjust operations based on performance metrics.
- Prioritize customer satisfaction for a seamless pickup experience.
CONCLUSION:
- In conclusion, the analysis of ride-sharing data provided valuable insights into pickup patterns and operational challenges. The Airport emerged as a key pickup point, requiring attention to address issues such as cancellations and car availability. Efforts should be focused on optimizing resources and ensuring a seamless pickup experience during peak morning hours.
- Furthermore, variations in pickup patterns across different days highlight the need for dynamic resource allocation based on day-specific demand. By addressing supply-demand gaps, improving car availability, and reducing cancellations, ride-sharing companies can enhance customer satisfaction and loyalty.
- In summary, leveraging these insights, ride-sharing companies can take proactive measures to optimize their service. By focusing on efficient resource management, improved communication, and addressing operational challenges, they can create a reliable and satisfying experience for riders, leading to increased customer loyalty and business success.
THANK YOU