Project 2 - Supply and Demand Gap Analysis
Aim:
The aim of this project is to collect and analyze the data in detail for a cab company named as sigma cabs so that they can able to find out their positives and negatives
Introduction:
The main objective is to analyze the cab details and customer details so that we can able to understand what types of cabs are mostly preferred by customer by that we can introduce that type of cabs in large numbers for future so that we can be more profitable
Problem Statements:
- In this project we have analyzed the average customer rating and average trip distance with the help of new measure and DAX function
- We have analyzed the sum of cancellation last month and sum of customers across months
- We have analyzed the cancellation records according to the gender
- We have analyzed the trip distance according to the different types of cabs
- We have analyzed the customer rating according to the different types of cabs
- We have analyzed the life style index according to the confidence life style index
- We have analyzed the sum of all three variables according to the different types of cabs
- We have analyzed the total trip distance according to the gender
- We have analyse the customer across months and surge pricing type according to destination type
- We have analyzed the cancellation last month and sum of customers across months according to cab type
- We have analyzed the customer across months according to gender
- We have analyzed the sum of all three variables according to gender
Methodology:
Step 1:
Data Importing:
In power BI desktop with the help of the get data option, import the CSV data which is named as sigma_cabs and click load option
Step 2:
Data Cleaning:
After loading the data and after analyzing the data I understood that there are 131662 rows and 14 columns. And in that some of the columns contained null values I have replaced the null values by 0 with the use of replace functions and started working on the data.
Step 3:
Visualizations:
In visualization part with the help of power BI desktop software I have used different kinds of charts, graphs, cards and table to display the data in the format which will be easy to understand
Analysis:
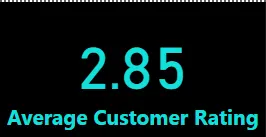
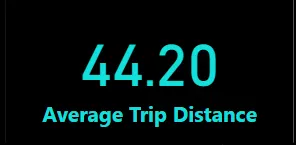
In analysis part first we have analyzed the average customer rating and average trip distance by creating new measures and used average DAX function and finally we have obtained the above results and used cards to display that


In the second analysis we have analyzed the total cancellation that was done last month and also obtained the total customer since months and we have obtained the above results and used cards to display that