Project 2 - Supply and Demand Gap Analysis
CAB SERVICE - SUPPLY AND DEMAND GAP ANALYSIS
Table of Contents
- Aim
- Introduction
- Problem statement
- Methodology
- Analysis (Data sheets pertaining to it)
- Insights
- Recommendations
- Conclusion
Aim:
This project aims to collect and analyze the data of Trip Pricing with Taxi Mobility Analytics site data and analyze it in detail by each Destination type, Gender, Type of Cab and Customer Rating and trip destination.
Introduction:
The main objective of this project is to analyze the data on, Trip pricing with taxi mobility. Through the Analysis of data, we can find out some important insights
Methodology:
Step 1: Data cleaning
In data cleaning I cleaned the data with the transform data option present in Power BI because the dataset was not cleaned and included some missing values, so with the help of the duplicates function in Power BI, I cleaned the data and replaced the null values with 0.
Step 2: Data interpretation
In this data interpretation step, I found out some important information about the data set.
- The data set was almost clear and completed.
- I replaced the null values with 0.
- There is a total of 131662 rows and 14 columns.
Step 3: Visualization
In visualization, I took the help of Power BI Desktop software to make graphs and charts.
Analysis (Data sheets pertaining to it):
In observation found some interesting points that are mentioned below.
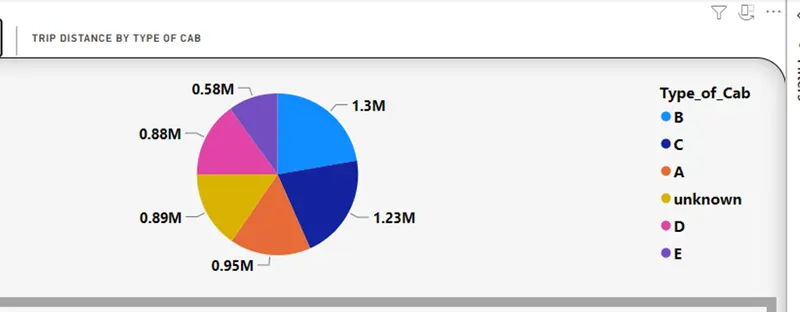
- According to data there are 6 types of cars and among that one type is unknown.
- The total trip distance covered by each type of car is shown.
- Type B covers the maximum distance of 1.3M
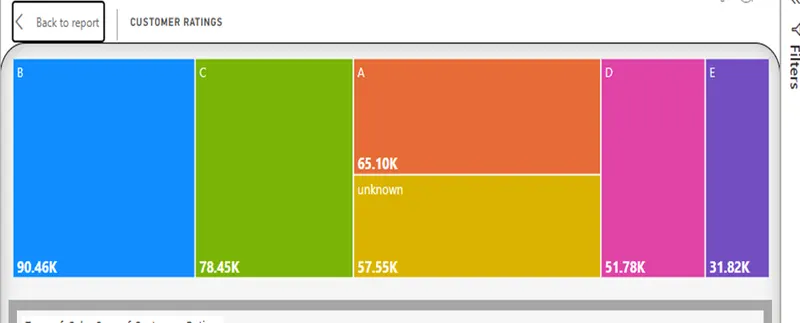
- Customer Rating of different types of cars is shown
- Type B has the highest customer rating of 90.46k.
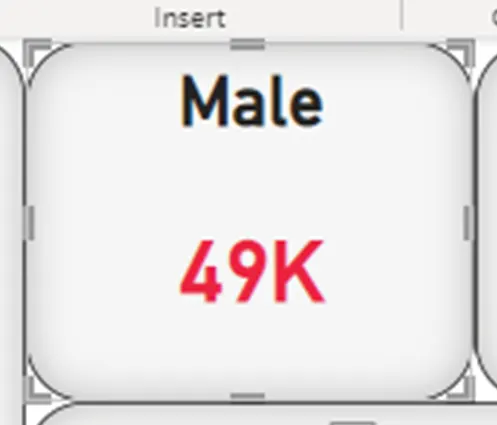
- Total number of males travelled is 49k.
- A measure is created to find the males travelled
Maletravelled = CALCULATE(COUNT(sigma_cabs[Gender]),sigma_cabs[Gender]="male", sigma_cabs[Cancellation_Last_1Month] = 0 )
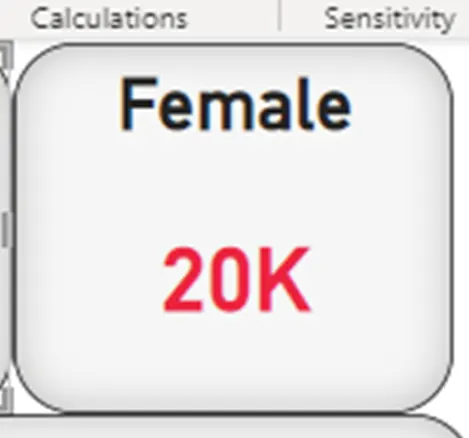
- Total number of females travelled is 20k.
- A measure is created to find the males travelled
Femaletravelled = CALCULATE(COUNT(sigma_cabs[Gender]),sigma_cabs[Gender]="Female", sigma_cabs[Cancellation_Last_1Month] = 0 )
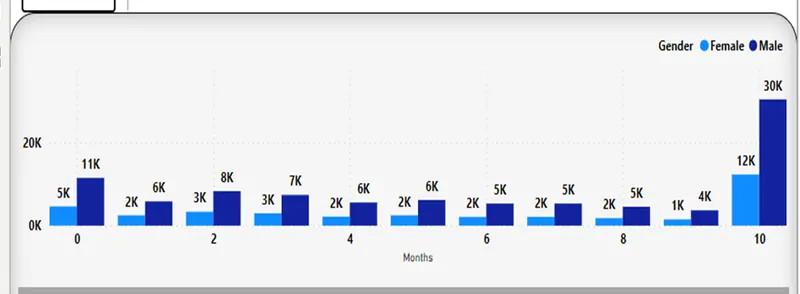
- Count of customers since months are shown.
- There are 42k customers since 10 months.
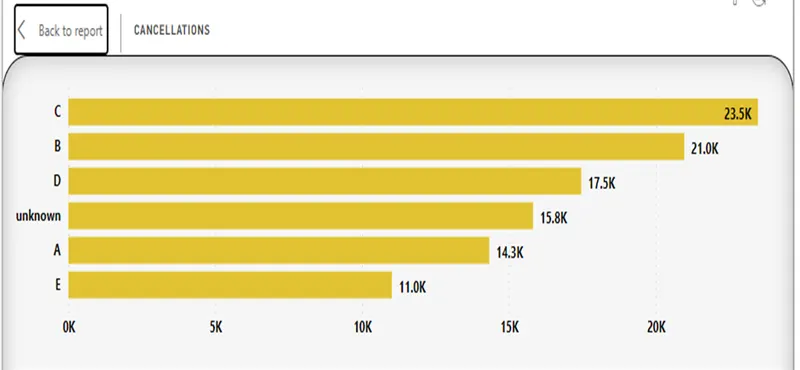
- Cancellations regarding type of cabs is shown.
- Type c cabs has more number of cancellations of 23.5k
Insights:
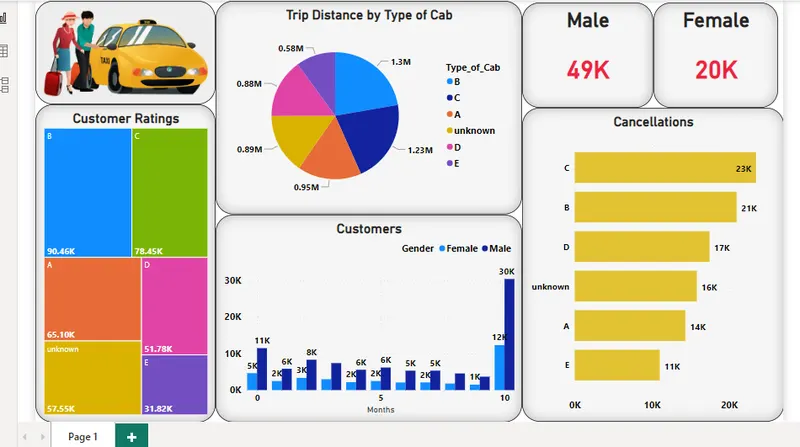
- In conclusion, we can take a look at the final Dashboard for further analysis.
- We can see the values according to gender.
Recommendations:
- We can collect a large dataset for analysis.
- We can analyze the data of the trip destination.
- Like this dataset we can perform operations with various types of cabs, gender, or destination type.
- We can work on large datasets and analyze them with the proper format of the chart.
Conclusion:
- In conclusion, we can look at the final Report for further analysis.