Project 2 - Supply and Demand Gap Analysis
Project 2: Supply and Demand Gap Analysis
Aim:
The aim of analysis is to identify the Supply and Demand gap analysis between Trip completed, cancelled and non-availability of OLA cars to pick up to and from Railway station and Bus stand.
Introduction:
The aim of analysis is to identify the root cause of the problem (i.e. cancellation and non-availability of cars) and recommend ways to improve the situation. As a result of your analysis, we will be able to present to the client the root cause(s) and possible hypotheses of the problem(s) and recommend ways to improve them.
Problem Statement:
- We may have some experience of travelling to and from the Railway station & bus stand. We have used OLA or any other cab service for this travel? Did you at any time face the problem of cancellation by the driver or non-availability of cars?
- Well, if these are the problems faced by customers, these very issues also impact the business of OLA. If drivers cancel the request of riders or if cars are unavailable, OLA loses out on its revenue. Let’s hear more about such problems that Uber faces during its operations.
Methodology:
- Data Cleaning
In data cleaning I cleaned the data with the transform data option present in Power BI because the dataset was not cleaned and included some missing values, so with the help of the duplicates function in Power BI, I cleaned the data and replace the null values with 0 and then started working on it.
- Visualization
In visualization, I took the help of Power BI Desktop software to make graphs and charts.
Analysis (Data sheet pertaining to it ):
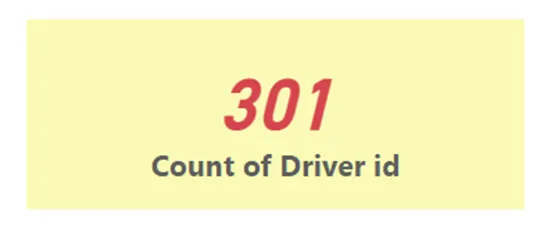
Totally there is 301 OLA car drivers available according to the analysis from the dataset.
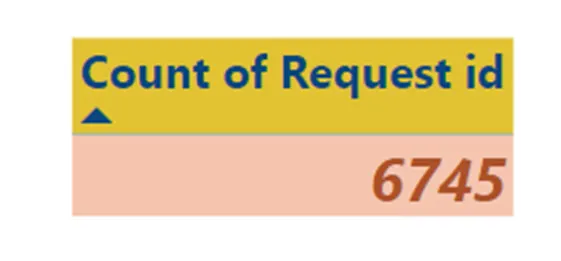
There are totally 6745 request came for the OLA cars for to/from the Railway station and Bus stand
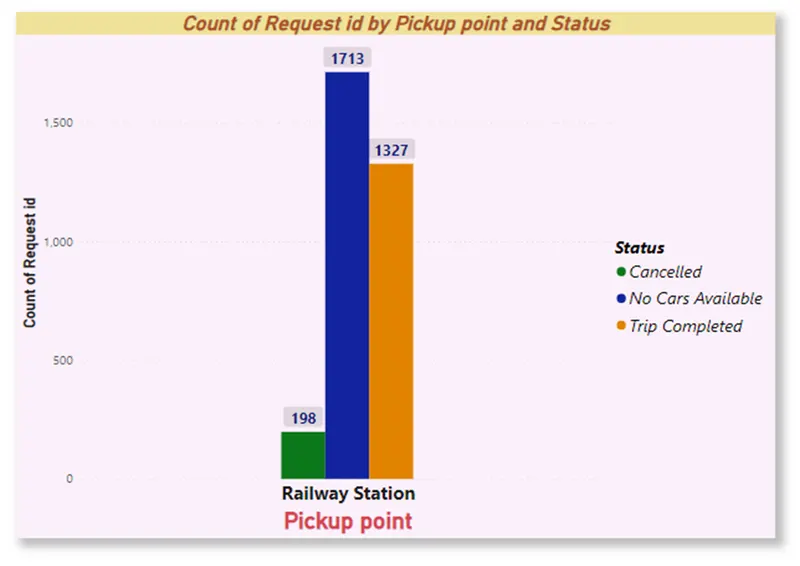
Now We have to findout the status of the pickup point which is Railway station. For the railway station there is totally 3238 request were received. But among 3238 requests 198 request were cancelled, for 1713 request id’s car is not available. Only 1327 Request id’s demand were completed the trip. So we couldn’t complete the 1713 requested id’s.
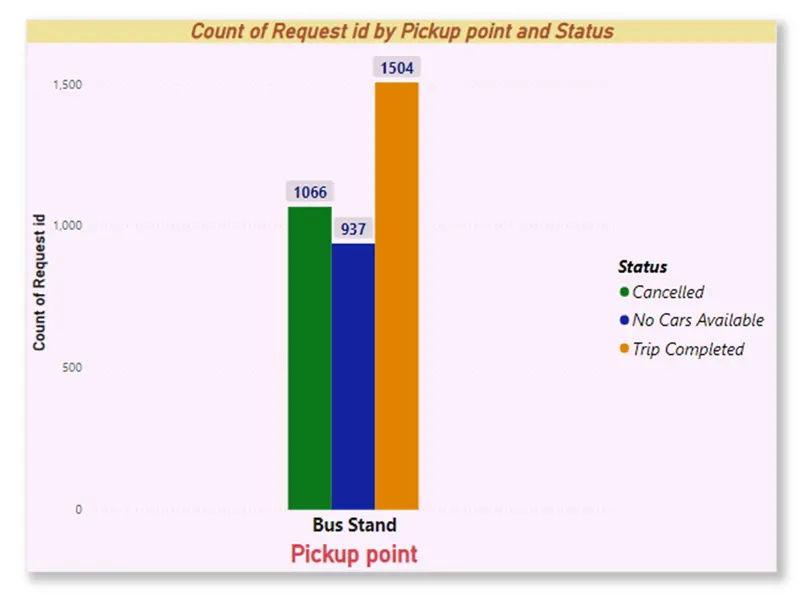
Now We have to findout the status of the pickup point which is Bus stand. For the Bus stand there is totally 3507 request were received. But among 3507 requests 1066 request were cancelled, for 937 request id’s car is not available. Only 1504 Request id’s demand were completed the trip. So we couldn’t complete the 937 requested id’s.
Insights:
- According to our analysis, We couldn’t complete all the trips from the request id’s.
- For railway station we have concentrate more, because the count of car not available is more than the count of trip completed.
- For Bus stand we have concentrate more but not than railway station, because the count of car not available is less than the count of trip completed. Anyway it also coming near to the count of trip completed.
Recommendations:
- Have to increase the Cars and keep it up specially for the railway station.
- Have to increase the Car drivers also.
- Drop or pickup the people as soon as possible.
- Mention the Time when the people request the Car, so that we can save time to keep for the other people.
Conclusion:
According to analysis we need to increase the cars and drivers, do not waste the time unnecessarily. “Time is Gold”. Thiruvalluvar says, “The pendant world’s dominion may be won, in fighting time and place by action done”.