Project 2 - Supply and Demand Gap Analysis
Project 2 - Supply and Demand Gap Analysis
Dataset - https://www.kaggle.com/datasets/mehmettahiraslan/customer-shopping-dataset
Project 2 - Supply and Demand Gap Analysis
Aim:
This project aims to understand the underlying patterns in the data and to use this information to develop strategies for improving customer satisfaction, increasing sales, and optimizing business operations.
Introduction:
Retail Sales Data is a type of customer shopping dataset that contains information on the sales transactions of a retail store or chain. The dataset typically includes data on product sales, including the date and time of the sale, the product description, the quantity sold, and the price paid by the customer. In addition, retail sales data may also include information on customer demographics, such as age, gender, income, and location, as well as details on store location and layout.
Problem statement:
The behavior of a thorough analysis of retail sales data and identifying key trends and patterns that can be used to develop effective strategies to improve sales and customer satisfaction.
Methodology:
- Data cleaning:
Import the data in Power BI, transform the data, and check for duplicates and null values. Remove the duplicates if it exists and replace the null values with 0.
- Data interpretation:
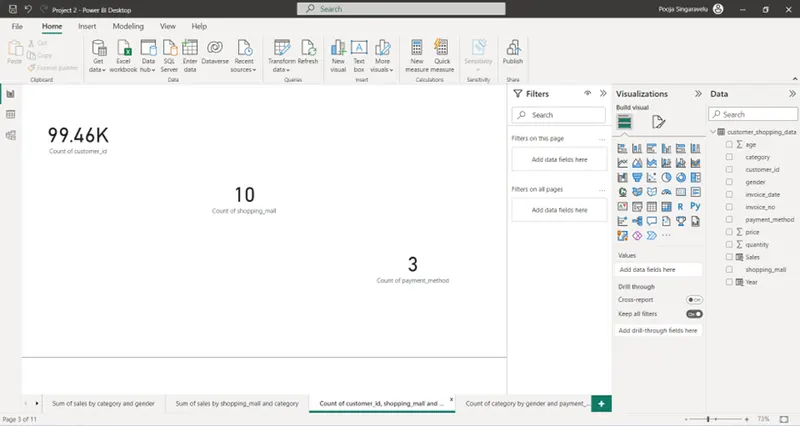
This data set contains 99457 rows and 10 columns.
- Data visualization:
Visualization of the given data set was performed in Power BI Desktop. Visualizations are done with the help of charts and graphs.
Analysis:
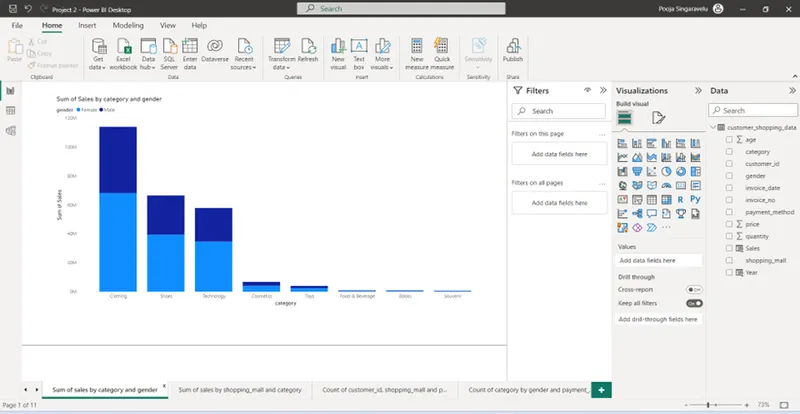
Sum of sales by category and gender
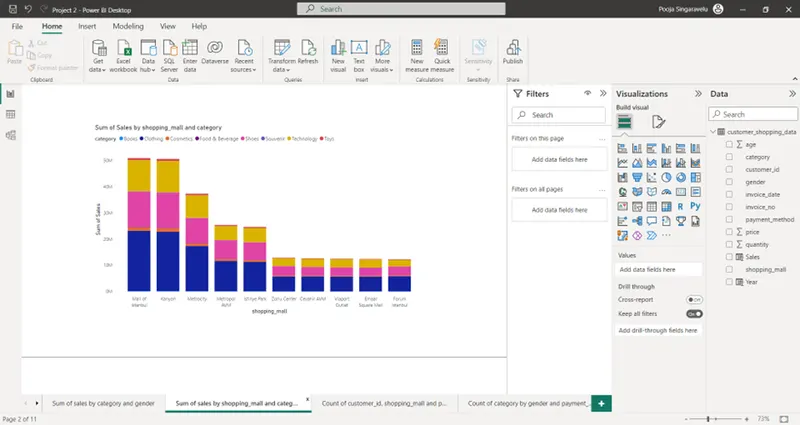
Sum of sales by shopping mall and category
Count of customer id, shopping mall and payment method
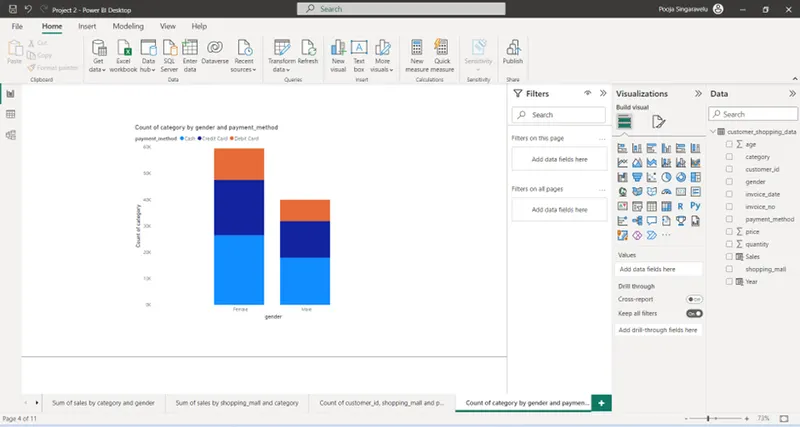
Count of category by gender and payment method
Sum of sales by shopping mall
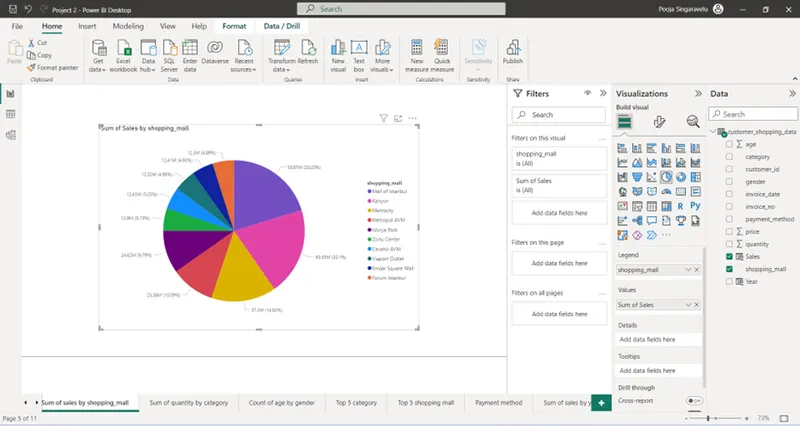
Sum of quantity by category
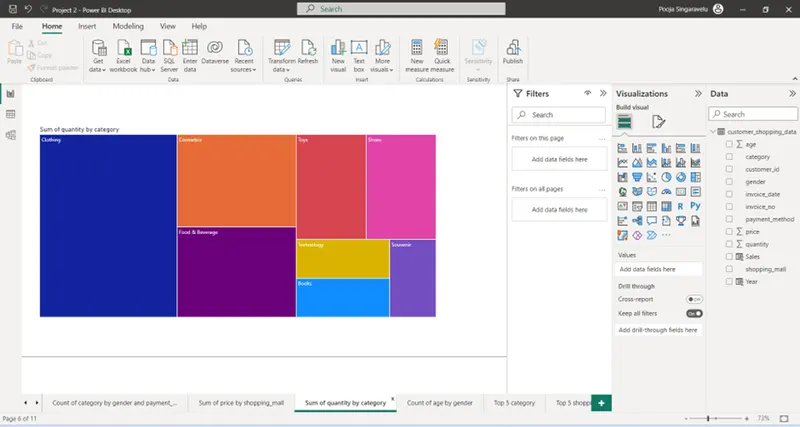
Count of age by gender
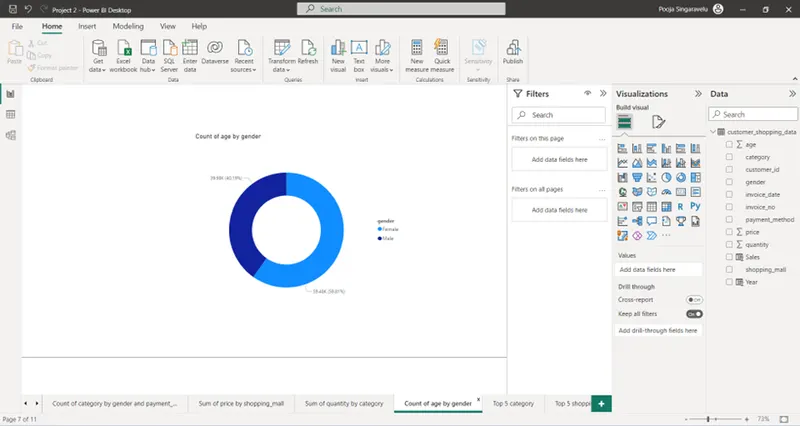
Top 5 category based on sales
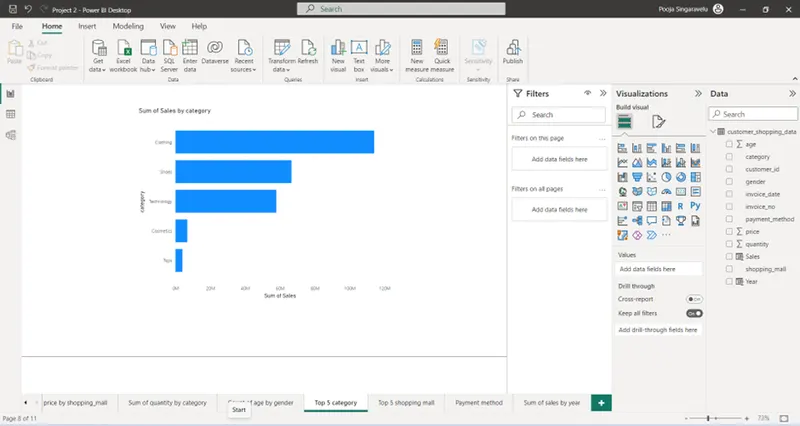
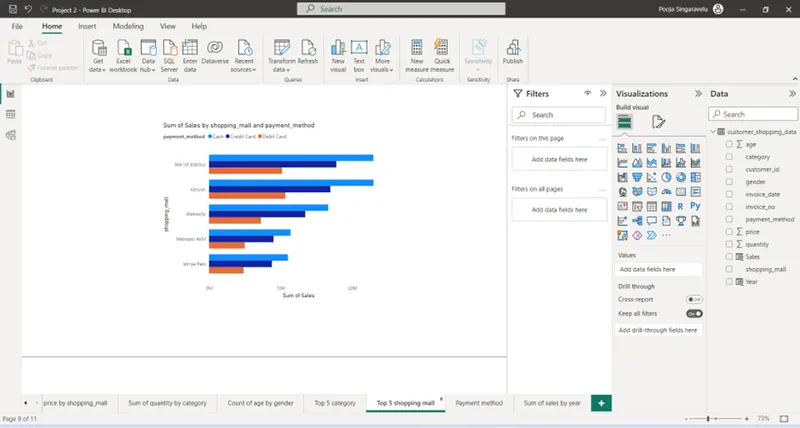
Top 5 shopping mall based on sales and payment method
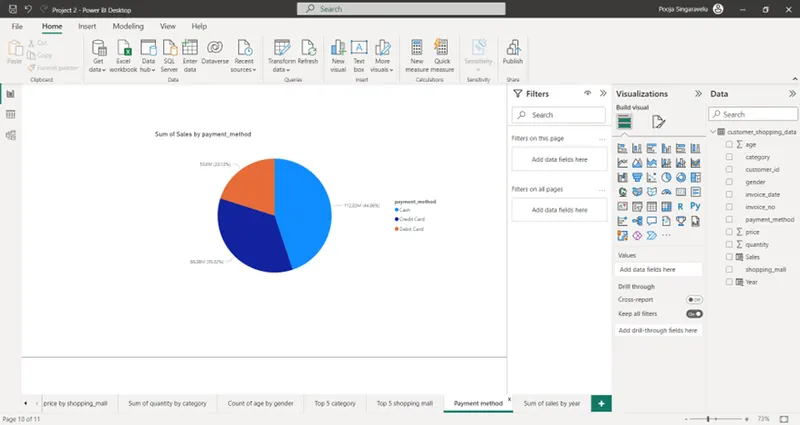
Sum of sales by payment method
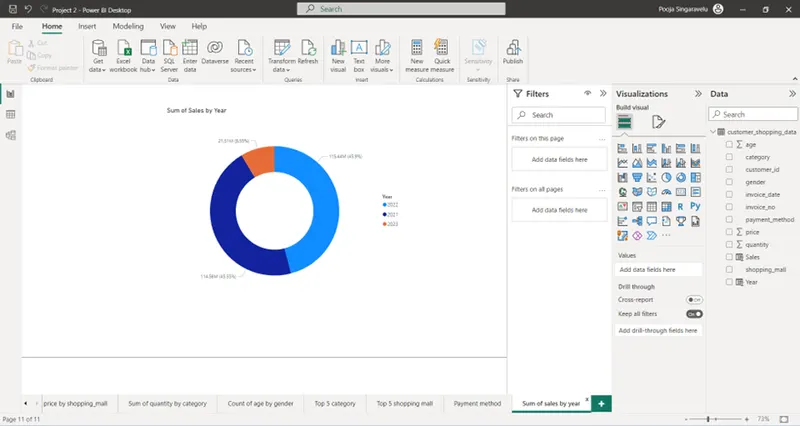
Sum of sales by year
Insights:
Based on the analysis, we can see:
- Top 5 category
- Top 5 shopping mall
- Most frequently used payment method
- What item has most purchased
- Which year has more sales, etc
Recommendations:
We can perform analysis and visualizations on a large set of data.
To improve the dataset, we can add customer addresses, feedback given by customers, star ratings, etc
Conclusions:
In conclusion, we can see that most female customers purchased more. And most of the customers preferred the cash-on-delivery payment method. We can see that in 2002, the sales percentage is 45.9%. The mostly chosen category was clothing and most of the customers preferred the Istanbul shopping mall. The analysis shows that there are 59.81% female customers and 40.19% male customers.