Project 2 - Supply and Demand Gap Analysis
Drive Link: https://drive.google.com/drive/folders/1VQzbBrh93VAGM4fiQ5kOazojO4QKdqRv?usp=drive_link
Project 2
Supply and Demand Gap Analysis
Aim:
This Project mainly aims to help in matching the right cabs with the right customers quickly and efficiently.
Introduction:
Data provided by an Indian cab aggregator service Sigma Cabs. Their customers can download their app on smartphones and book a cab from anywhere in the cities they operate in. They, in turn search for cabs from various service providers and provide the best option to their client across available options. They have been in operation for little less than a year now. The main objective is to build a predictive model, which could help them in predicting the pricing and experience of the customers and how to improve the customer experience and to get more customers.
Problem statement:
We have to analyse the data as the data is very large and they are not cleaned properly so we have to do data cleaning and analyse the data and find the details like cancellation, customer rating, gender-based details, trip distance and other details.
Methodology:
Data Importing:
In power BI desktop with the help of the get data option import the CSV data which is named as alpha cabs and clicked load option.
Data Cleaning:
After loading the data and after analysing the data, I understood that there are 131662 rows and 14 columns and in that some of the columns contained null values so I have replaced the null values by 0 with the use of replace functions and started working on the data.
Visualizations:
In visualization part with the help of power BI desktop software, I have used different kinds of charts, graphs, cards and table to display the data in the format which will be easy to understand.
Analysis:
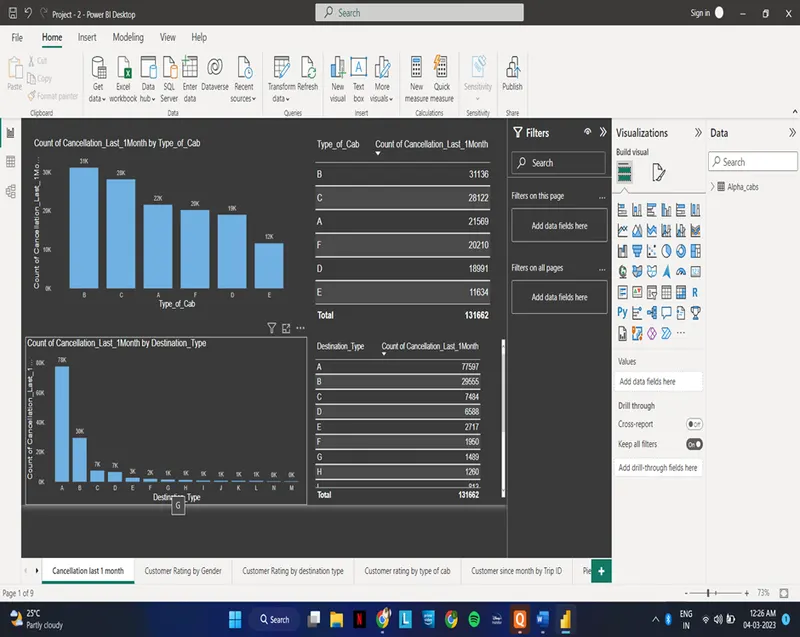
On checking with report mentioned above we see that in Cancellation last 1month with respect to Type of cab “B” has the highest cancellation in last 1 month and with respect to Destination type “A” has the highest cancellation in last 1 month.
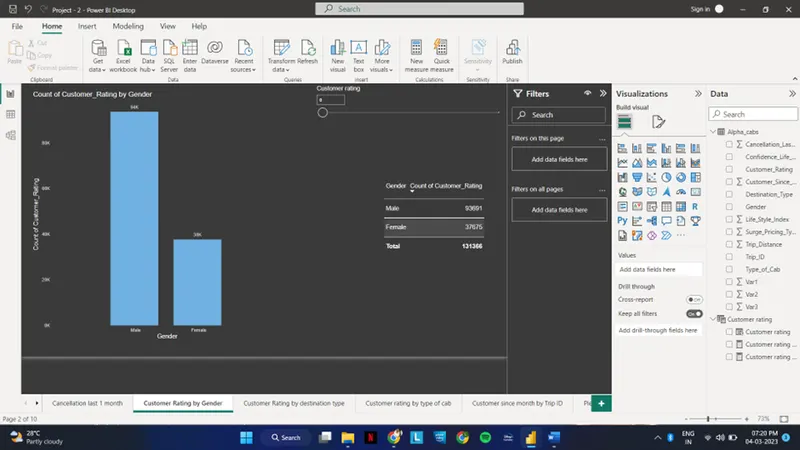
On checking with the report mentioned above we have analysed the customer rating with respect to genders with What-IF analysis and add the slicer to the report so we can get specific count for each rating and mostly we see that “Male” has the highest customer rating than female.
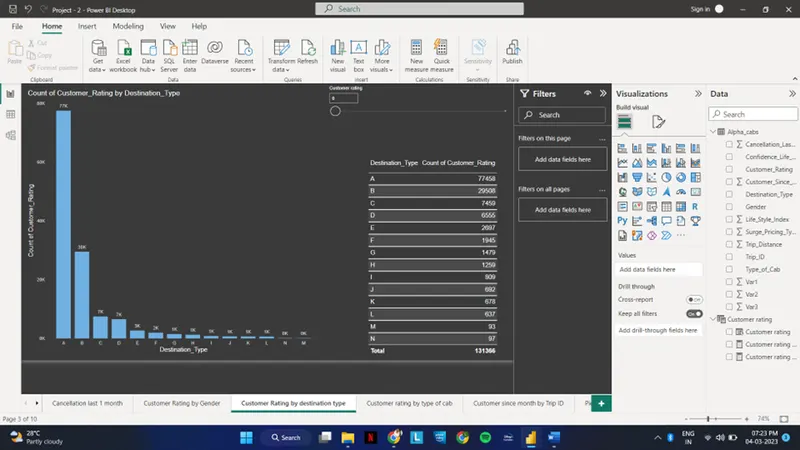
And in customer rating with respect to destination type with What-IF analysis and add the slicer to the report so we can get specific count for each rating and mostly we see that “A” has the highest customer rating.
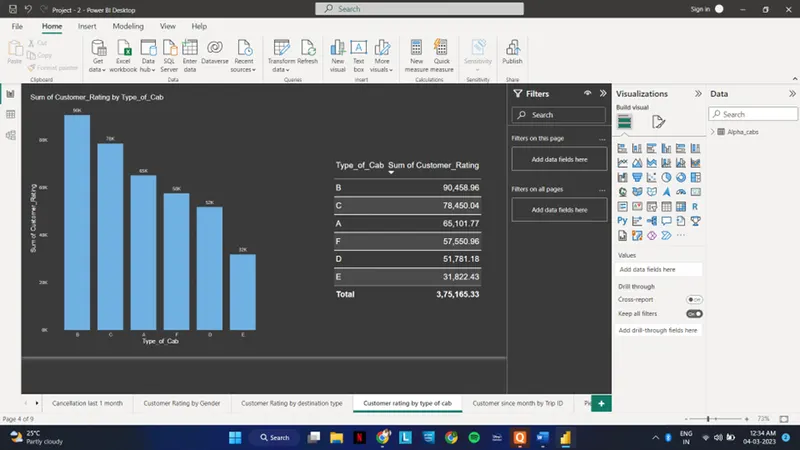
When analysing customer rating with Type of cab with What-IF analysis and add the slicer to the report so we can get specific count for each rating and we see that when we give 1 as a rating in slicer “D” is the highest, for 2 and 3 we see that “B” is highest and for 4,5 rating we see that “A” type of cab has the highest customer rating
Now let us see the results of the analysis with customer since months by trip id with the help of this analysis we can find how long the customer is with the Alpha cabs.
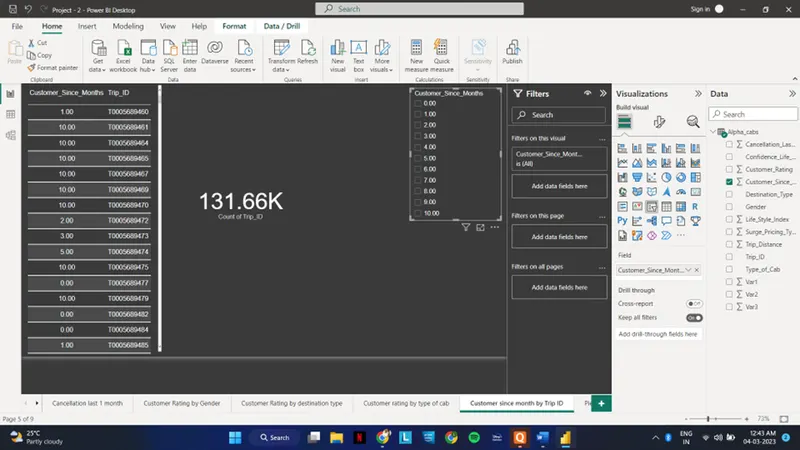
Totally there are 131.66K. Now when we select each month number in the filter we can find the customer since month with the Alpha cabs.
- When the customer since month is selected as 0, then the value of customer since month is 16.09K.
- When the customer since month is selected as 1, then the value of customer since month is 8297.
- When the customer since month is selected as 2, then the value of customer since month is 11.62K.
- When the customer since month is selected as 3, then the value of customer since month is 10.35K.
- When the customer since month is selected as 4, then the value of customer since month is 7726.
- When the customer since month is selected as 5, then the value of customer since month is 8641.
- When the customer since month is selected as 6, then the value of customer since month is 7375.
- When the customer since month is selected as 7, then the value of customer since month is 7407.
- When the customer since month is selected as 8, then the value of customer since month is 6328.
- When the customer since month is selected as 9, then the value of customer since month is 5147.
- When the customer since month is selected as 10, then the value of customer since month is 42.68K.
Now let’s see the results of the pie-chart based on gender with confidence life style and surge pricing
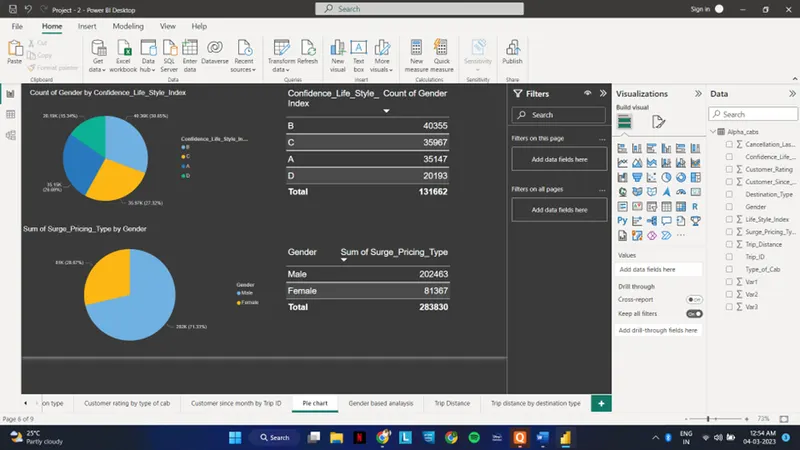
Now let’s see the results of the analysis based on Gender by customer rating, cancellation last 1 month and Trip Id.
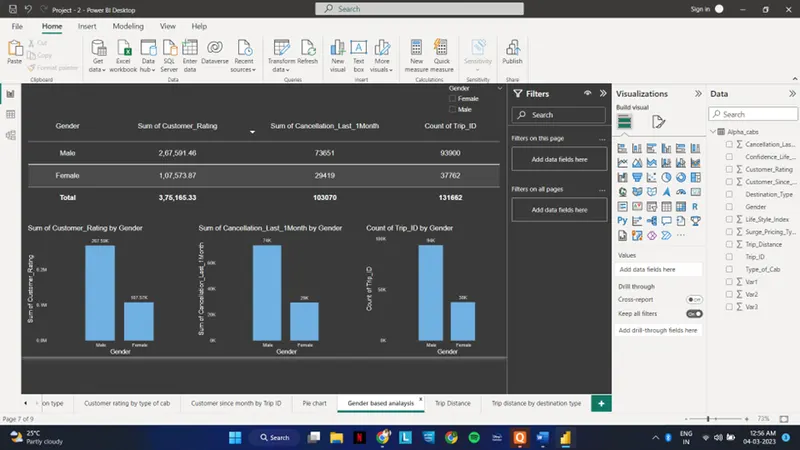
On the above analysis we see that the Male gender is topping all the results.
Now let’s see the results of the analysis based on the trip distance.
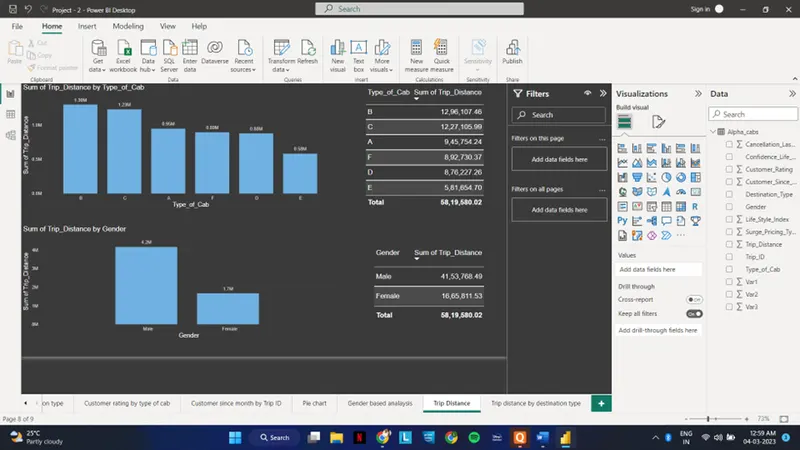
The highest distance covered by the Type of cab is “B” with 1.30M distance is covered.
The highest trip distance covered by the Gender is “Male” with 4.2M distance.
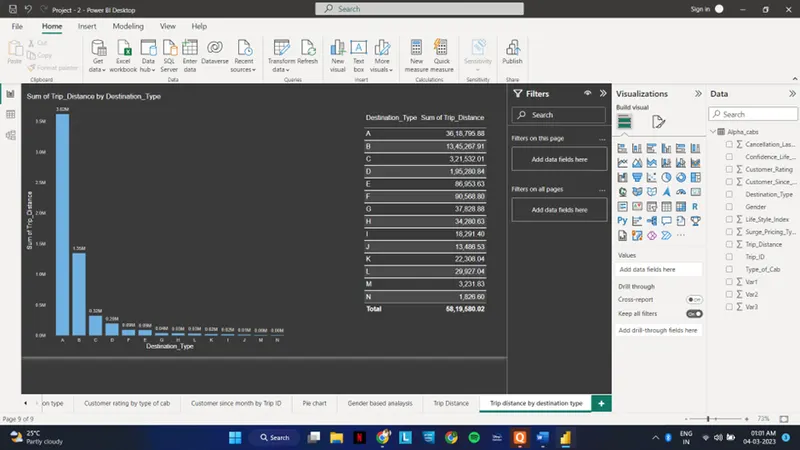
The highest trip distance covered by the destination type is “A” with 3.62M distance.
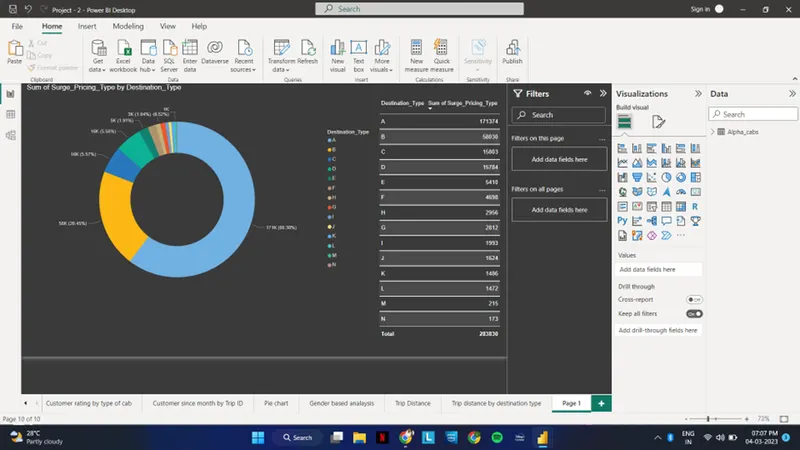
The Destination type “A” has the highest surge price compared to others.
Insights:
On checking with the reports while doing the analysis we got the following insights:
Regarding cancellation in last 1 month :
In type of cab “E” has the lowest cancellation in last 1 month and we need to focus more on type “A” to reduce the cancellation.
In Destination type “M” has the lowest cancellation in last 1 month and we need to focus more on destination type “A” to reduce cancellation.
Regarding Customer Rating:
We see that “Male” has the highest customer rating than female when we consider 5 rating.
When considering 5 rating we see that the destination type A has the highest 5 rating.
When considering 5 rating we see that the type of cab A has the highest 5 rating.
Regarding Customer since months:
We analysed with trip ID and counted the customers since month based on each month and we see that there are 42.68K customer since 10 months.
Regarding the Trip Distance:
We see that Type of cab “B” has made the highest trip distance and in gender “Male” has made the highest trip distance and in destination type “A” has made the highest trip distance.
Recommendations:
- We can collect a large dataset for analysis.
- We can analyse the data of the trip destination and which destination has the highest in specific so we can improve providing cabs to that specific place and we can reduce number of cabs in least destination.
- We can analyse the data with the proper format
Conclusion:
In Conclusion, we can conclude that when it comes to gender Male has the more impact in using cabs to travel so we should provide some attractive offers to retain the customer and if any issue had happened with there travel or booking experience we should fix it and likewise for female we should promote about the safety of the female and we should get there trust to travel with us even when they are alone so we can be the best cab services in the city which the customers prefers.
Note: Since there is no work email id, cannot publish and create a whole dashboard with all the seperate reports shown above for reference.