Project 2 - Supply and Demand Gap Analysis
Aim:
HR report is an analytical method used to display human resources-related stats, insights, and metrics with the primary purpose of improving workforce performance, recruiting procedures, and other relevant HR processes with the help of HR dashboards Human Resource (HR) analytics is an integrated approach to improvise the decision-making capability to achieve organizational goals
Introduction:
The main motto of Human Resource analytics is to identify skilled individuals strive significantly for of who the return investment for the organization by considering several factors which a better understanding of helps predictive analysis. The employee is individual churn by deemed a significant problem for many organizations. It is one of the crucial problems to identify because it affects sustainability and also the organization‟ s planning and enhancing work culture harmony. HR report is an analytical method used to display human resources-related status, insights, and metrics with the primary purpose of improving workforce performance, recruiting procedures, and other relevant HR processes with the help of HR dashboards.
Problem statement:
- Now is the time for promotions for everybody who has received one in the past 10 years or more
- Let's assess which employees should be laid off if the organisation needs to do so for a variety of reasons.
Methodology:
The seven stages of HR data collection and analysis. 1, Perform the HR function. 2, Desire to make a difference. 3, Organize how you collect HR data.4, Understand the data. 5, Take action. 6, Analyze and compare. 7, Earn recognition. descriptive, diagnostic, predictive and prescriptive. Descriptive
analytics. Descriptive (also known as observation and reporting) is the most basic level of analytics. Diagnostic analytics. Predictive analytics. Prescriptive analytics.
Tool Design:
Dashboard designed and developed base on Hr base line data , view are Overall, geographically, age, expertise wise and joiner and leaver etc.
Database:
HR data Visualization using Microsoft Power BI toll . Analyze the large amount dataset using Ms Excel.
Pre-Processing:
The First Step collected HR data The Dataset For This Power BI Project, We ‟ll Use the "https://drive.google.com/file/d/1h4bvZlHJUFAYJ5CbleAmLr6muAX1Q7rm/view" dataset.
Also, we use the following Power BI functionality:
Import Function
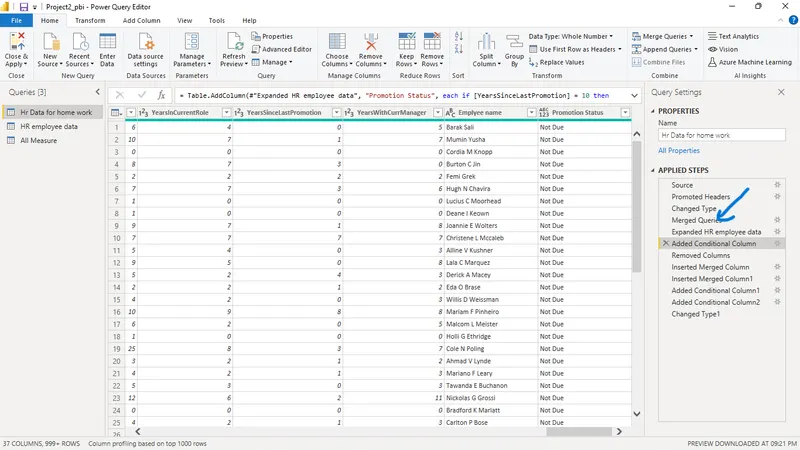
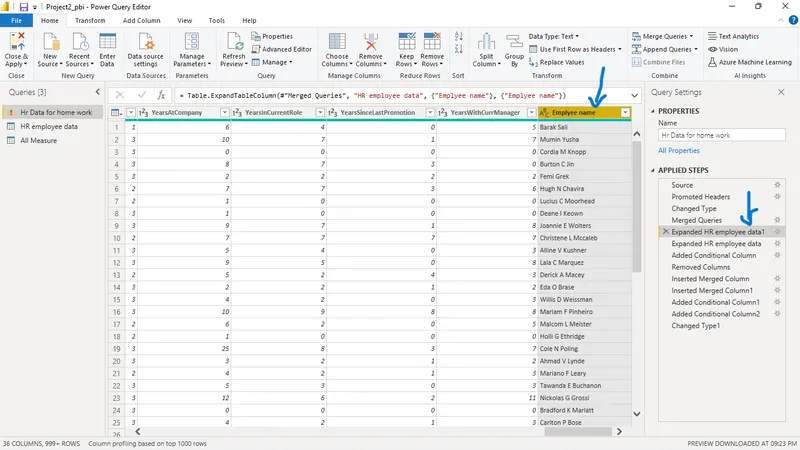
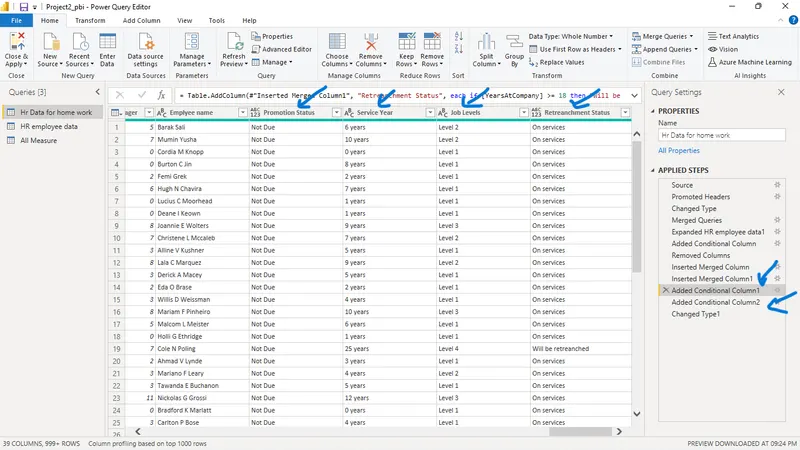
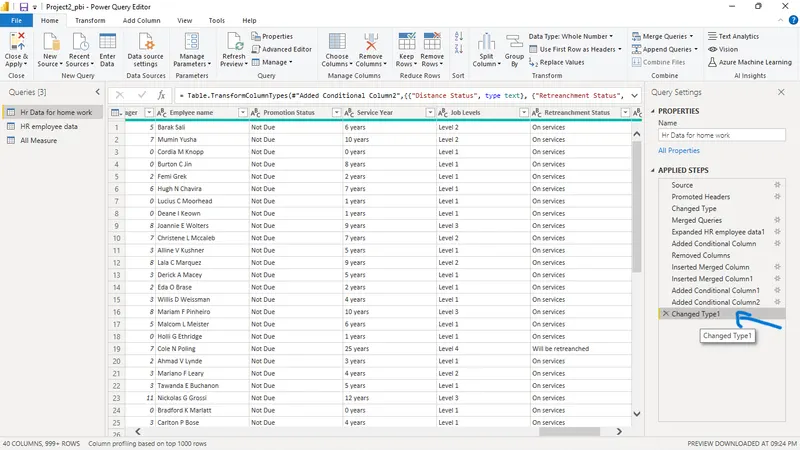
Power Query
DAX
Visualization charts
Import Data
Data import from the folder excel File and load in to Power BI
Power Query:
Power Query is the data connectivity and data preparation technology that enables end users to seamlessly import and reshape data from within a wide range of Microsoft products, including Excel, Power BI, Analysis Services, Data verse, and more.
Convert data types – text, numbers, dates
Remove columns, rows, blanks.
Add calculated columns
Aggregate or summarize data.
Find & replace text.
Unpivot data to use for pivot tables
DAX:
DAX stands for Data Analysis Expressions.DAX is a collection of functions ,operators, and constants that can be usedin a formula, or expression, to calculate and return one or more values. Stated more simply, DAX helps you create newinformation from data already in yourmodel.
Used Dax for data calculation;
Time intelligence, Aggregation, Text Filter and Math function
Visualization charts
Visualizations (known as visuals for short) display insights that have been discovered in the data. A Power BI report might have a single page with one visual or it might have pages full of visuals. In the Power BI service, visuals can be pinned from reports to dashboards.
Used visualizations:
Bar chart, column chart and donut chart
image
icons
Cards
Analysis:
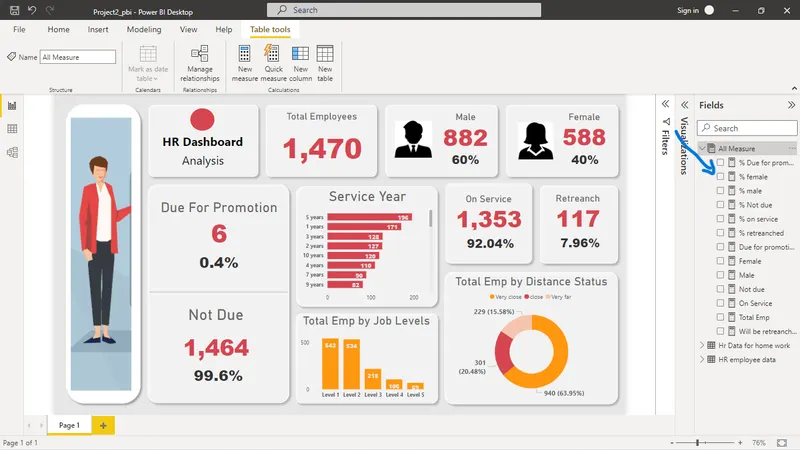
Insights:
The employee metrics dashboard combines several factors that influence the employees’ performance, which directly impacts the business performance in the competitive market. You can use Power BI to create multiple dashboards focused on individual factors to derive insights and predictions.
- Employees Due for promotion
- Employees Not due for promotion
- Total employees in a services year
- Employees on service and retrench
- Employees by distance status
Recommendation:
- Develop an effective training program
- Provide more regular feedback to employees
Conclusions:
HR analytics enables strategic decision-making that can drive business solutions by improving productivity. In this research paper, the model shows the real-time human resource processes, gathering related data and then using this data to make informed decisions to manage employees and reach business goals.