Project 2 - Supply and Demand Gap Analysis
Exploratory Data Analysis on Netflix Movies and TV Shows
Aim
This project aims to analyse and visualize the latest Trend in the “Netflix Movies and TV Shows”.
Introduction
Netflix, Inc. is an American subscription streaming service and production company based in Los Gatos, California. Founded on August 29, 1997 by Reed Hastings and Marc Randolph in Scott’s Valley, California, it offers a film and television series library through distribution deals as well as its own productions, known as Netflix Originals.
As of June 30, 2022, Netflix had 220.7 million subscribers worldwide, including 73.3 million in the United States and Canada, 73.0 million in Europe, the Middle East and Africa, 39.6 million in Latin America and 34.8 million in the Asia-Pacific region. It is available worldwide aside from Mainland China, Syria, North Korea, and Russia. Netflix has played a prominent role in independent film distribution, and it is a member of the Motion Picture Association (MPA).
Problem Statement
- Tracking the progress of the details of playlist in the Netflix.
- To Check whether the dataset is mostly aligned for mature audiences or parental guideline attached with the rating which is not kids friendly.
- How many of the tv shows present in the dataset could last more than 2-4 seasons.
- The old Tv shows and Movies viewed the most or the recent ones are more viewed. Comparison of outcome of Tv shows and Movies in the recent year
Methodology
Step 1: Data Cleaning
The data cleaning is nothing but preparing the right or perfect data for the Visualization which helps in the better understanding of dataset. Data cleaning includes the following steps they are: -
- Transform Data (Power Query in Action)
- Data Formatting (Check on Column Headers & Names)
- Import Data from Excel
- Set First Row as Header
- Replace Values
Step 2: Data Interpretation
The Data Interpretation is also known as creating a Report. Some of the important information about the data set are.
- The Dataset was almost clear and completed.
- Assembling the information, you need (like bar graphs and pie charts)
- I replaced the null values with 0.
- There is a total of 86513 Rows and 15 Columns.
Benefits of Data Interpretation
- Informed decision-making.
- Anticipating needs and identifying trends.
- Clear foresight.
Step 3: Visualization
Visualizations are used to effectively present your data and are the basic building blocks of any Business Intelligence tool. Power BI contains various default data visualization components that include simple bar charts to pie charts to maps, and also complex models such as waterfalls, funnels, gauges, and many other components. I have used the above-mentioned components to visualize the given dataset.
Visualization includes following steps: -
- Ø Identify messages of the visualization, and generate the most informative indicator.
- Ø Choose the right chart type.
- Ø Use colour, size, scale, shapes and labels to direct attention to the key messages.
Explaining Dataset
This data set was created to list all shows available on Netflix streaming, and analyse the data to find interesting facts. This data was acquired in July 2022 containing data available in the United States. This dataset has two files containing the titles (titles.csv) and the cast (credits.csv) for the title.
This dataset contains +5k unique titles on Netflix with 15 columns containing their information, including:
- id: The title ID on Just Watch.
- title: The name of the title.
- show_type: TV show or movie.
- description: A brief description.
- release_year: The release year.
- age_certification: The age certification.
- runtime: The length of the episode (SHOW) or movie.
- genres: A list of genres.
- production_countries: A list of countries that produced the title.
- seasons: Number of seasons if it's a SHOW.
- imdb_id: The title ID on IMDB.
- imdb_score: Score on IMDB.
- imdb_votes: Votes on IMDB.
- tmdb_popularity: Popularity on TMDB.
- tmdb_score: Score on TMDB.
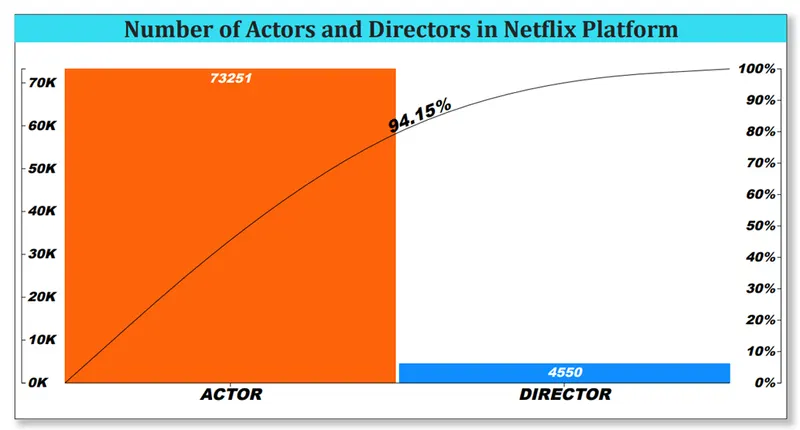
And over +77k credits of actors and directors on Netflix titles with 5 columns containing their information, including:
- person_ID: The person ID on Just Watch.
- id:The title ID on Just Watch.
- name: The actor or director's name.
- character name: The character name.
- role: ACTOR or DIRECTOR.
DATA VISUALIZATION
Top 10 Countries in Production of Shows and Movies
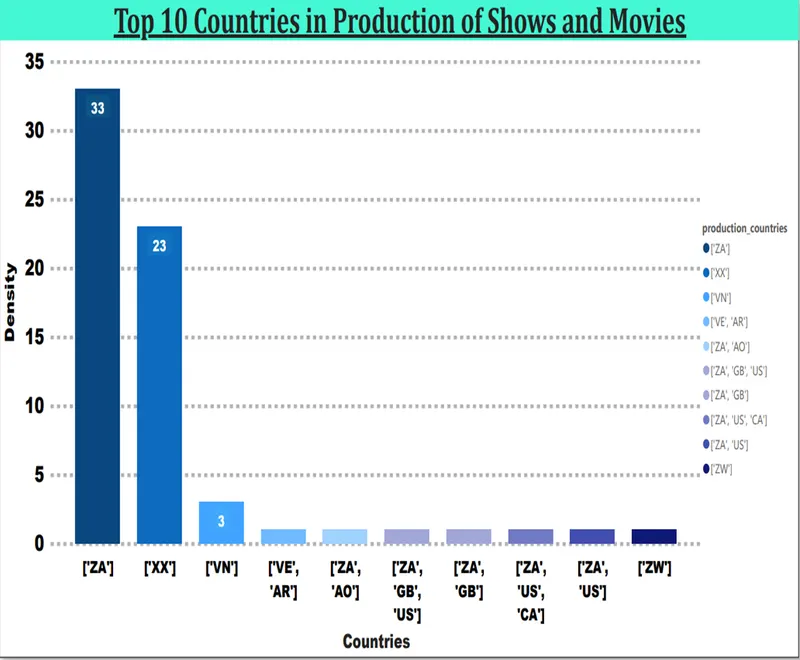
- Count of production countries was highest for ['ZA'] at 33, followed by ['XX'] and ['VN'].['ZA'] accounted for 00% of Count of production countries.
- Across all 10 production countries, count of production countries ranged from 1 to 33.
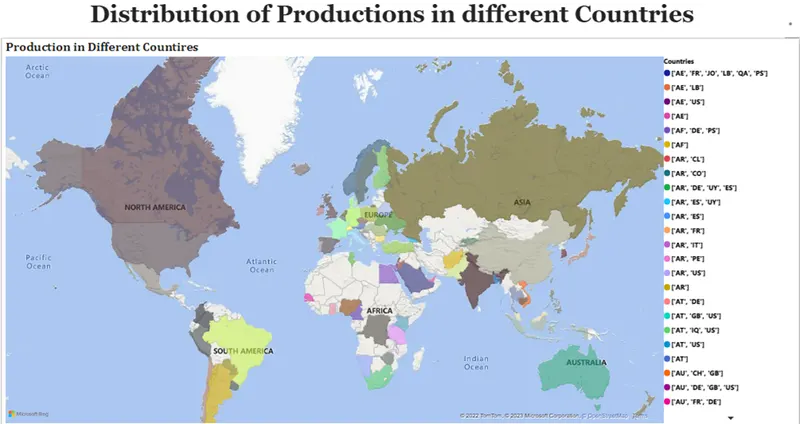
Distribution of Productions in different Countries
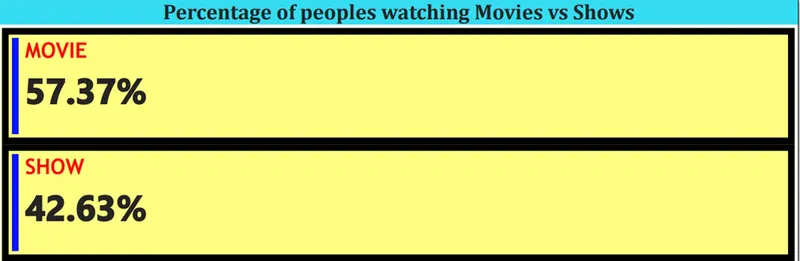
Percentage of peoples watching Movies vs Shows
Distribution of Release_year, Runtime, Imdb_score, Imdb_votes, Tmdb_Scores and Tmdb_Popularity
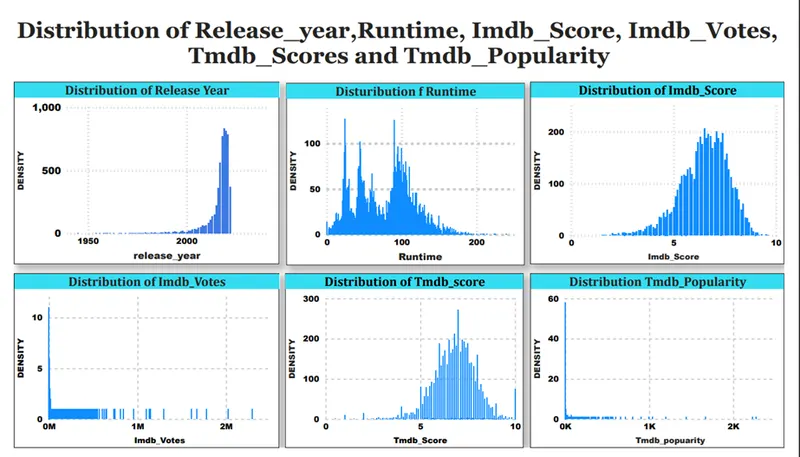
Plot-1: Count of release year was highest for 2019 at 836, followed by 2020 and 2021.
- 2019 accounted for 29% of Count of release year.
- Across all 63-release year, count of release year ranged from 1 to 836.
Plot-2: Count of runtime was highest for 24 at 127, followed by 90 and 44.
- 24 accounted for 17% of Count of runtime.
- Across all 202 runtimes, count of runtime ranged from 1 to 127.
Plot-3: Count of imdb_score was highest for 6.50 at 206, followed by 7.10 and 7.40.
- 50 accounted for 3.84% of Count of imdb_score.
- Across all 80 imdb_score, count of imdb_score ranged from 1 to 206.
Plot-4: 25 and 6 tied for highest Count of imdb_votes at 11, followed by 78.
- Across all 3,880 imdb_votes, count of imdb_votes ranged from 1 to 11.
Plot-5: Count of tmdb_score was highest for 7 at 272, followed by 6.80 and 7.20.
- 7 accounted for 91% of Count of tmdb_score.
- Across all 394 tmdb_score, count of tmdb_score ranged from 1 to 272.
Plot-6: Count of tmdb_popularity was highest for 0.60 at 58, followed by 1.40 and 1.96.
- 60 accounted for 1.01% of Count of tmdb_popularity.
- Across all 4,889 tmdb_popularity, count of tmdb_popularity ranged from 1 to 58.
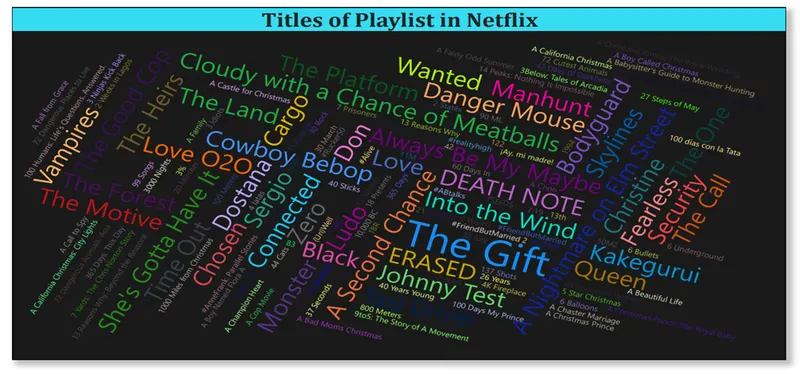
Titles of Playlist in Netflix
Top 10 popular Genres watched in Netflix Movies & Shows
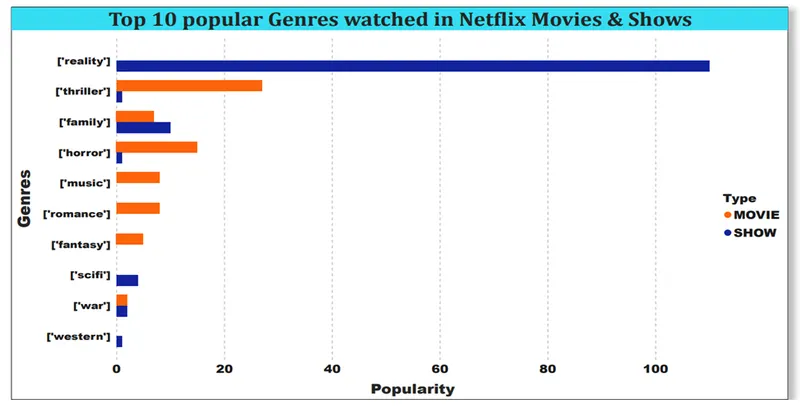
- Total Count of tmdb_popularity was higher for SHOW (129) than MOVIE (72).
- 'reality' in type made up 73% of Count of tmdb_popularity.
- Average Count of tmdb_popularity was higher for SHOW (43) than MOVIE (10.29).
- Count of tmdb_popularity for MOVIE and SHOW diverged the most when the genres was ['thriller'], when MOVIE were 26 higher than SHOW.
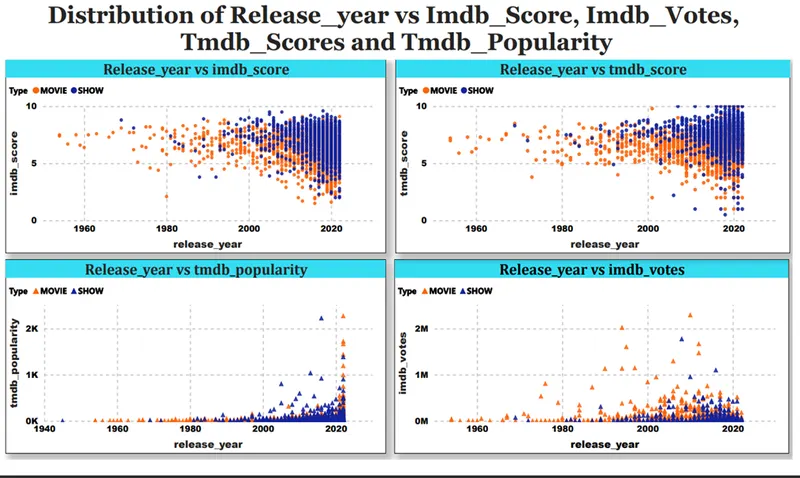
Distribution of Release_year vs Imdb_Score, Imdb_Votes, Tmdb_Scores and Tmdb_Popularity
Number of Actors and Directors in Netflix Platform
Distribution of Age certification vs Popularity
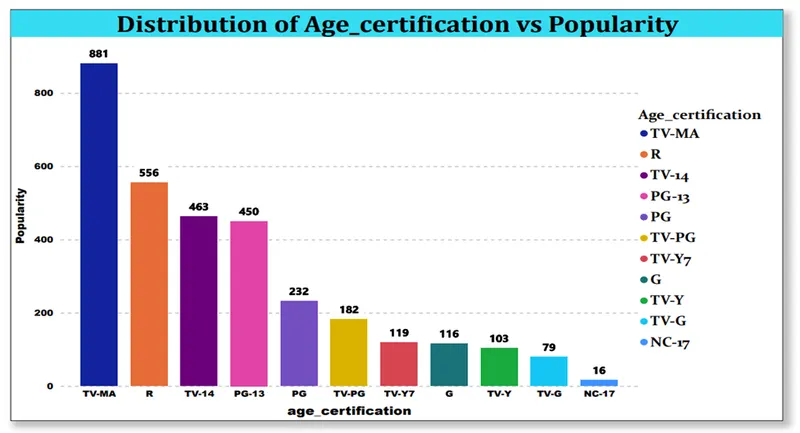
- At 881, TV-MA had the highest Count of tmdb_popularity and was 5,406.25% higher than NC-17, which had the lowest Count of tmdb_popularity at 16.
- TV-MA accounted for 56% of Count of tmdb_popularity.
- Across all 11-age certification, count of tmdb_popularity ranged from 16 to 881.
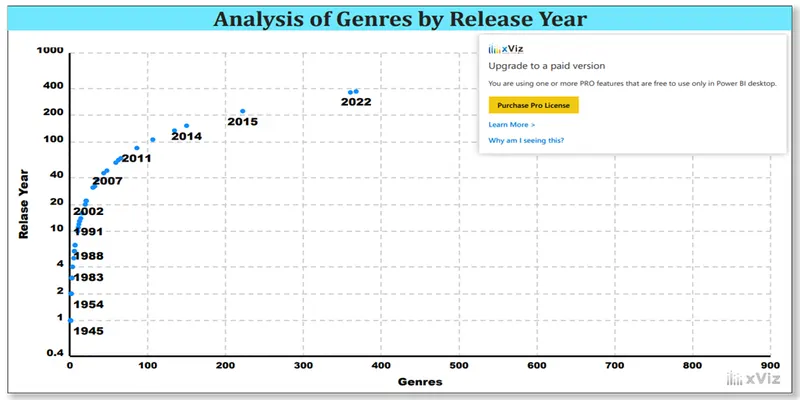
Analysis of Genres by Release Year
Analysis of production of countries by release year and type
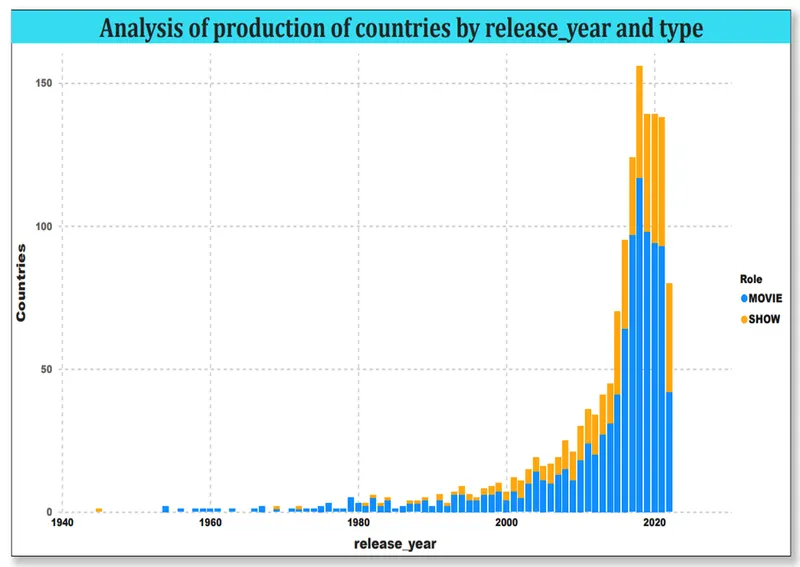
- 2018 in type made up 23% of Count of production countries.
- Average Count of production countries was higher for MOVIE (65) than SHOW (10.74).
- Count of production countries for MOVIE and SHOW diverged the most when the release year was 2018, when MOVIE was 78 higher than SHOW.
Top 10 Genres by Imdb_Score
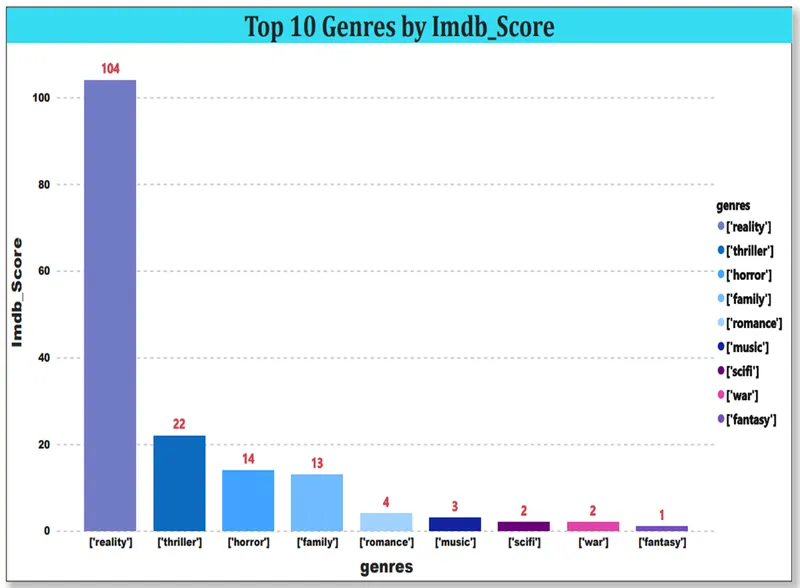
- At 104, ['reality'] had the highest Count of imdb_score and was 10,300.00% higher than ['fantasy'], which had the lowest Count of imdb_score at 1.
- ['reality'] had the highest Count of imdb_score at 104, followed by ['thriller'] and ['horror'].
- ['fantasy'] had the lowest Count of imdb_score at 1.
- ['reality'] accounted for 03% of Count of imdb_score.Across all 9 genres, count of imdb_score ranged from 1 to 104.
Trend of Movies and Tv Shows in Recent Years
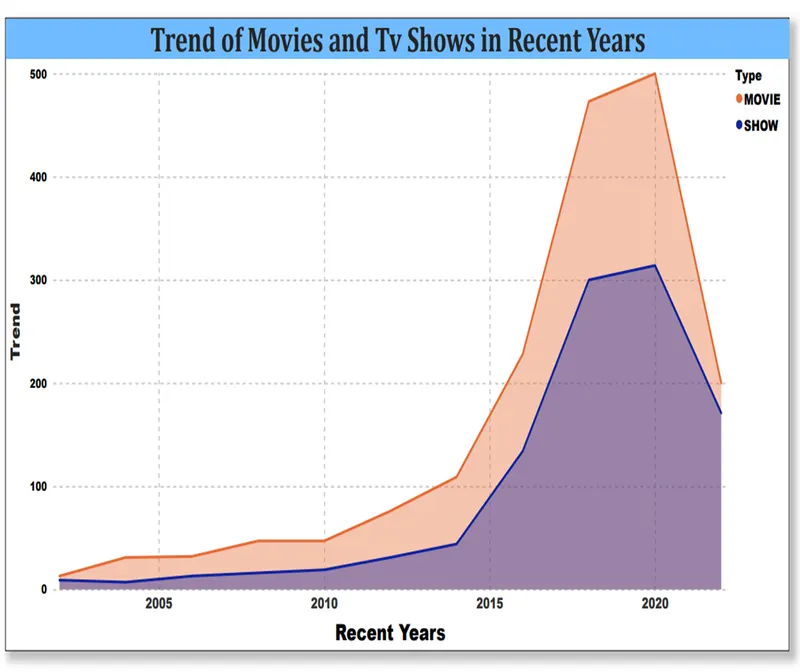
- Total Count of release_year was higher for MOVIE (1,756) than SHOW (1058).2020 in type made up 77% of Count of release_year.
- Average Count of release_year was higher for MOVIE (64) than SHOW (96.18).
- Count of release_year for MOVIE and SHOW diverged the most when the release_year was 2020, when MOVIE was 186 higher than SHOW.
Analysis of number of seasons released
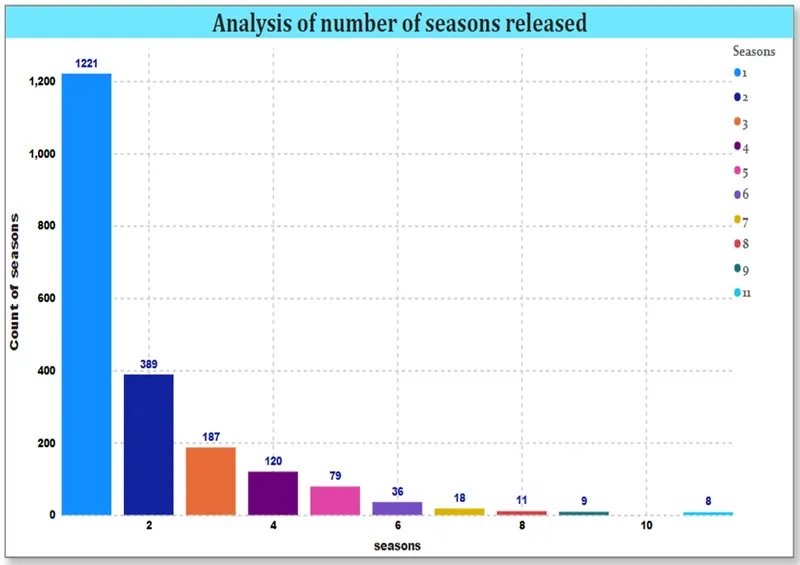
- At 1,221, 1 had the highest Count of seasons and was 15,162.50% higher than 11, which had the lowest Count of seasons at 8.
- 1 accounted for 76% of Count of seasons.
- Across all 10 seasons, count of seasons ranged from 8 to 1,221.
- The plot tells us that most of the series shut down after 1 season. Hence as the number of seasons increases very few shows are able to sustain. This could be due to issue in popularity or end of story line.
Dashboard
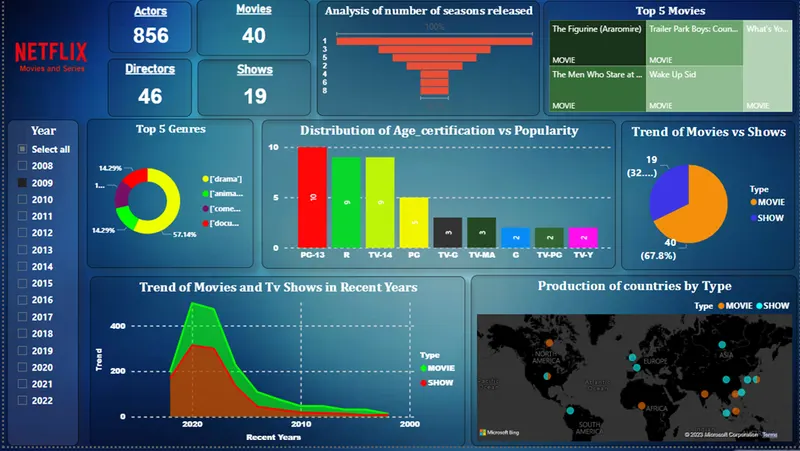
Conclusions: -
After performing Exploratory Data Analysis on this dataset, I have come to following conclusions:
- Most of the movies or shows present in the dataset are of recent times. Hence strata of old tv shows and movies are present in less quantity. IMDB Score as well as TMDB score also favours recent movies and shows
- The dataset is mostly aligned for mature audiences and mostly have parental guideline attached with the or any rating that is not kids friendly.
- Most of the tv shows present in the dataset could not last more than 2-4 seasons.
- Shows having less runtime have higher score as compared to longer shows. This is explainable that most people would prefer watching a 30 min comedy show as compared to 2 hours documentary show. Movies having less or moderate runtime is also preferred by the audience.