Project 2 - Rankine cycle Simulator
close all
clear all
clc
% variables for stage1
p1 = 30;
t1 = 400;
h1 = XSteam('h_pT',30,400);
s1 = XSteam('s_ph',30,h1);
% variables for stage2
p2 = 0.05;
s2 = s1;
t2 = XSteam('T_ps',0.05,6.1858);
sf2 = XSteam('sL_p',p2);
sg2 = XSteam('sV_p',p2);
hf2 = XSteam('hL_p',p2);
hg2 = XSteam('hV_p',p2);
x = ((s2 - sf2)/(sg2 - sf2));
h2 = hf2 + (x*(hg2 - hf2));
v2 = XSteam('v_ph',p2,h2);
% variables for stage3
t3 = t2;
p3 = p2;
s3 = XSteam('sL_p',p3);
h3 = XSteam('hL_T',32.875);
v3 = XSteam('v_ph',p3,h3);
fprintf('\n\n At state point 3')
fprintf('\n P3 is:%f bar',p3)
fprintf('\n T3 is:%f deg celcius',t3)
fprintf('\n H3 is:%f KJ/Kg',h3)
fprintf('\n S3 is:%f KJ/KgK',s3)
% variables for stage4
s4 = s3;
v4 = v3;
p4 = p1;
h4 = XSteam('h_ps',p4,s4);
t4 = XSteam('T_hs',h4,s4);
% variables for stage6
p5 = p4;
t5 = XSteam('Tsat_p',p5);
h5 = XSteam('hL_T',t5);
s5 = XSteam('sL_p',p5);
% variables for stage6
t6 = t5;
p6 = XSteam('psat_T',t5);
s6 = XSteam('sV_T',t6);
h6 = XSteam('hV_T',t6);
% loop to find variables on saturation lines
t = linspace(0,400,1000);
for i=1:length(t)
s_line1(i)=XSteam('sL_T',t(i));
end
for j=1:length(t)
s_line2(j)=XSteam('sV_T',t(j));
end
for i=1:length(t)
h_line1(i)=XSteam('hL_T',t(i));
end
for j=1:length(t)
h_line2(j)=XSteam('hV_T',t(j));
end
% net work output calculation
% work done by turbine
w_turbine = h1 - h2;
% work taken by pump
w_pump = h4 - h3;
% net work output
work = w_turbine - w_pump;
% heat addition
q_in = h1 - h4;
% heat rejection
q_out = h2 -h3;
% thermal efficiency
n = work/q_in;
%Back work ratio
BWR = w_pump/w_turbine;
% Specific steam consumption
ssc = 3600/work;
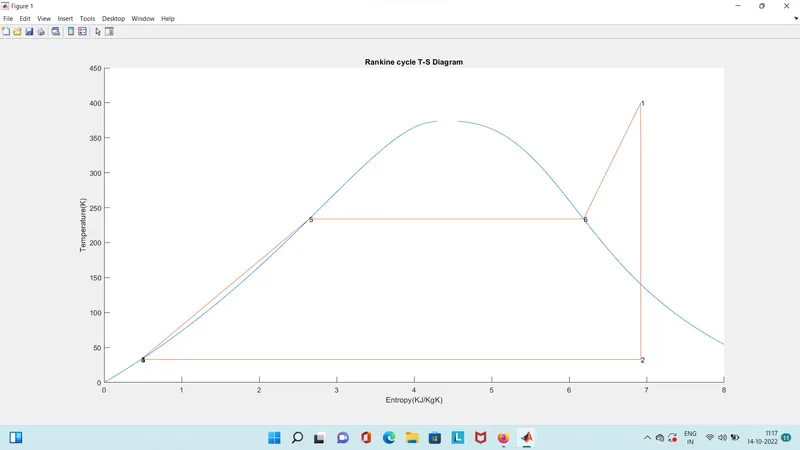
%plotting T-s graph
figure(1)
hold on
plot([s_line1 s_line2],[t t])
plot([s1 s2 s3 s4 s5 s6 s1],[t1 t2 t3 t4 t5 t6 t1])
text(s1,t1,'1')
text(s2,t2,'2')
text(s3,t3,'3')
text(s4,t4,'4')
text(s5,t5,'5')
text(s6,t6,'6')
title("Rankine cycle T-S Diagram")
xlabel('Entropy(KJ/KgK)')
ylabel('Temperature(K)')
axis([0,8,0,450])
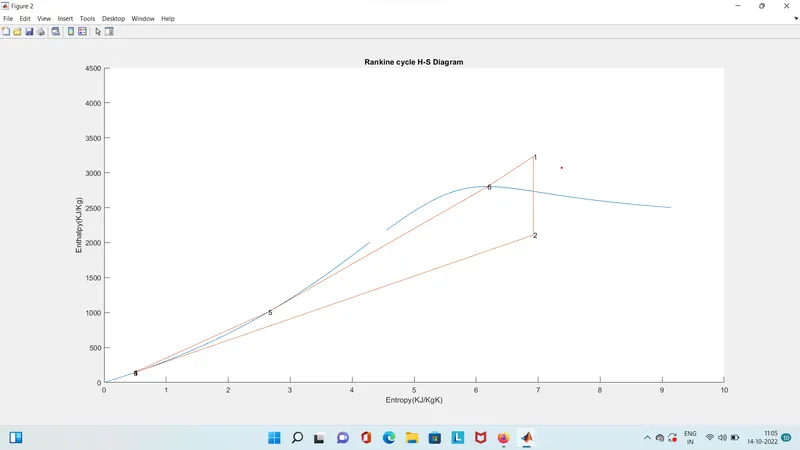
%plotting h-s graph
figure(2)
hold on
plot([s_line1 s_line2],[h_line1 h_line2])
plot([s1 s2 s3 s4 s5 s6 s1],[h1 h2 h3 h4 h5 h6 h1])
text(s1,h1,'1')
text(s2,h2,'2')
text(s3,h3,'3')
text(s4,h4,'4')
text(s5,h5,'5')
text(s6,h6,'6')
title("Rankine cycle H-S Diagram")
xlabel('Entropy(KJ/KgK)')
ylabel('Enthalpy(KJ/Kg)')
axis([0,10,0,4500])
H-S DIAGRAM :-
T-S DIAGRAM:-