Project 2 - Gender Bias in Science and Technical field
This dashboard empowers mission driven organizations to harness the power of data visualization for social change. The data set talks about the literacy rates in Tamilnadu. It is distributed according to the cities and their ranks. It contains the population, as per the gender.
This dashboard gives us the insight about the female population when compared to the total, and it addresses the question of where the state is on literacy wise. It shows us the status of each city and it also shows the scholarship/Beneficiaries each state is getting. The data has different institutions available and the number of teachers available.
General Requirements
The dashboard should look like an article predicting the basic issues. Use appropriate tiled and floating sheets wherever possible.
Business Requirements
Title: Literacy Rate in Tamilnadu
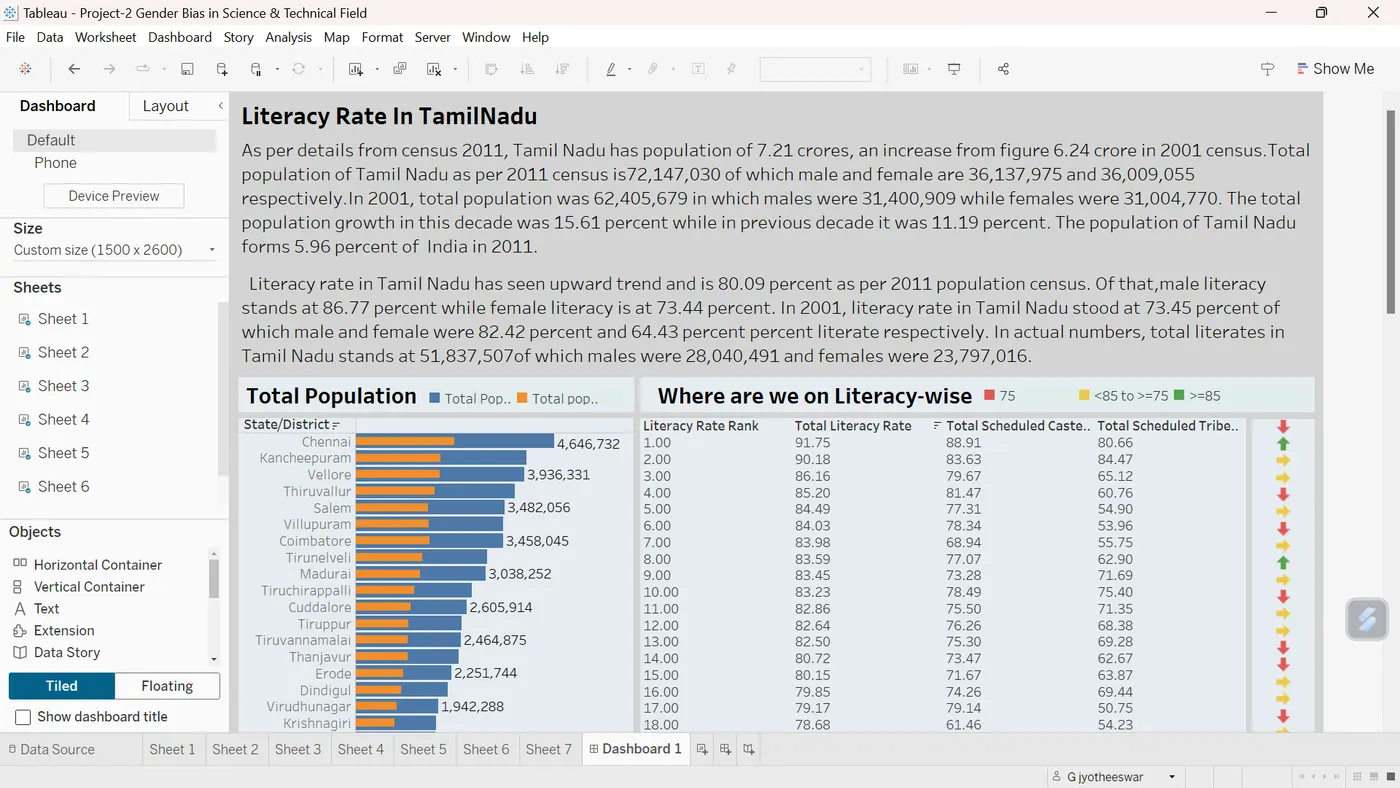
Literacy Rate In TamilNadu
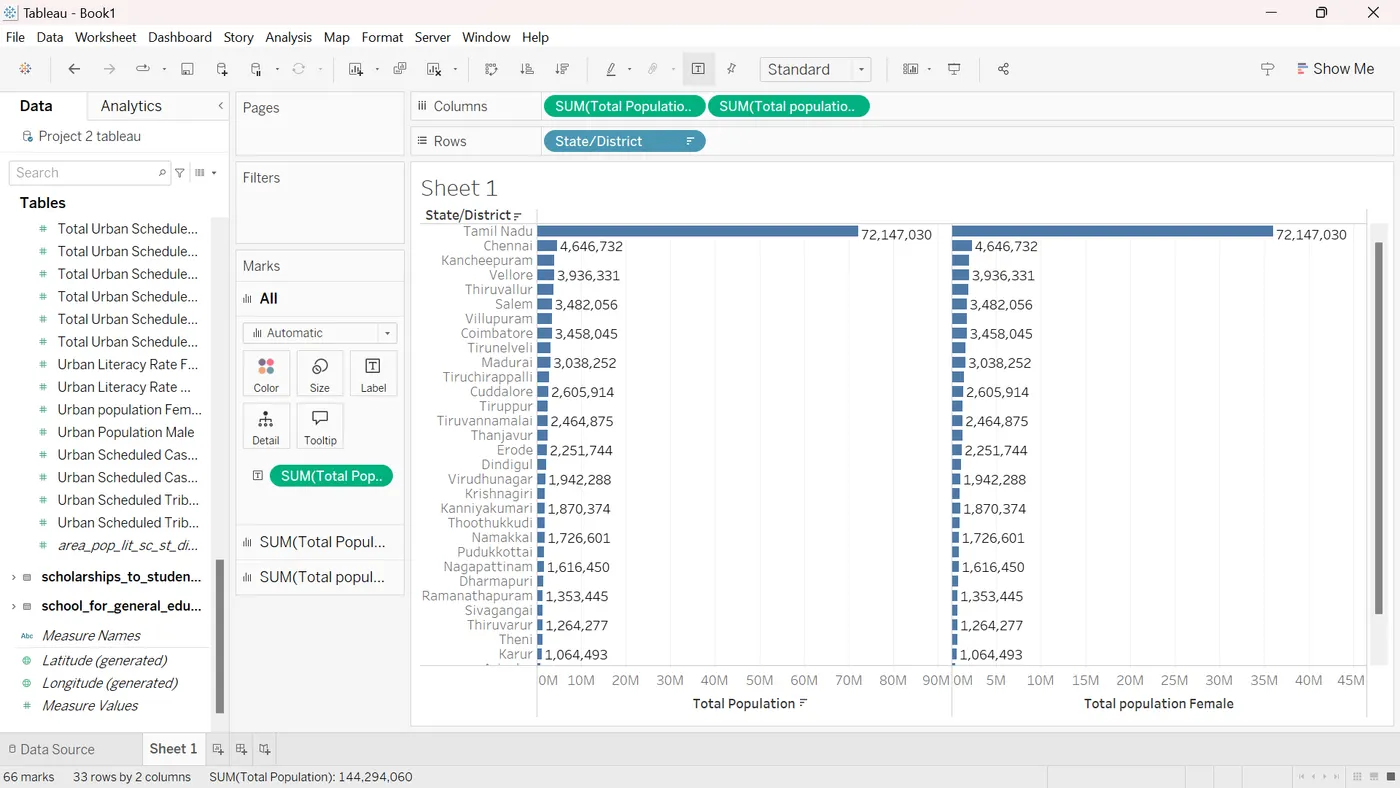
As per details from census 2011, Tamil Nadu has population of 7.21 crores, an increase from figure 6.24 crore in 2001 census. Total population of Tamil Nadu as per 2011 census is72,147,030 of which male and female are 36,137,975 and 36,009,055 respectively. In 2001, total population was 62,405,679 in which males were 31,400,909 while females were 31,004,770. The total population growth in this decade was 15.61 percent while in previous decade it was 11.19 percent. The population of Tamil Nadu forms 5.96 percent of India in 2011.
Literacy rate in Tamil Nadu has seen upward trend and is 80.09 percent as per 2011 population census. Of that, male literacy stands at 86.77 percent while female literacy is at 73.44 percent. In 2001, literacy rate in Tamil Nadu stood at 73.45 percent of which male and female were 82.42 percent and 64.43 percent percent literate respectively. In actual numbers, total literates in Tamil Nadu stands at 51,837,507of which males were 28,040,491 and females were 23,797,016.
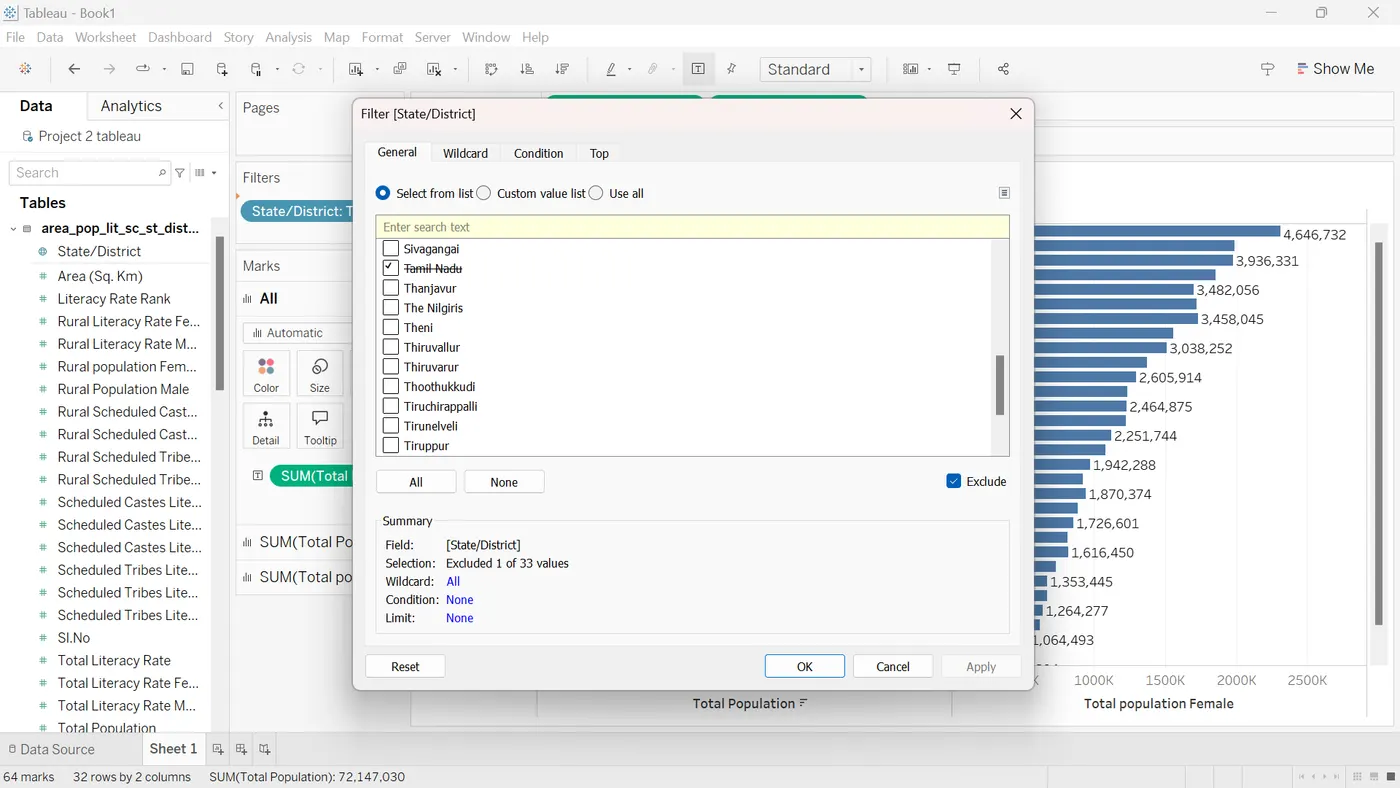
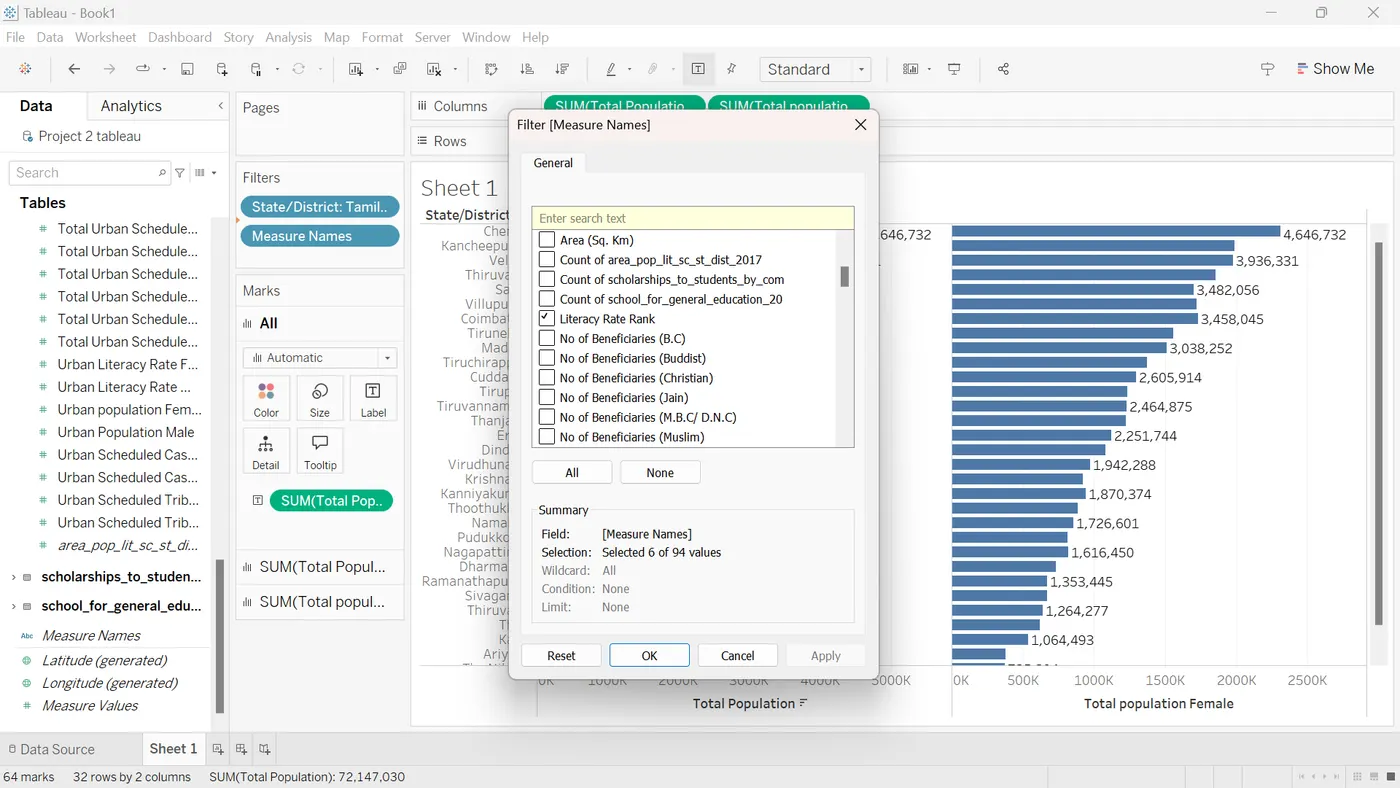
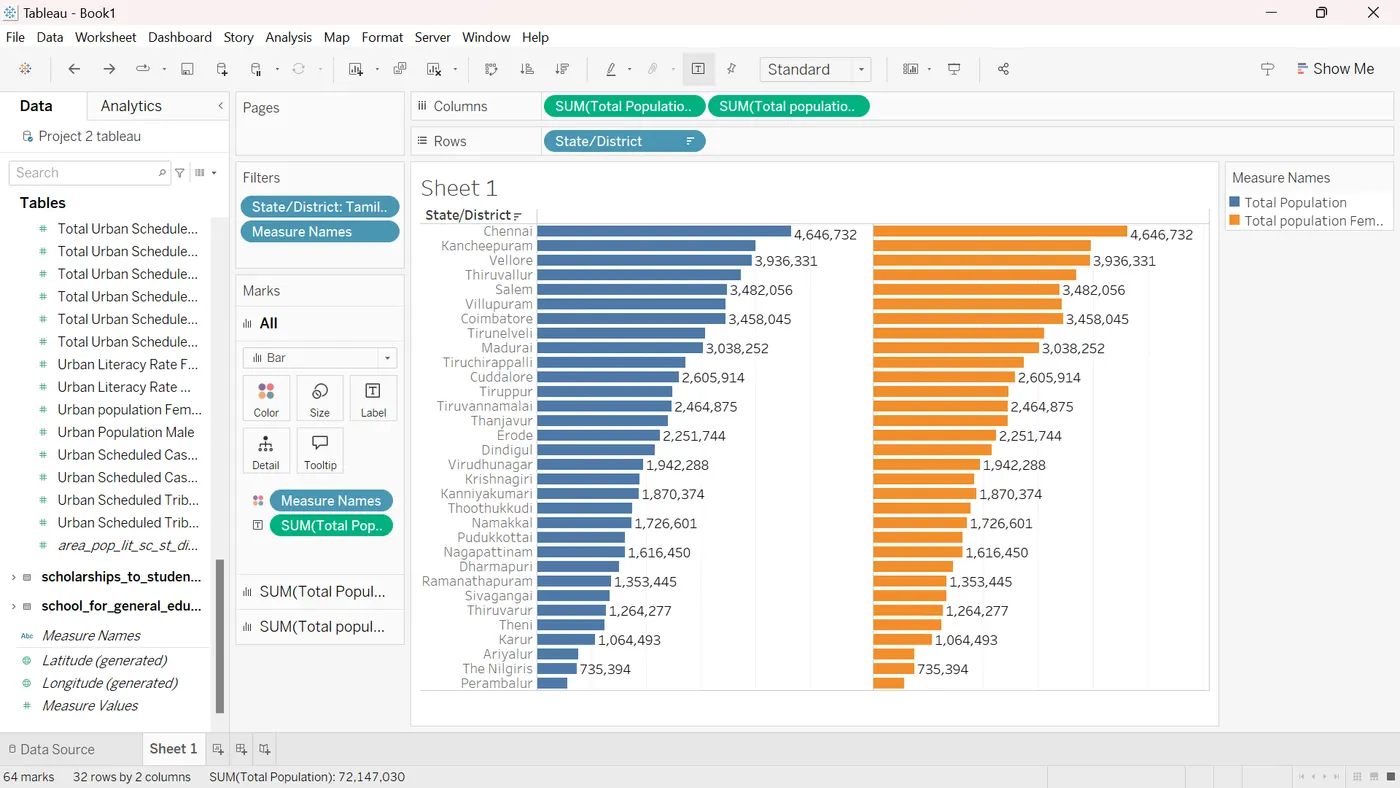
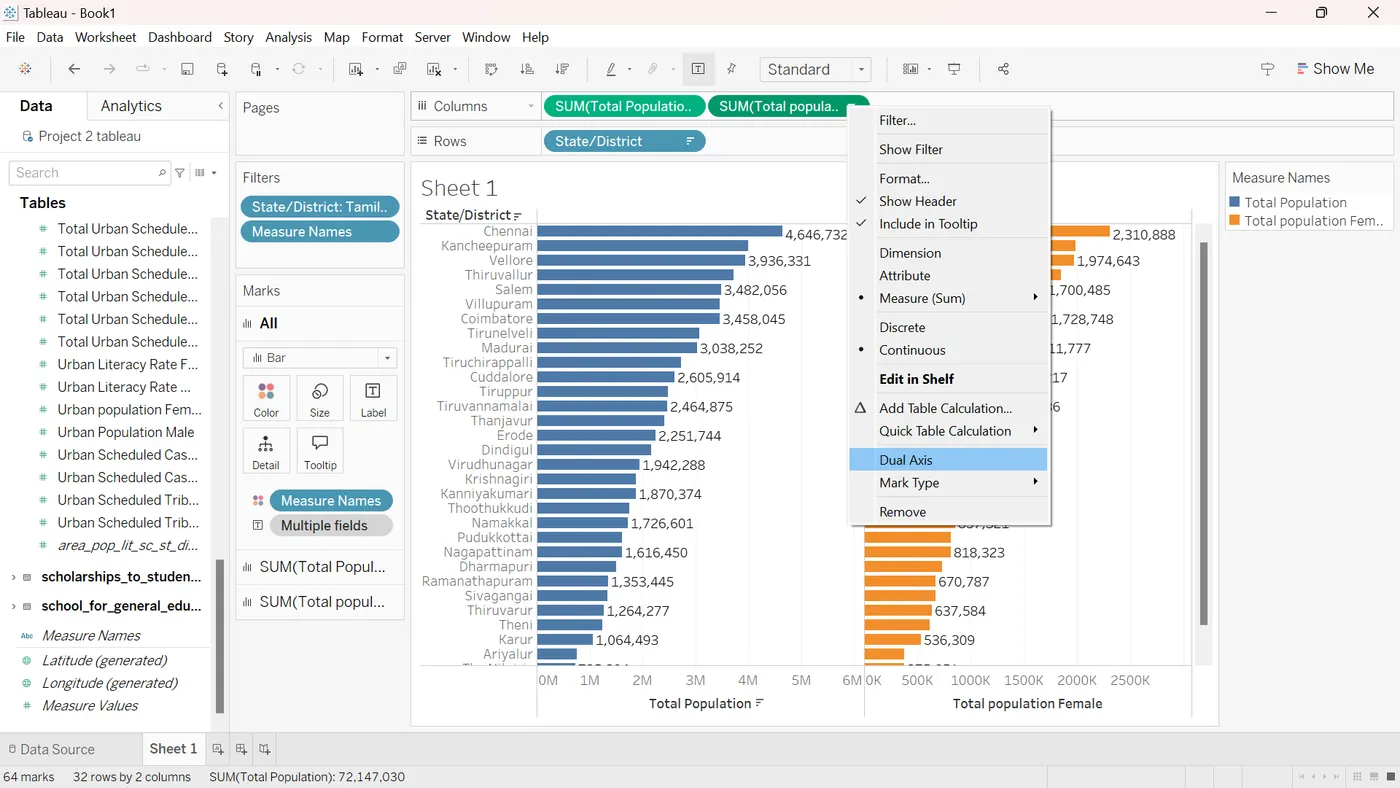
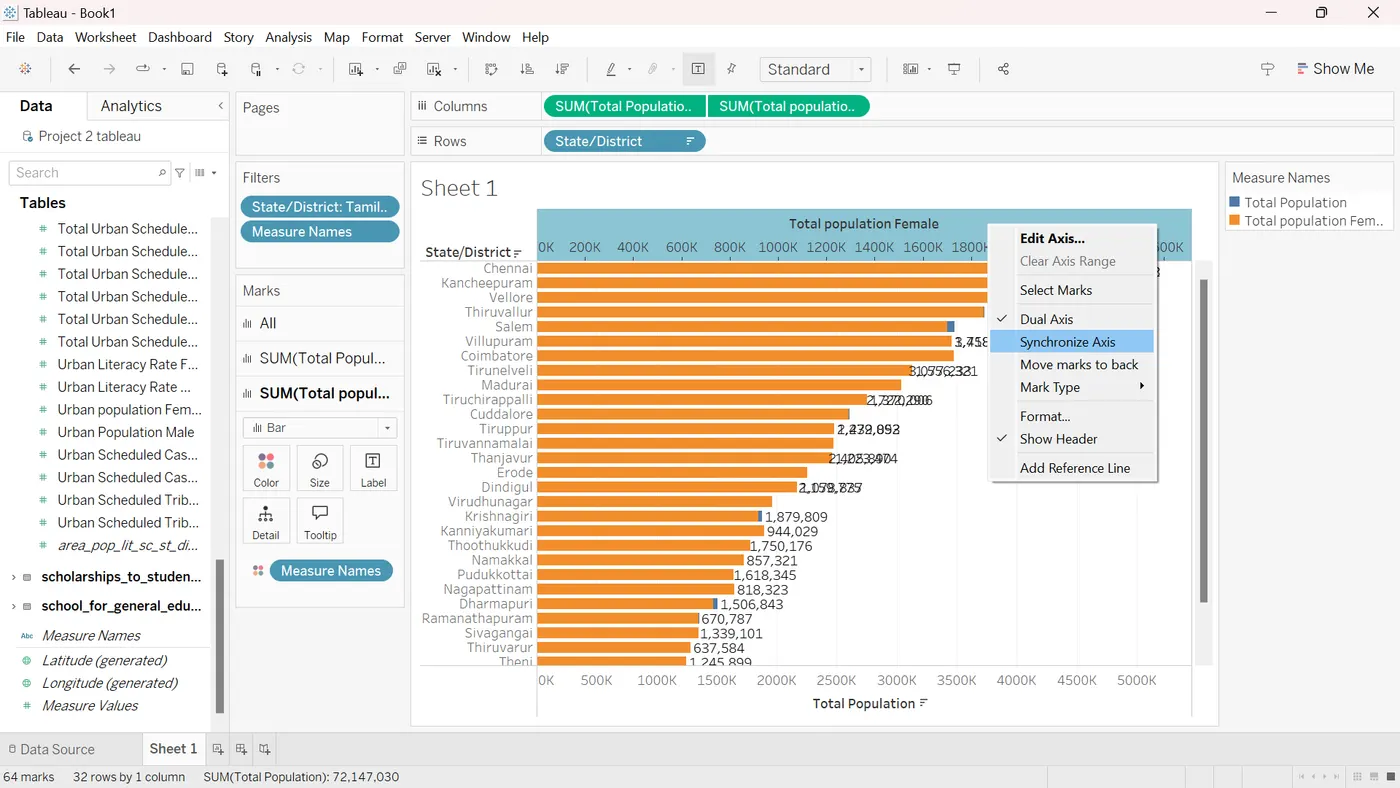
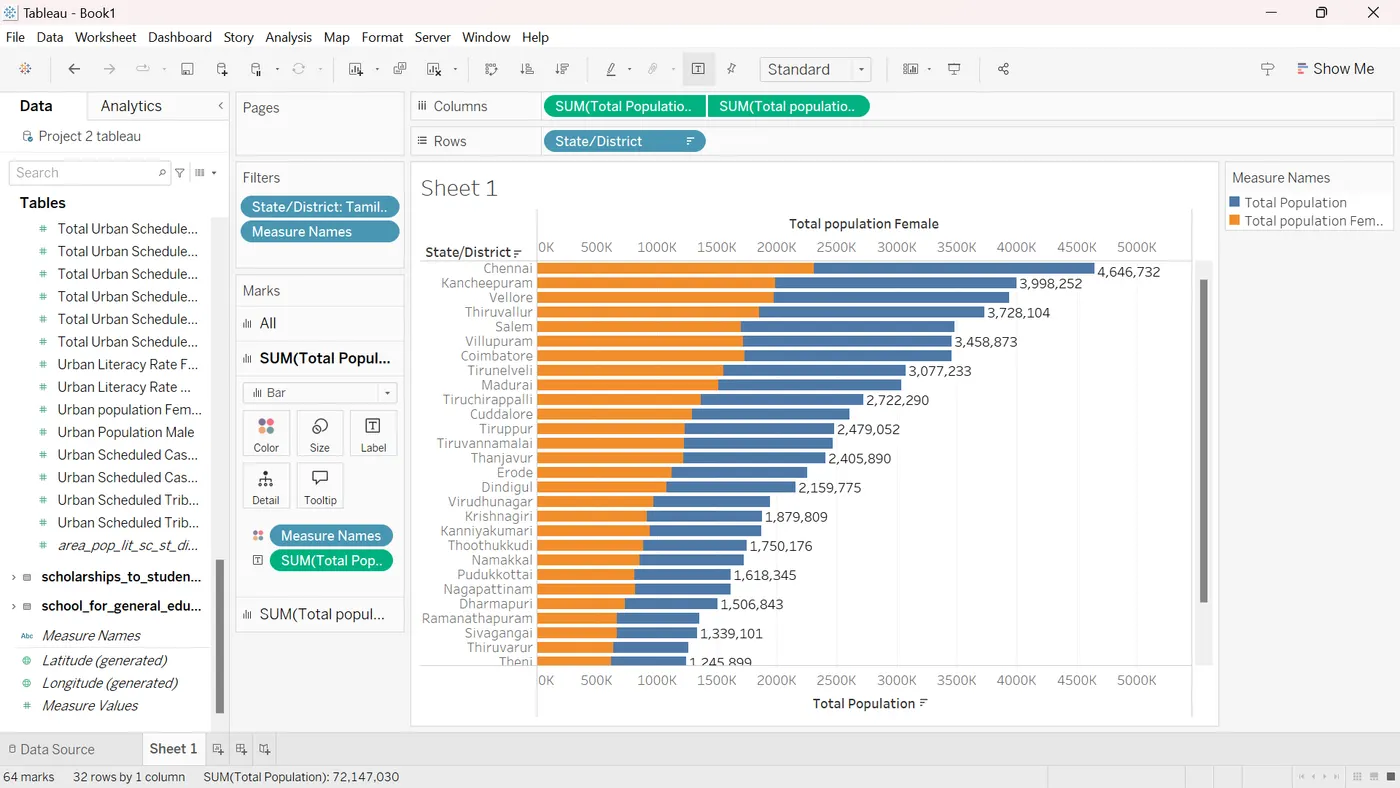
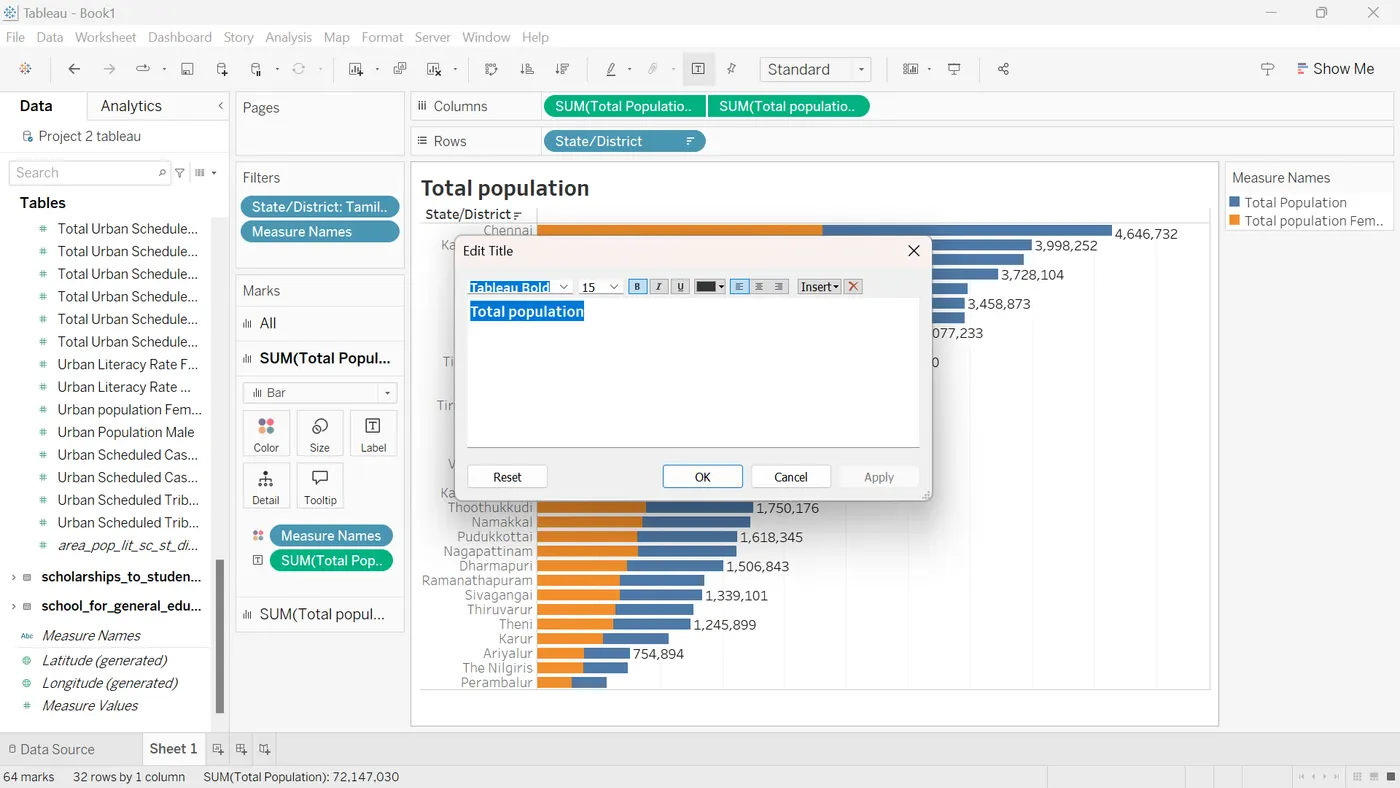
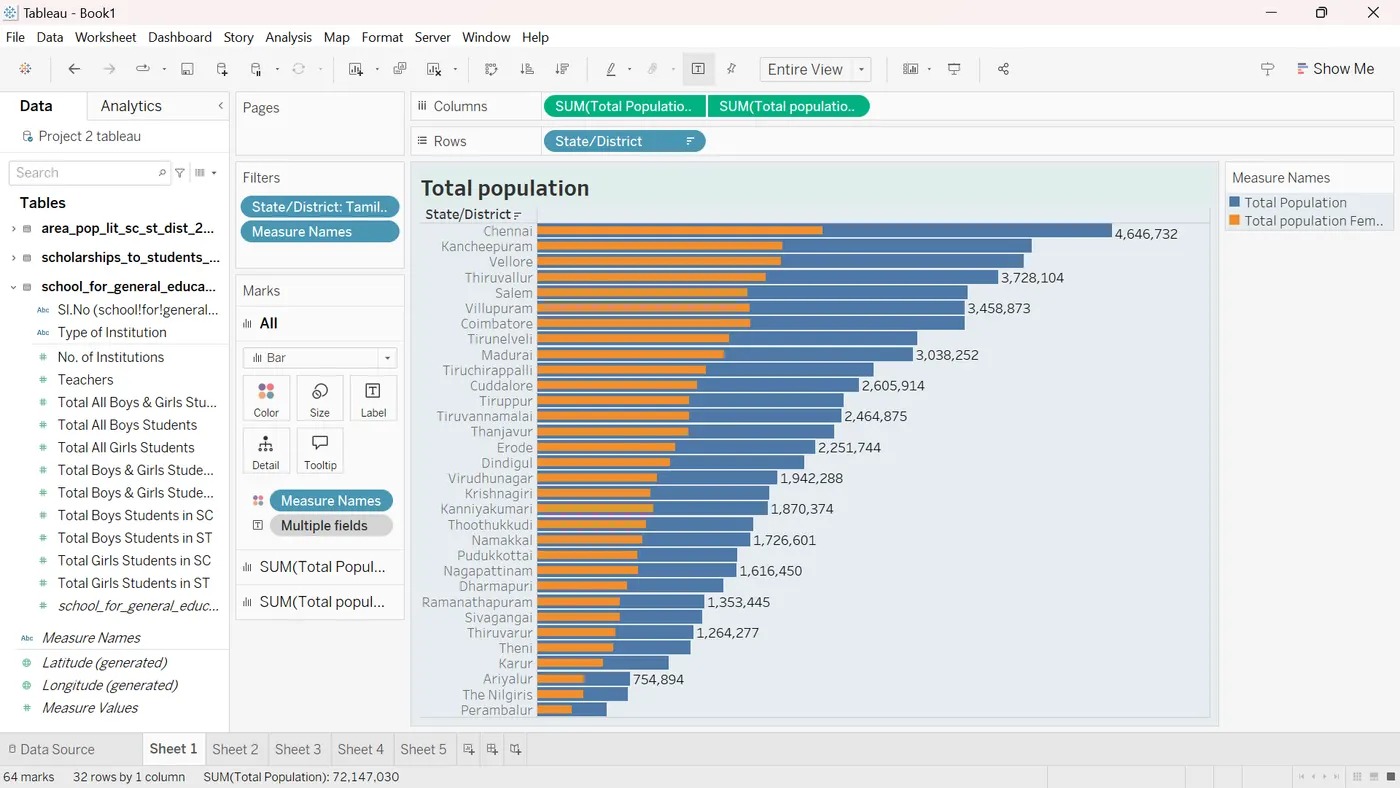
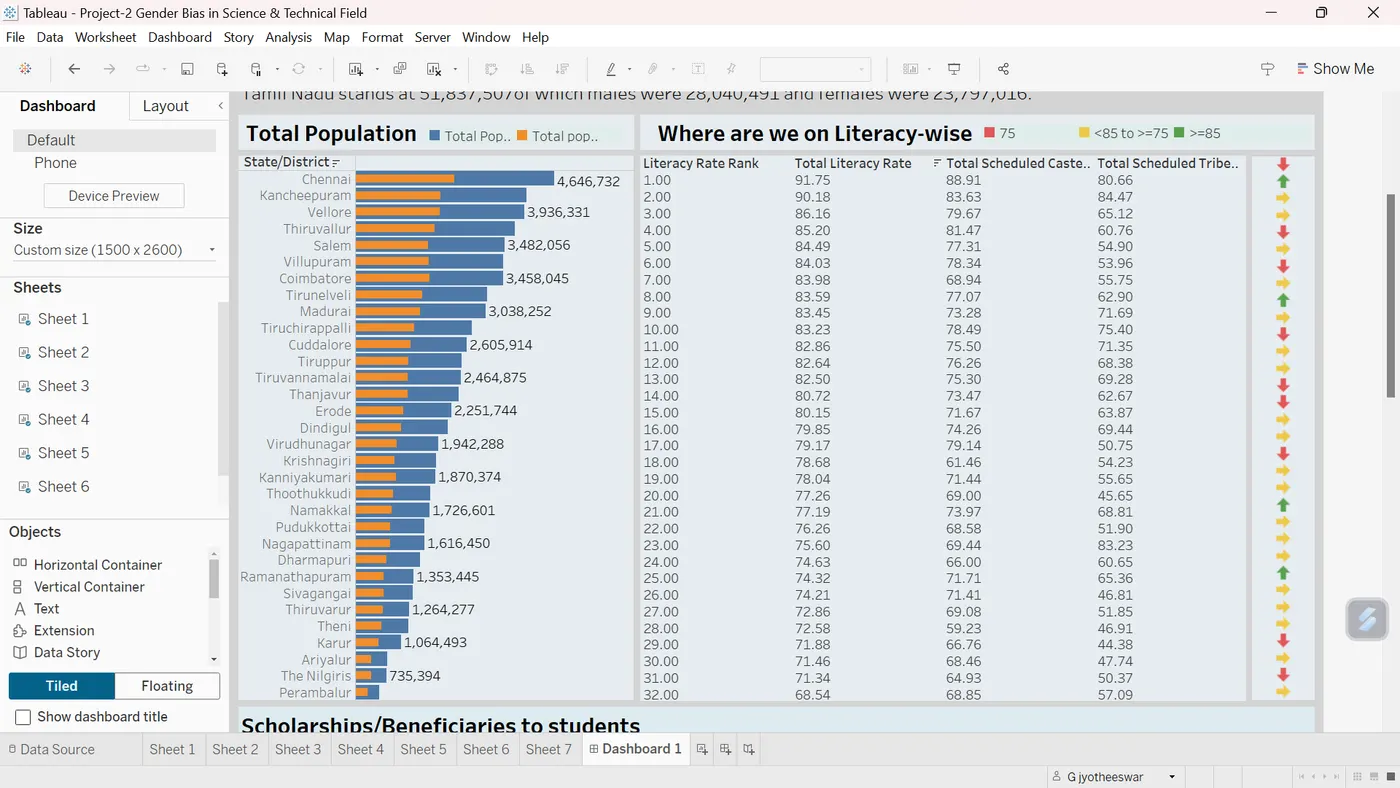
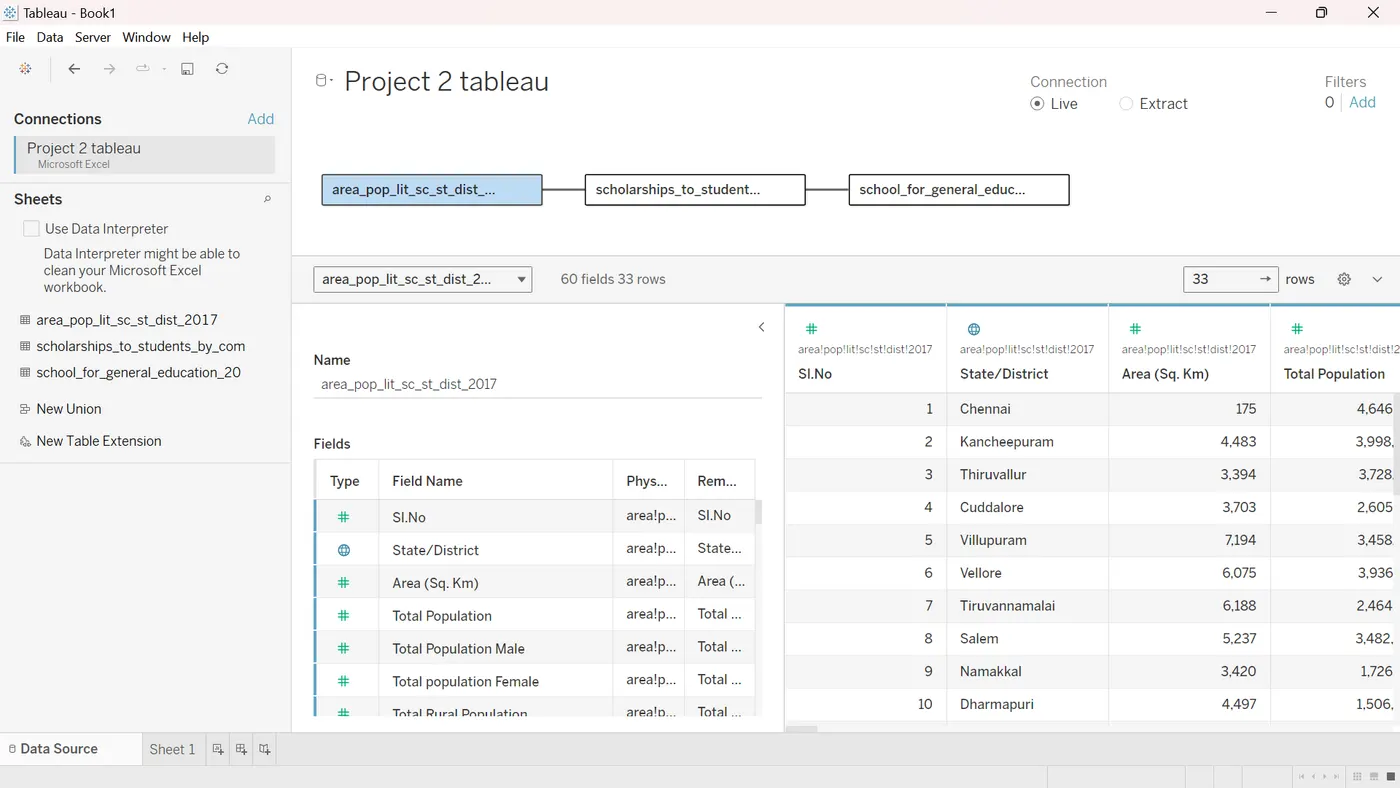
- Where are we on Literacy-wise
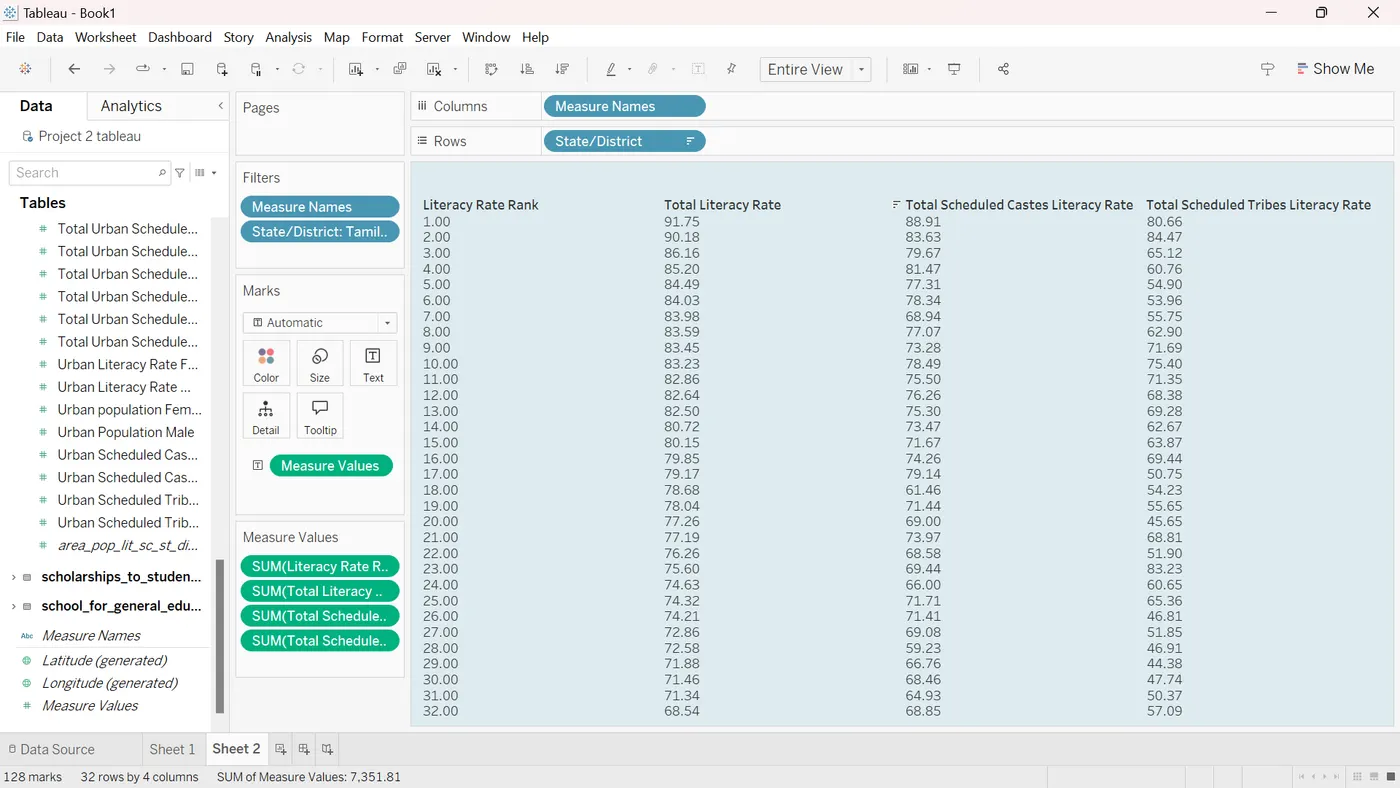
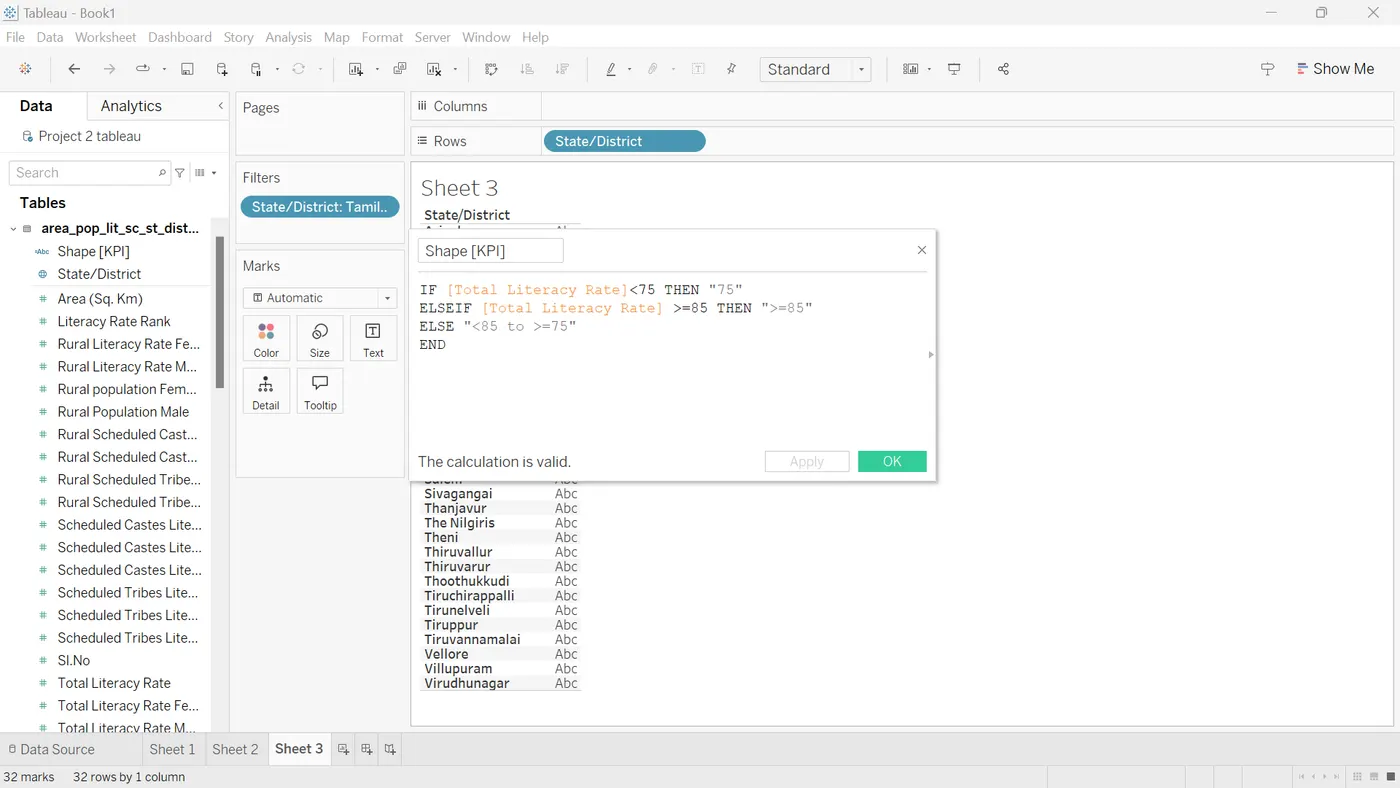
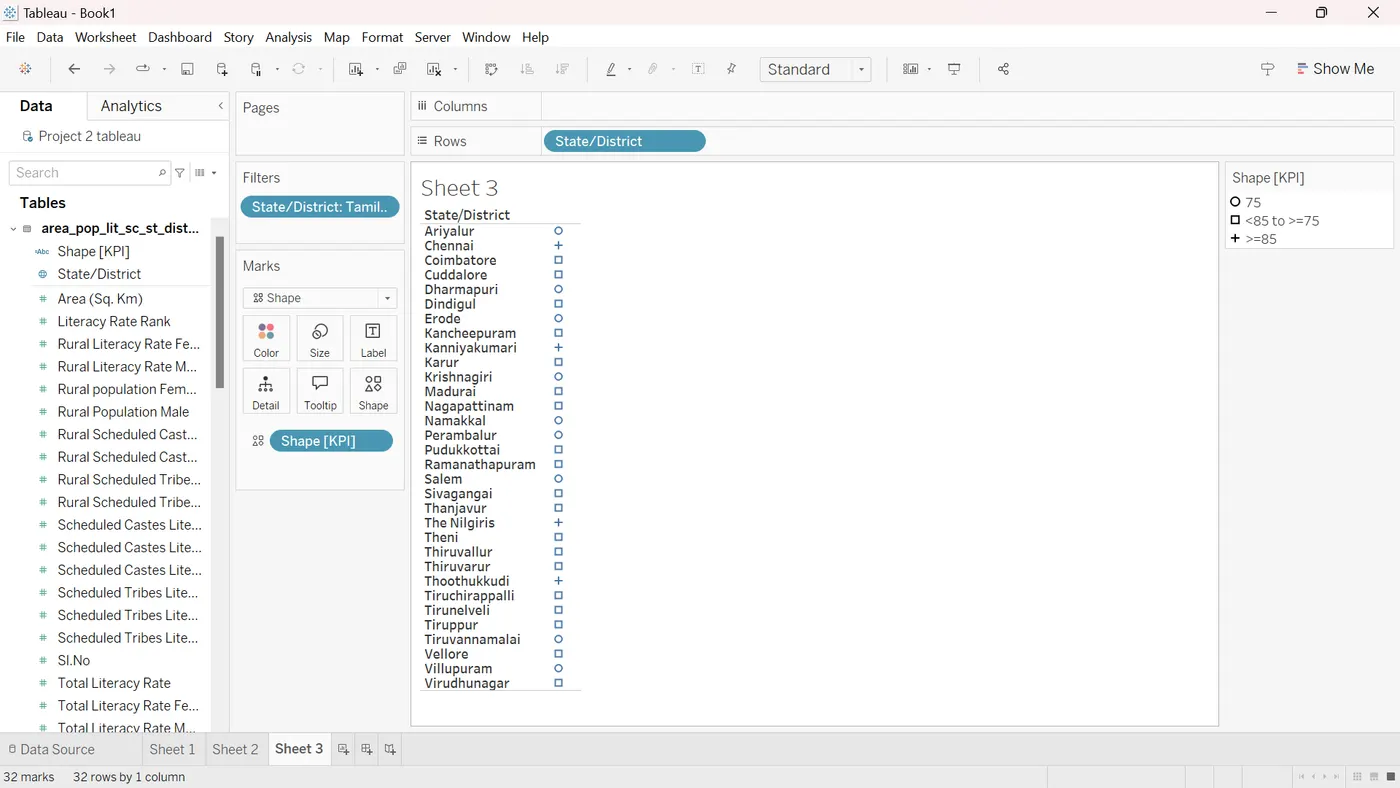
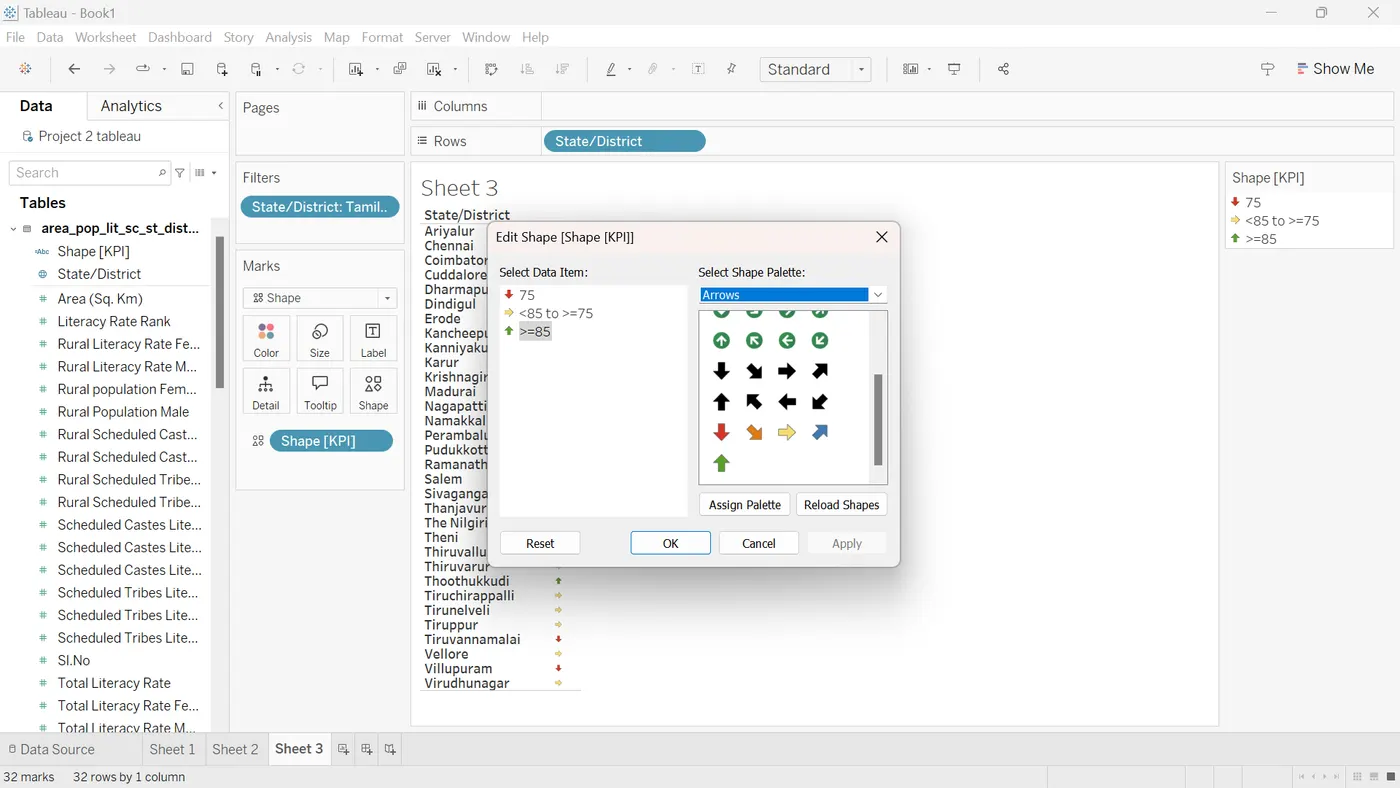
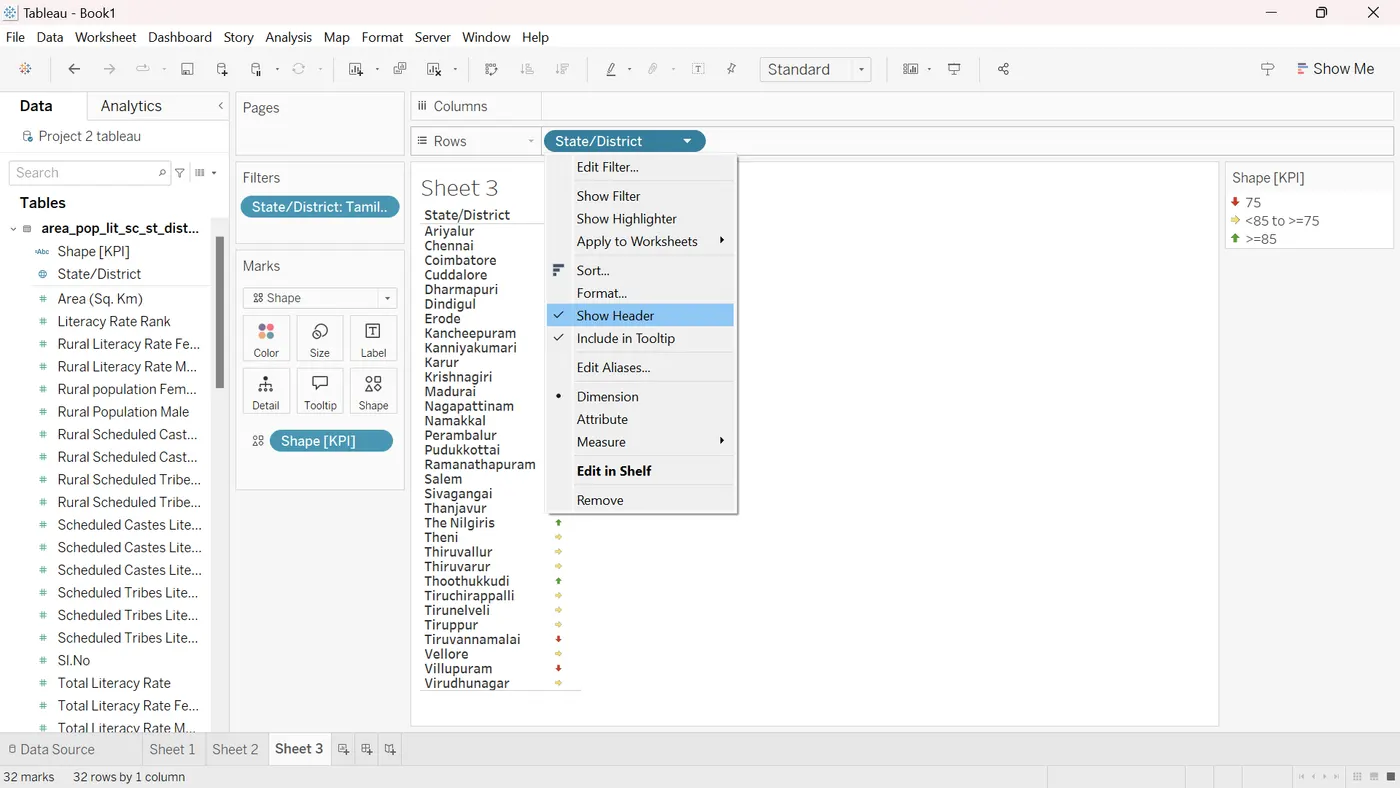
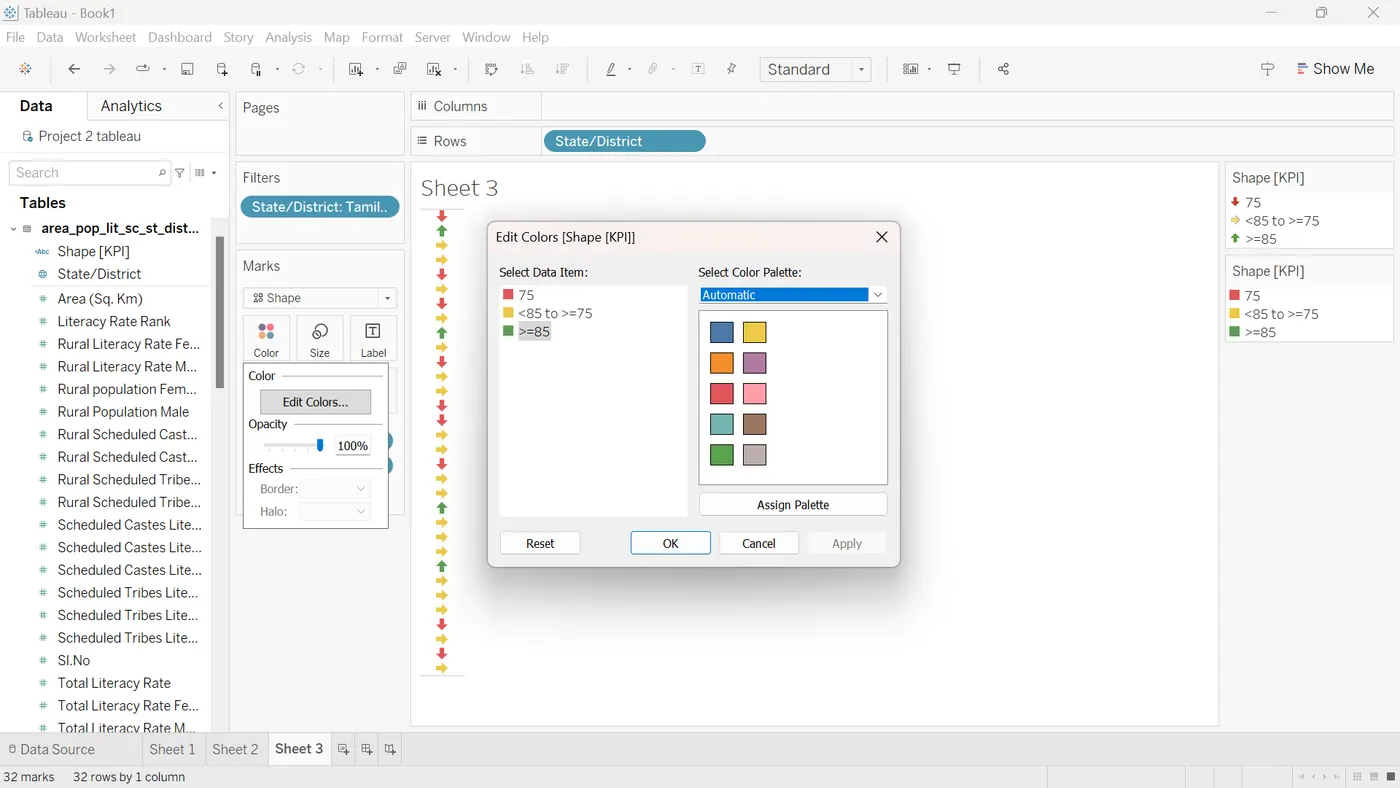
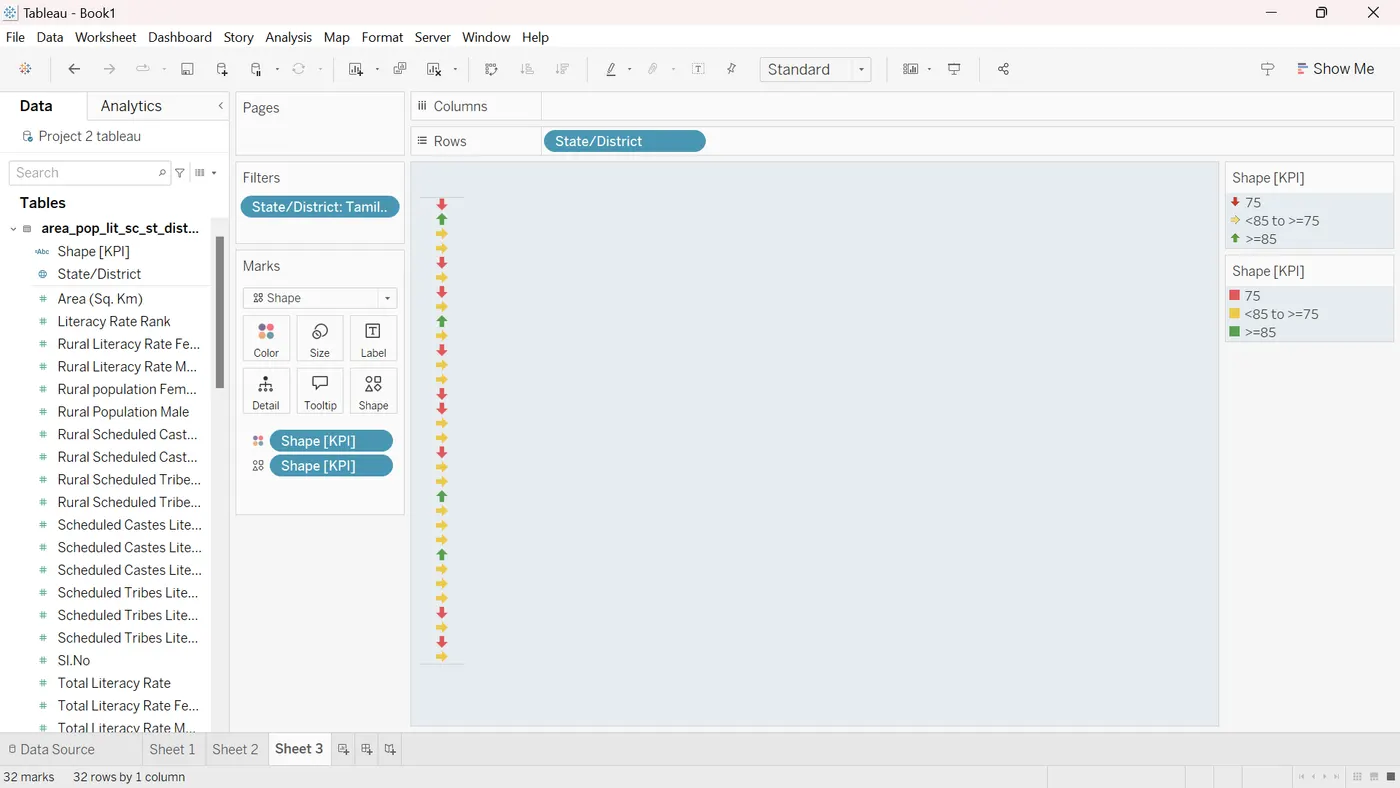
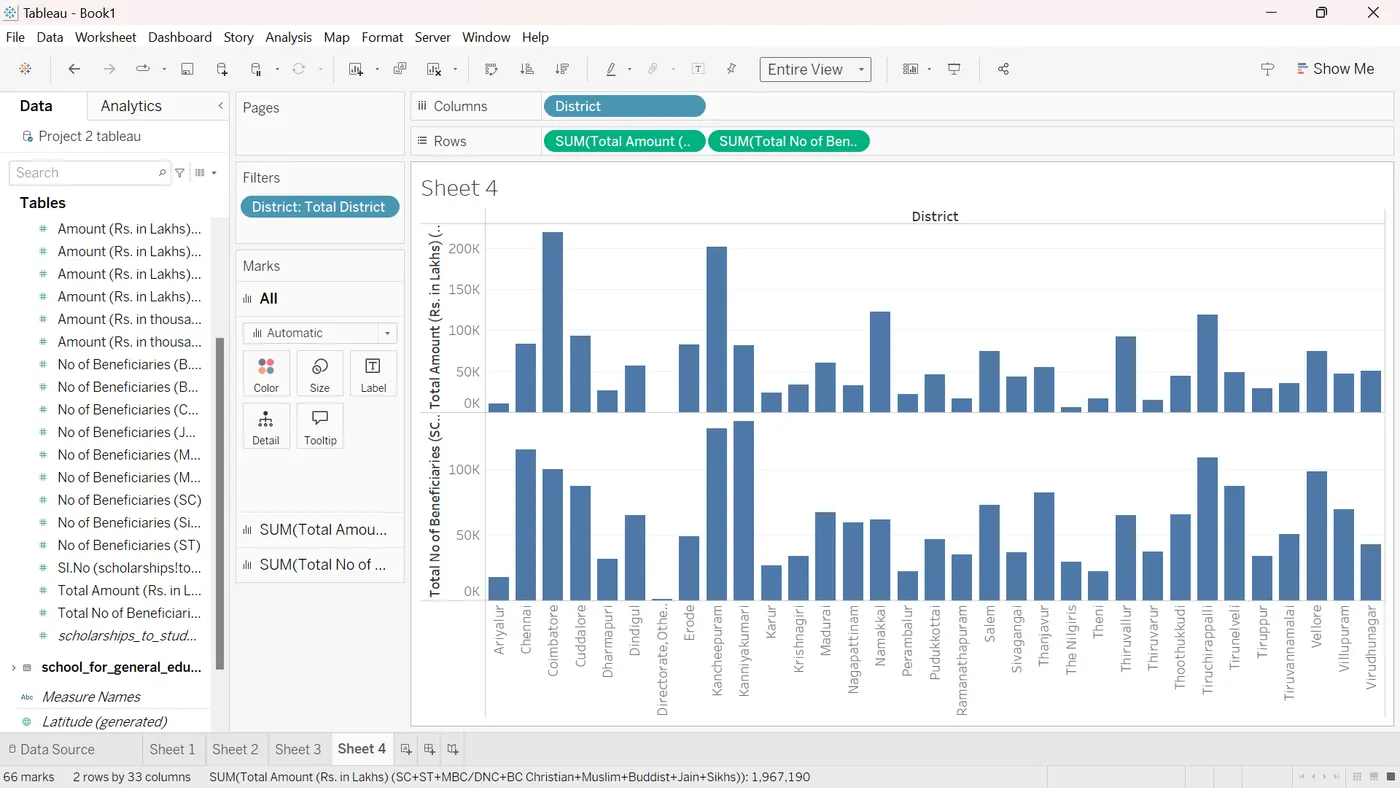
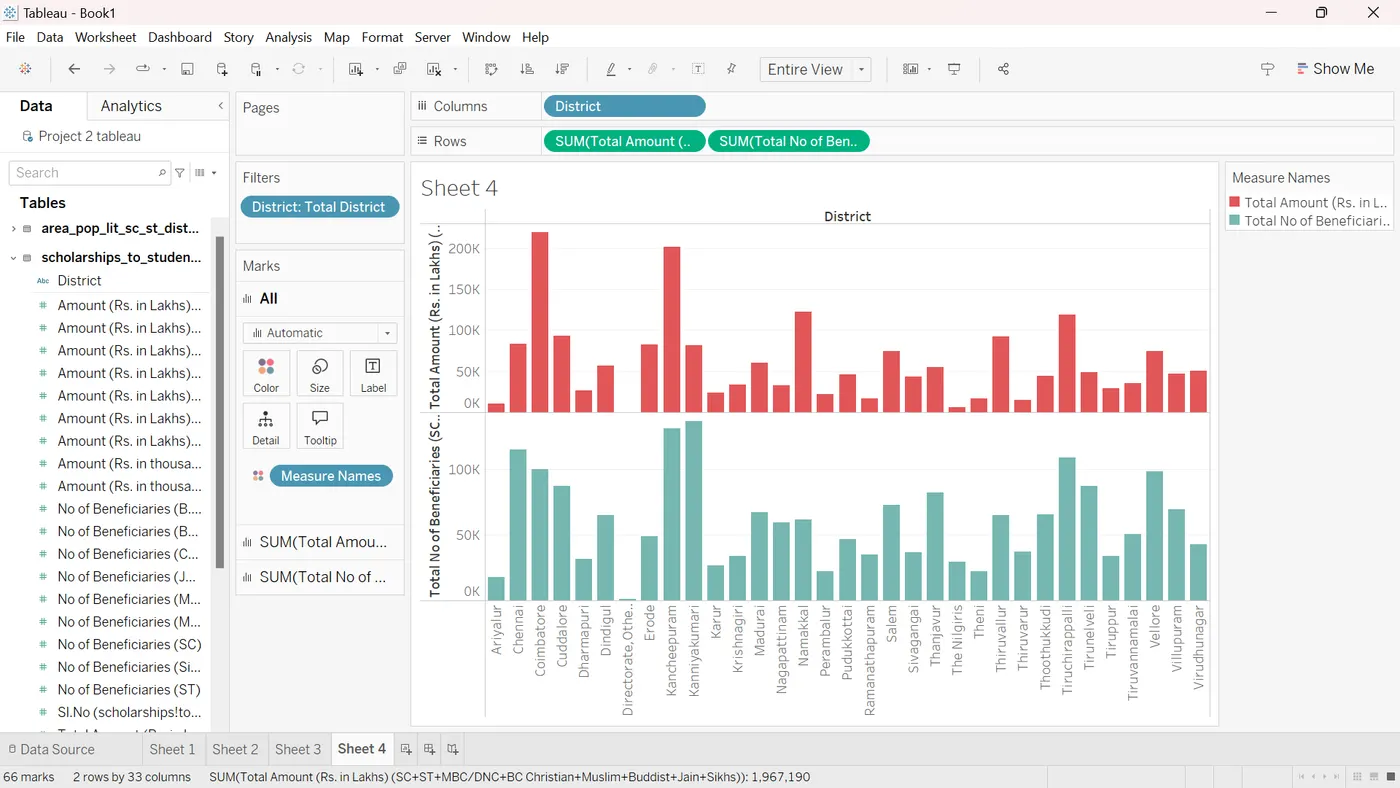
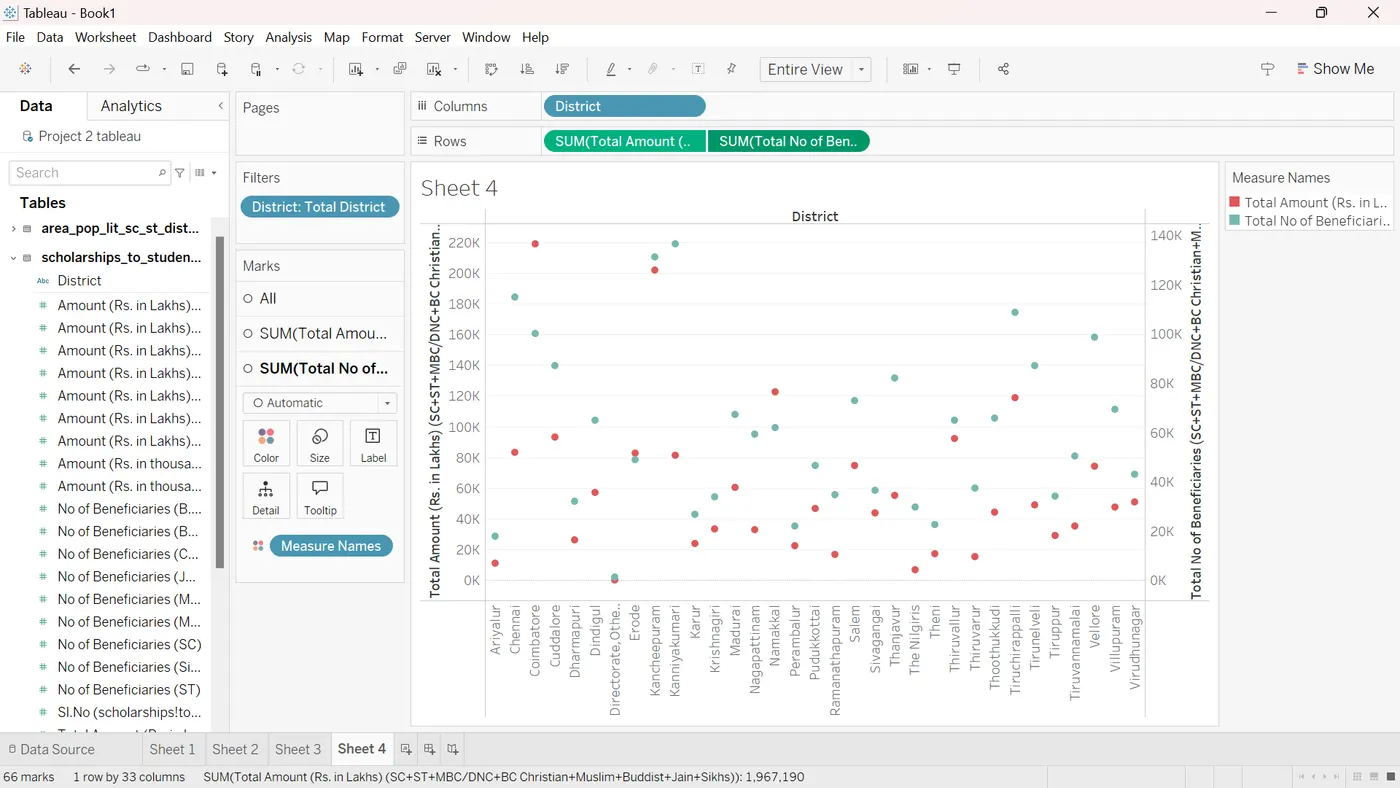
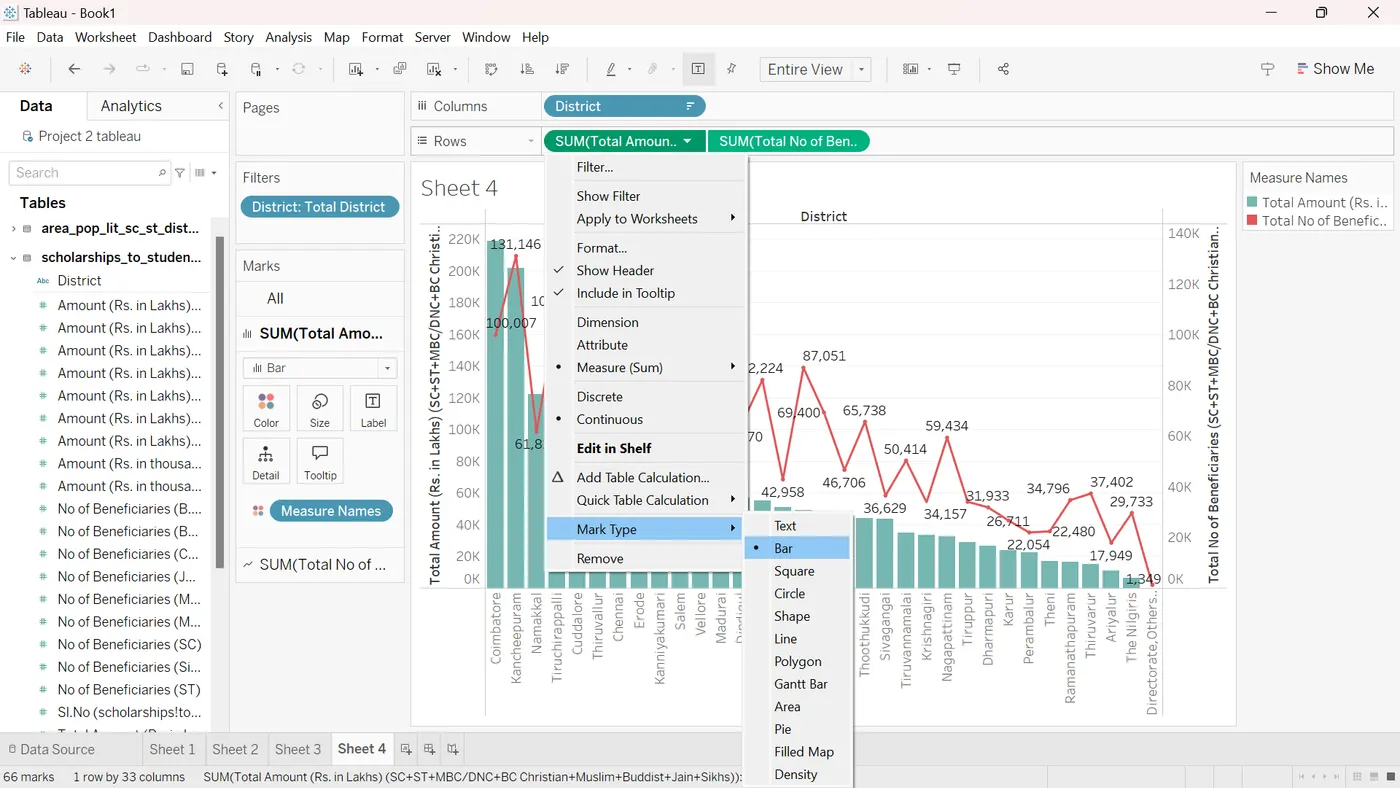
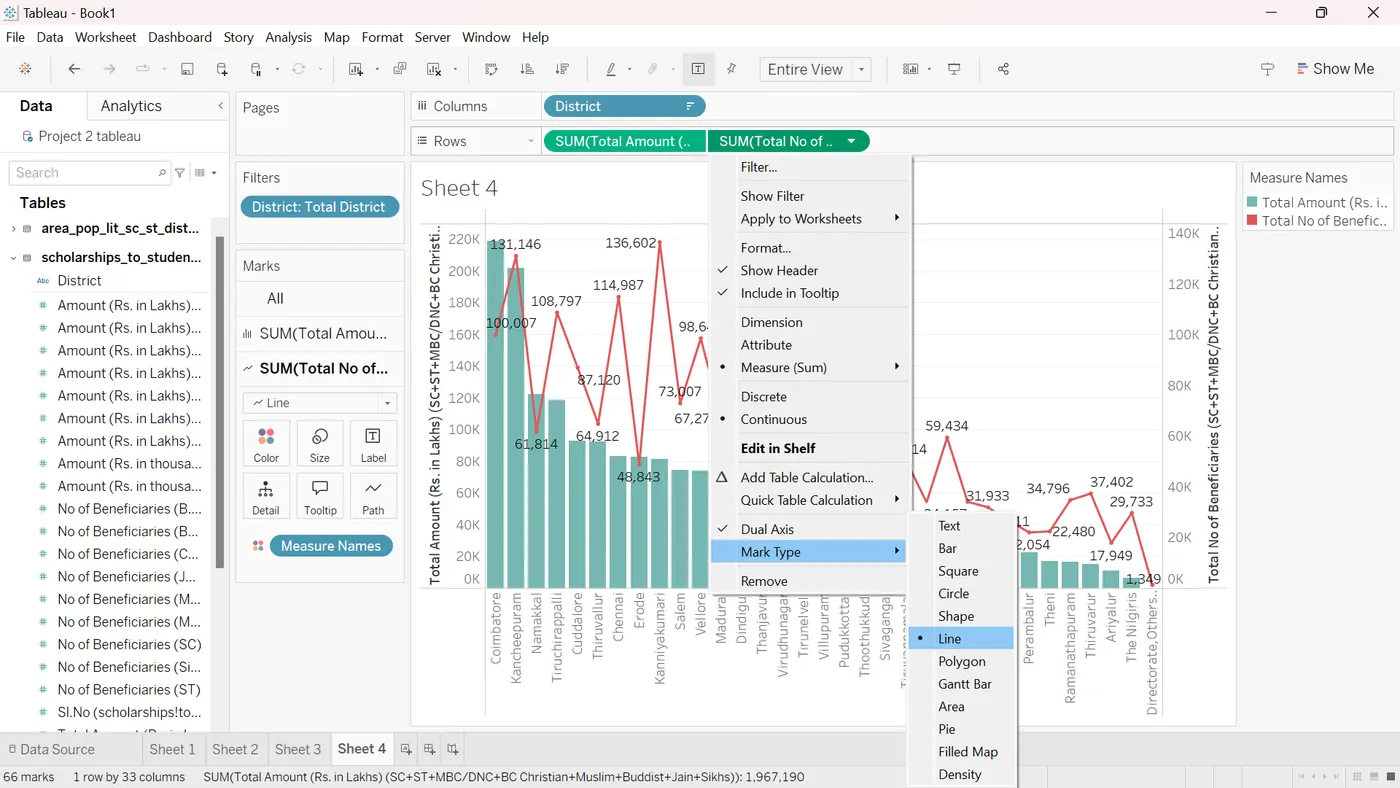
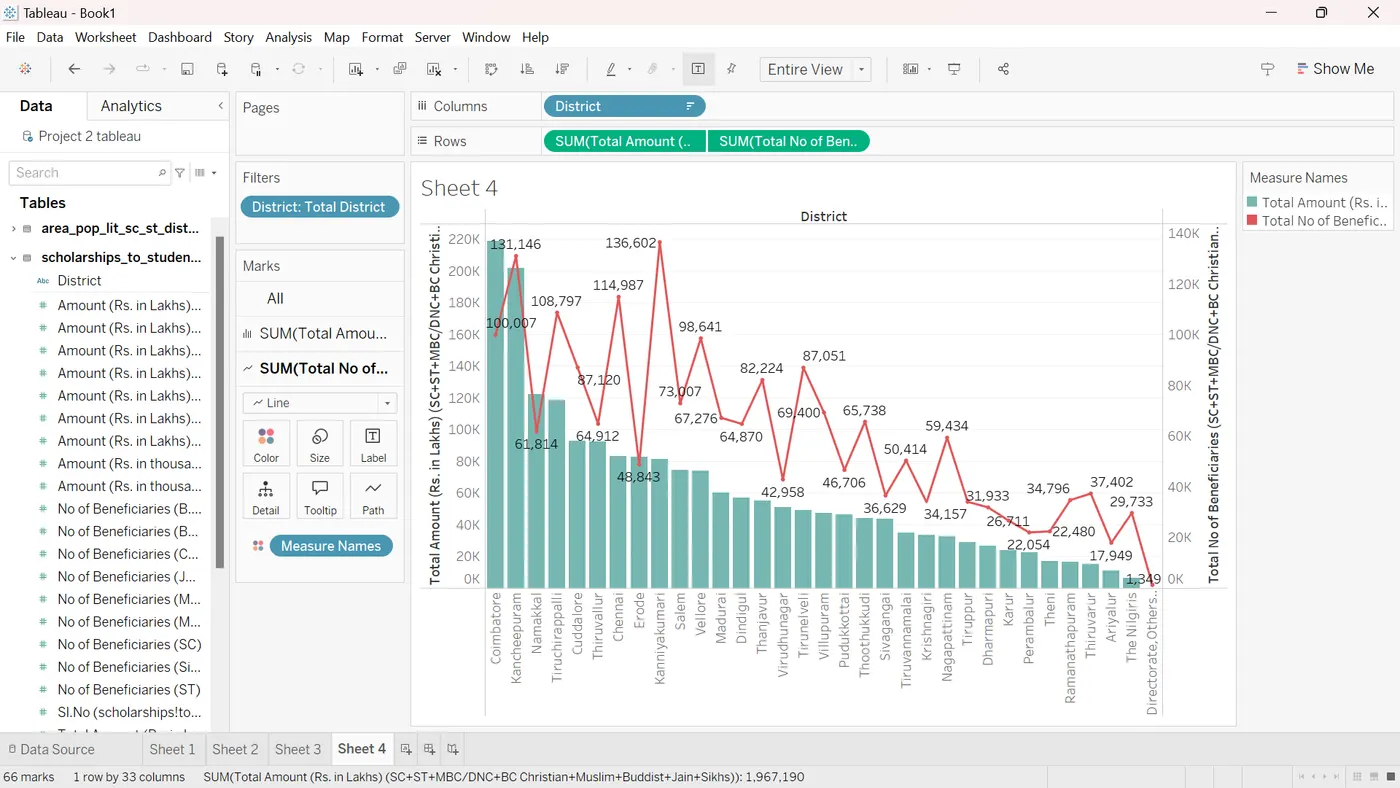
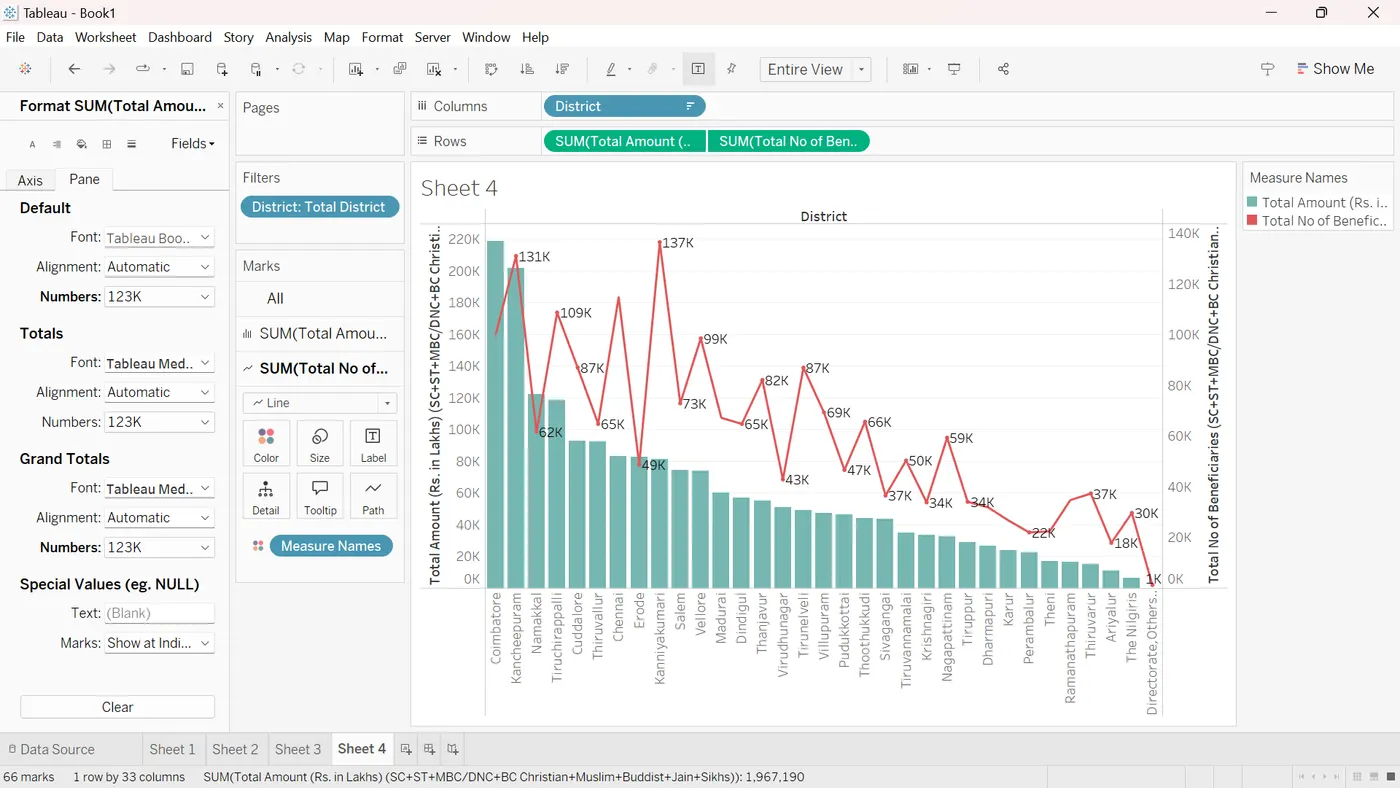
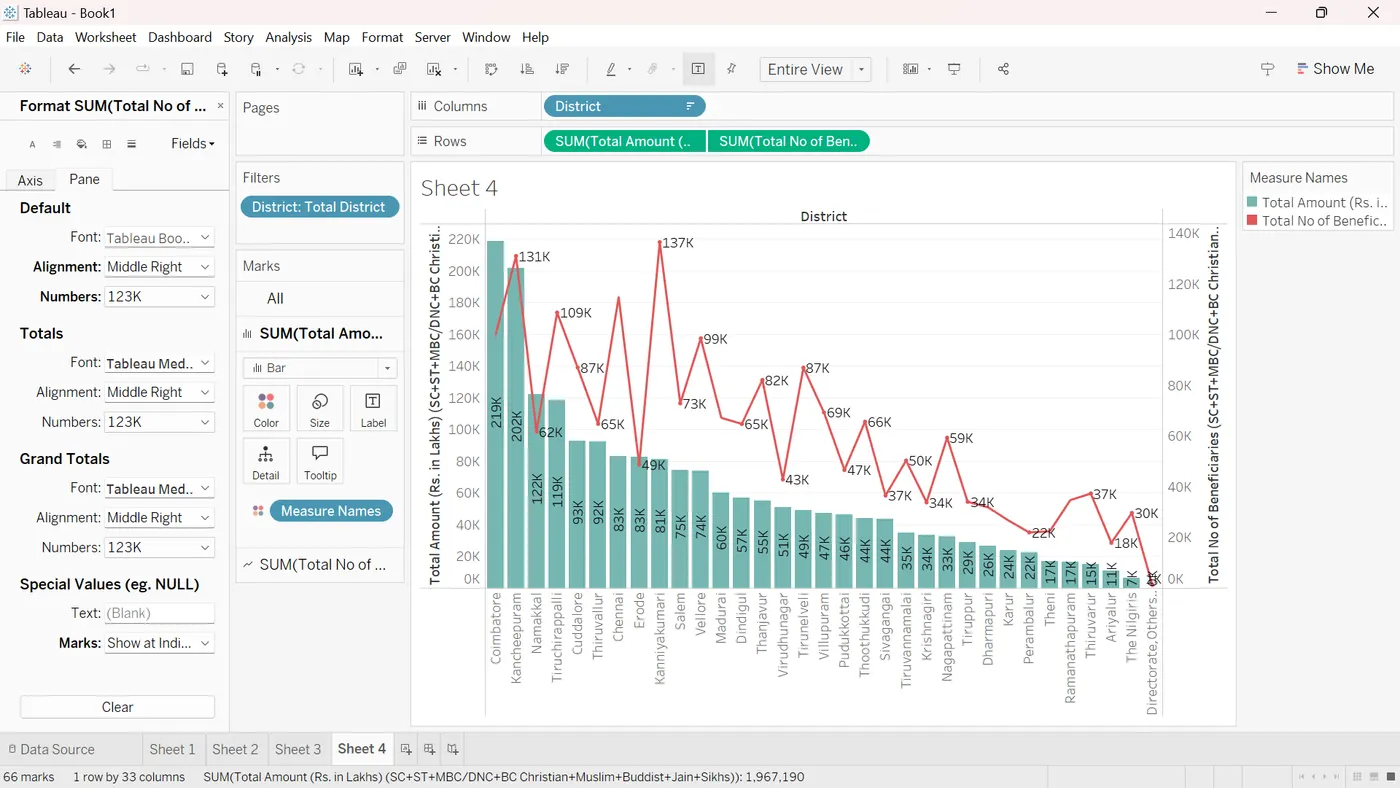
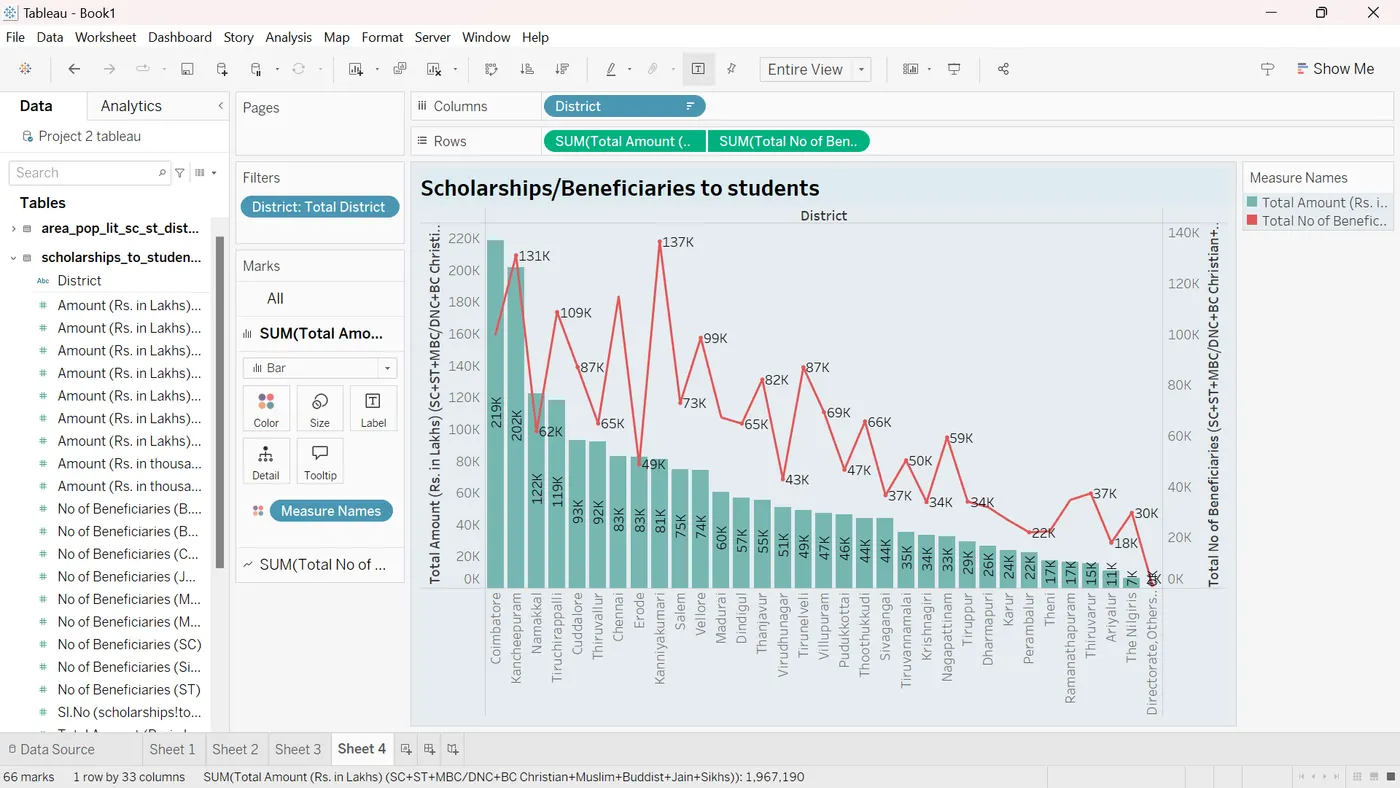
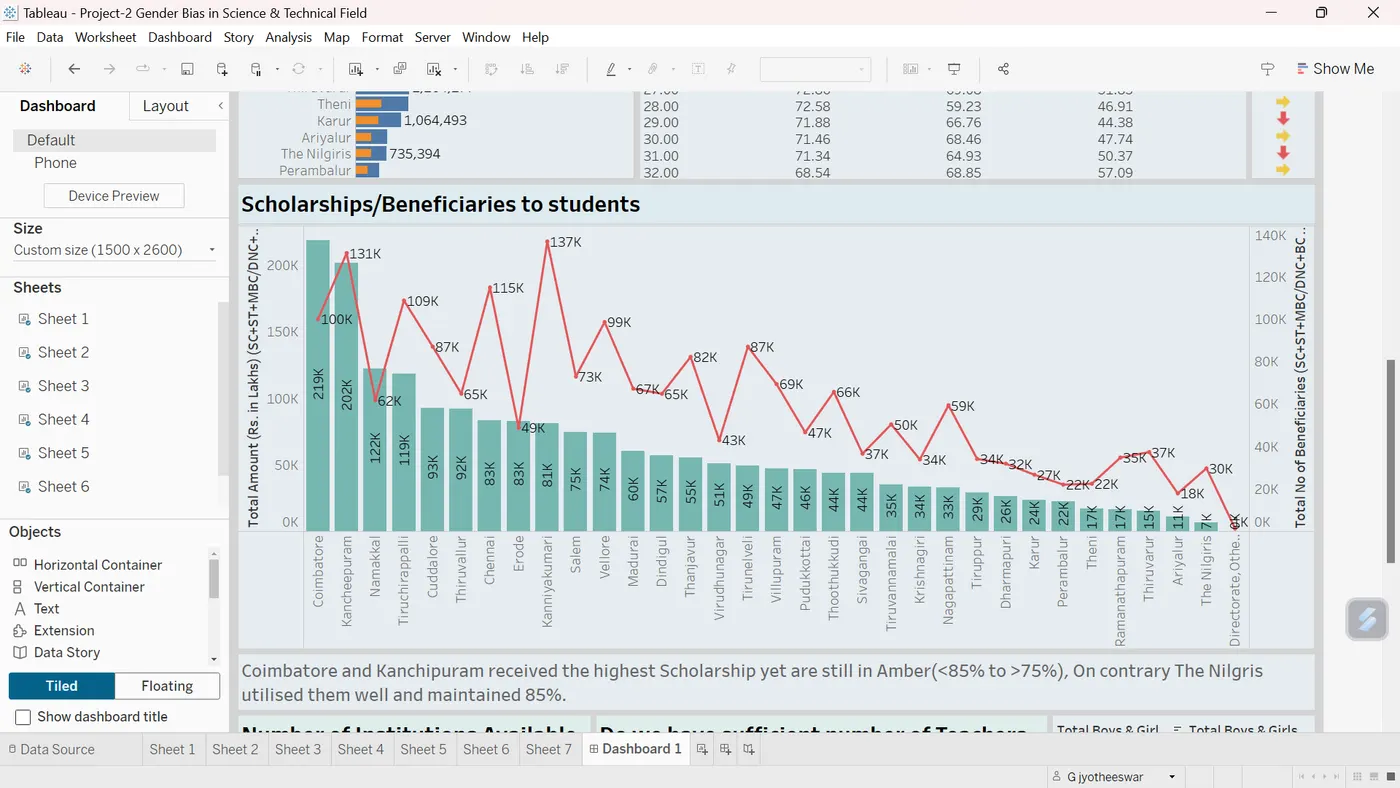
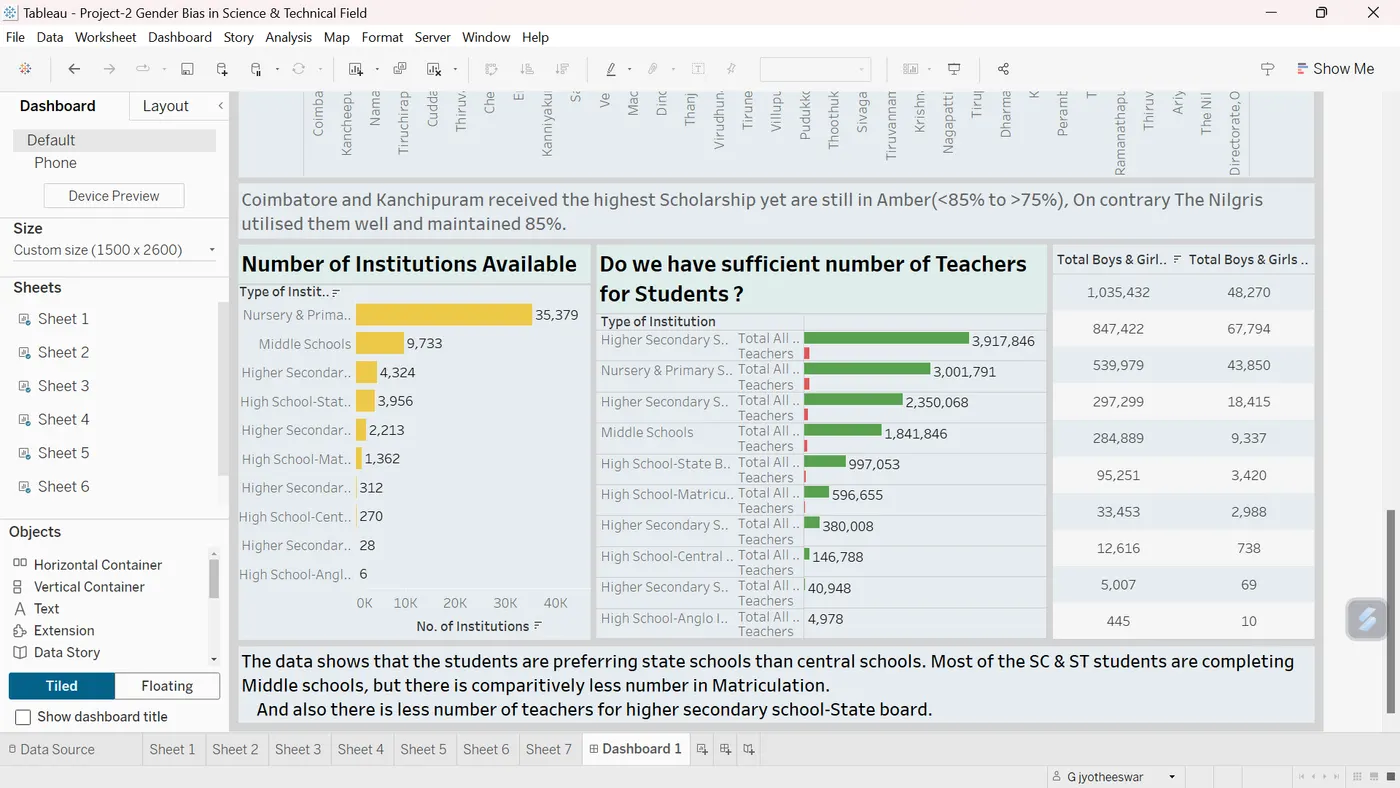
Coimbatore and Kanchipuram received the highest Scholarship yet are still in Amber(<85% to >75%), On contrary The Nilgris utilised them well and maintained 85%.
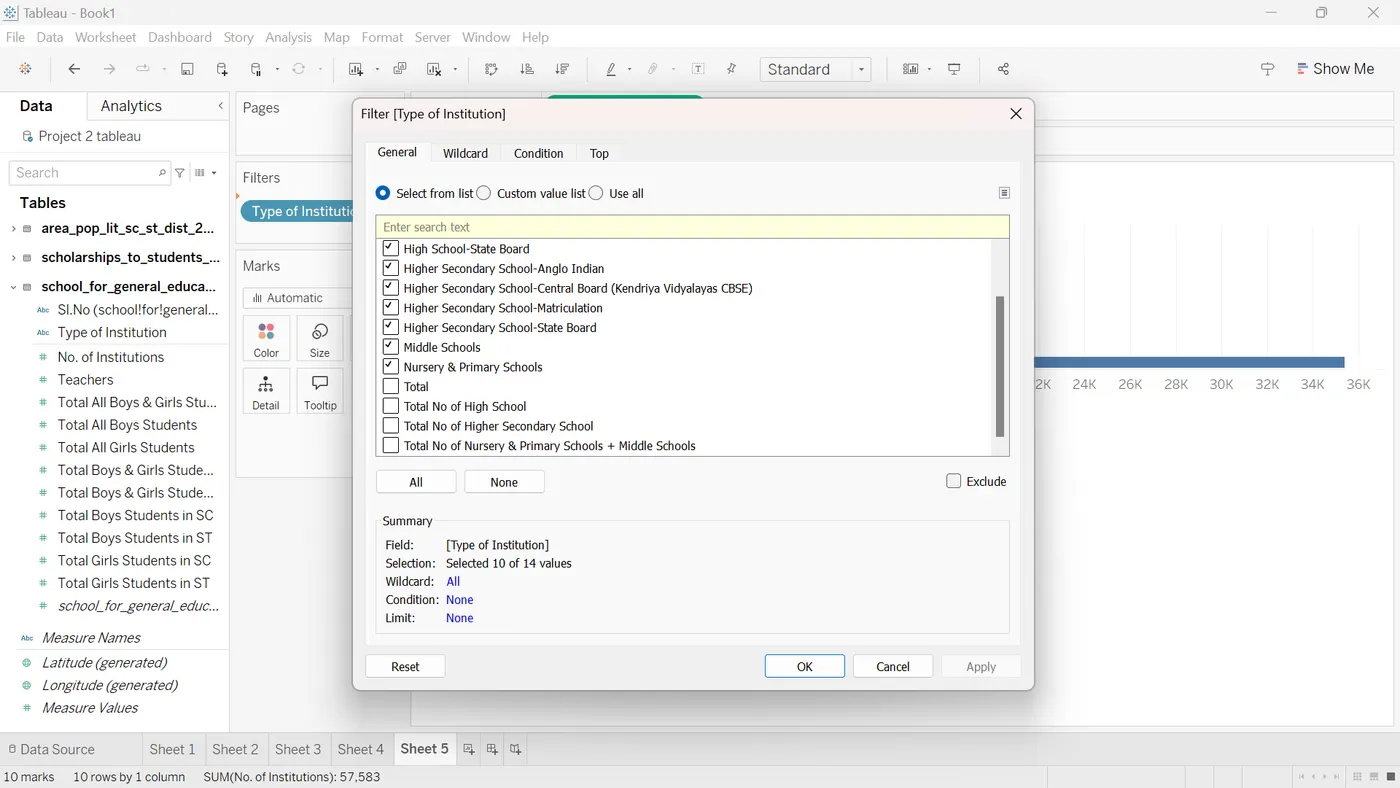
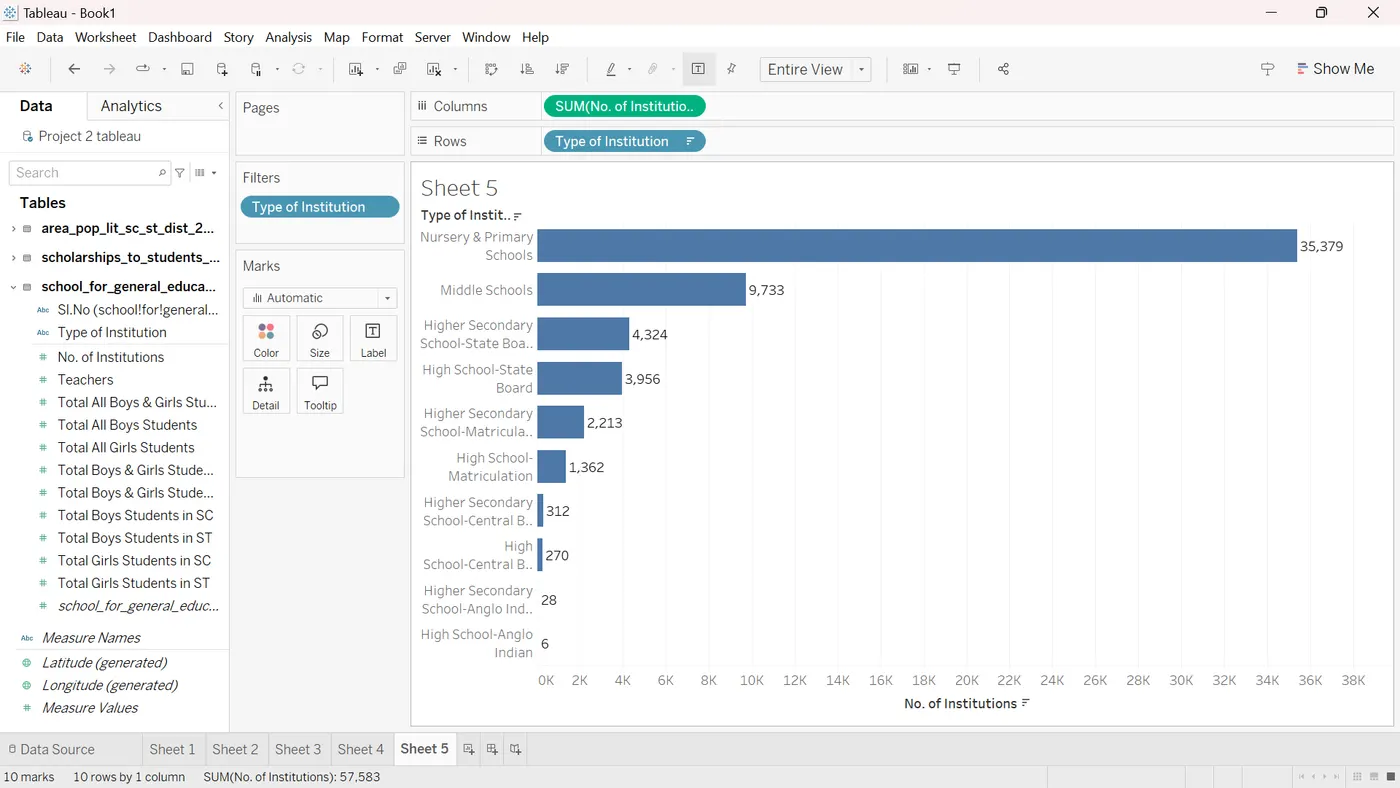
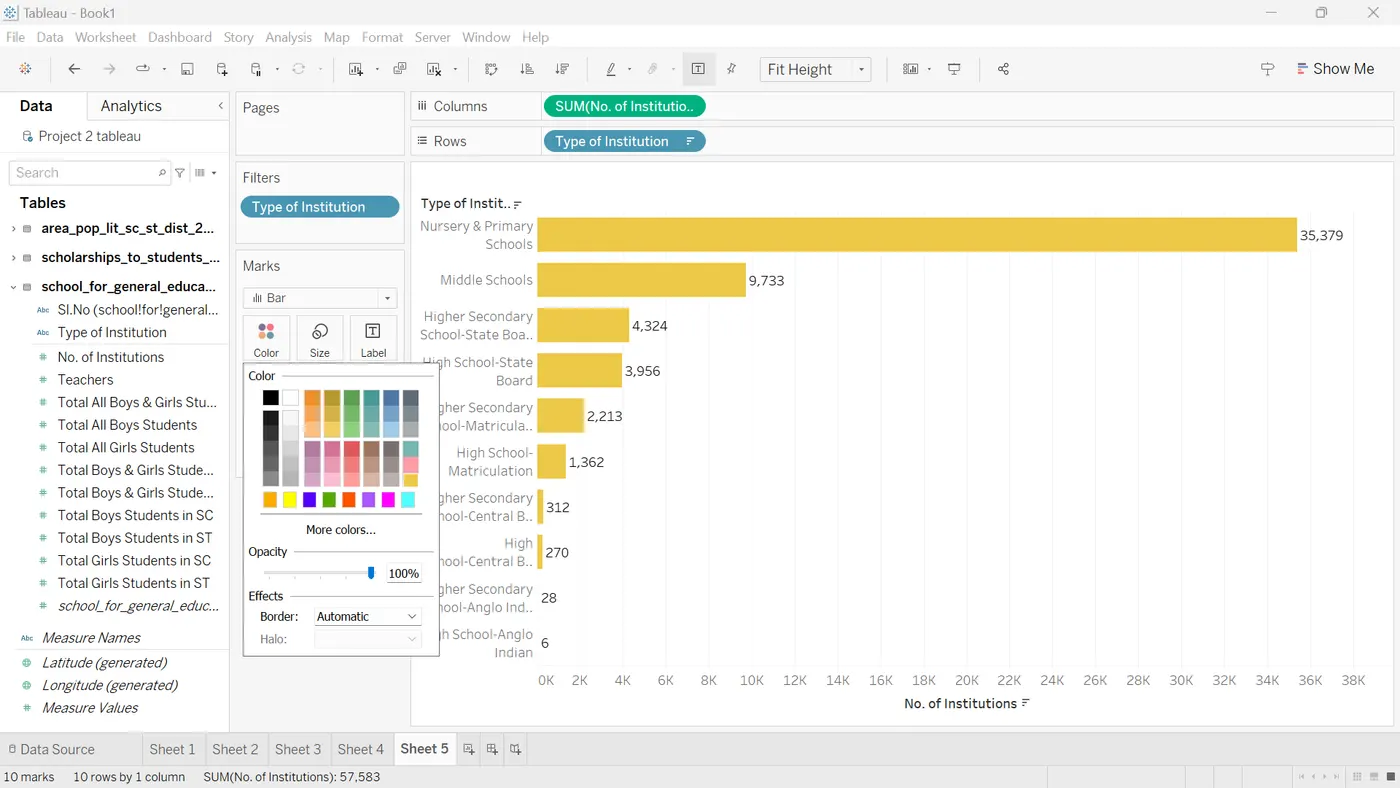
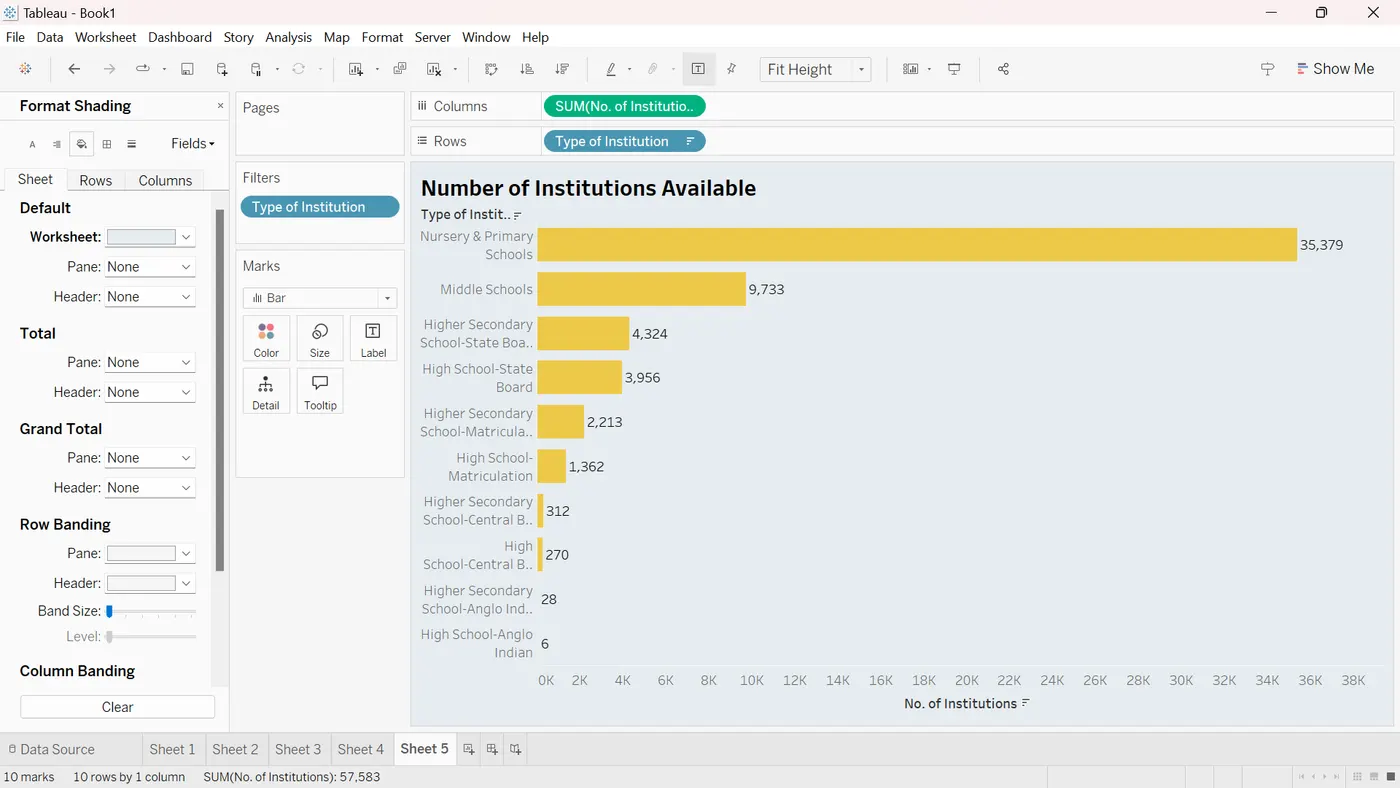
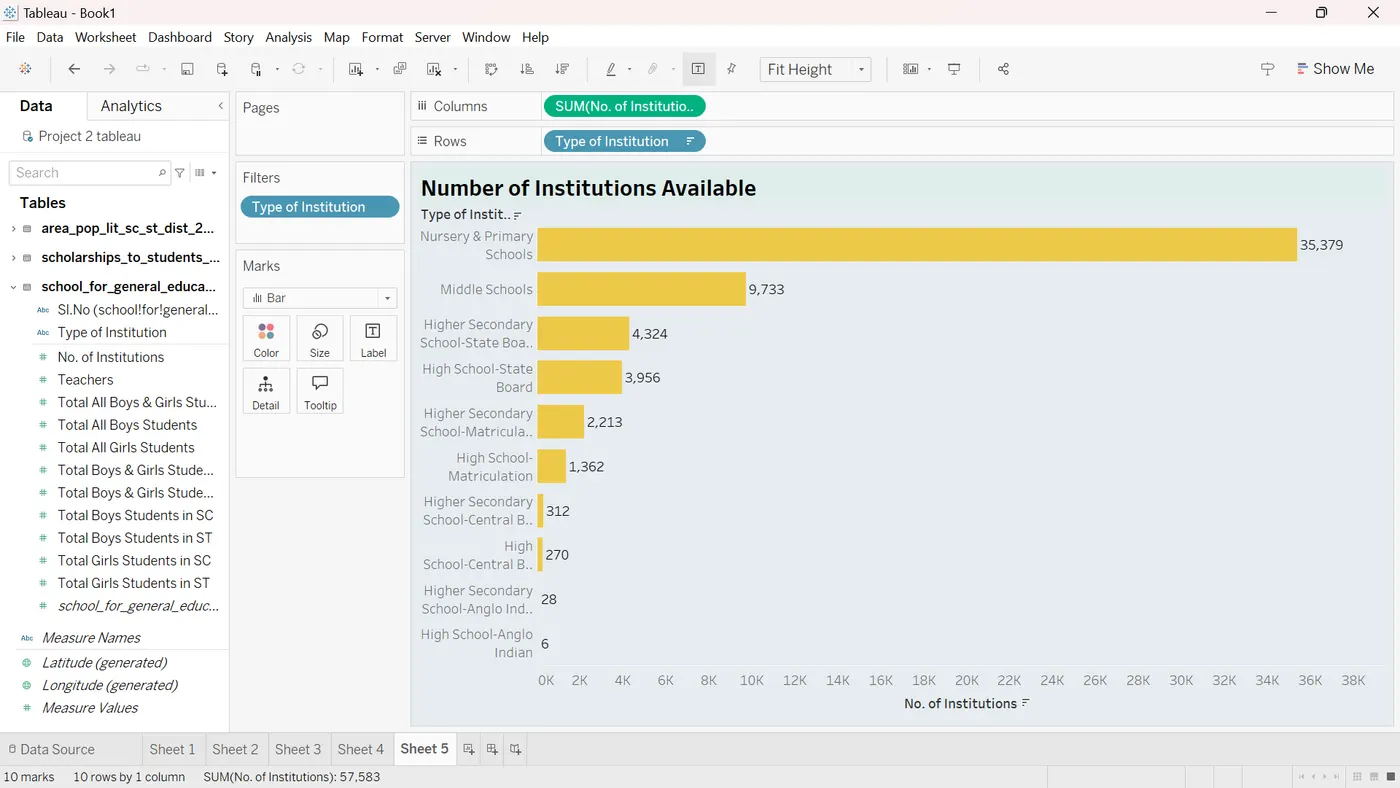
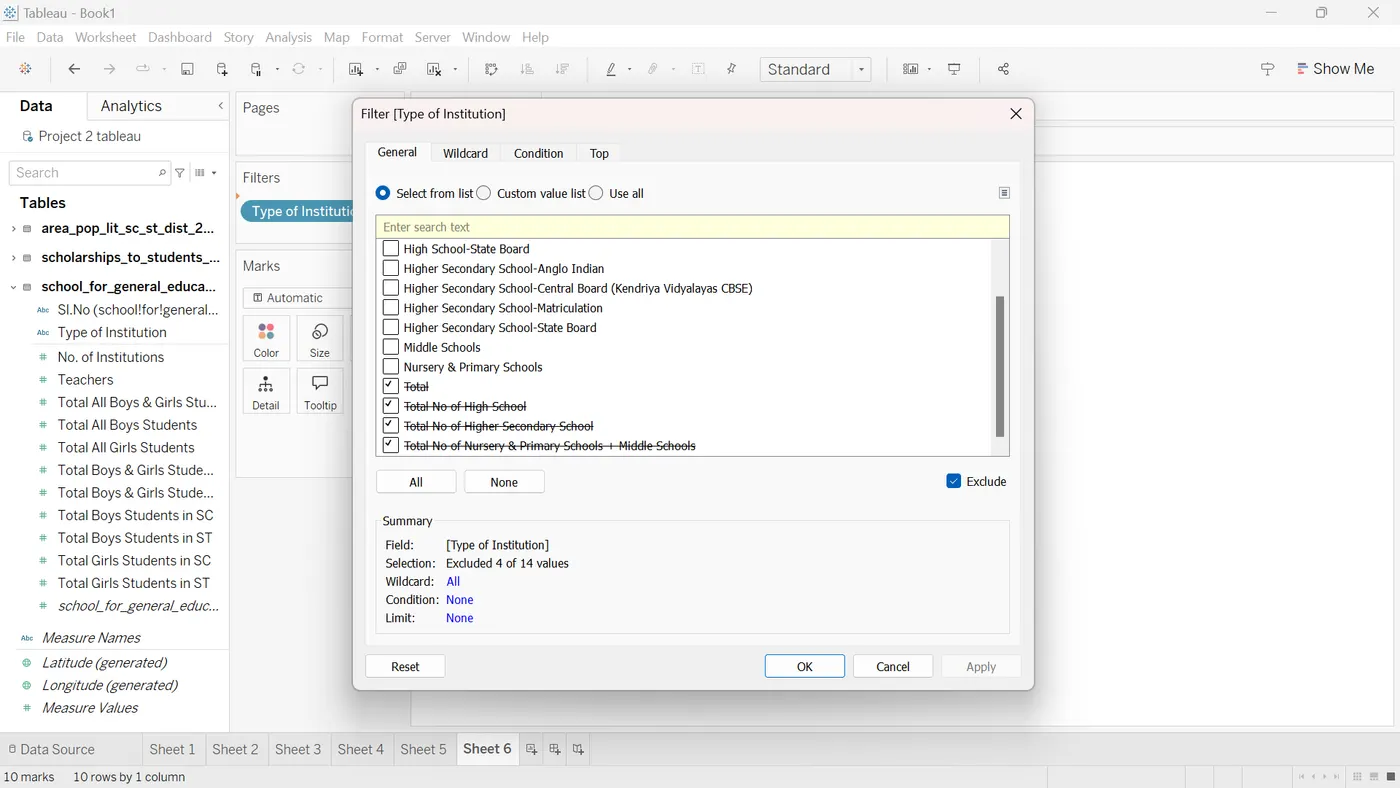
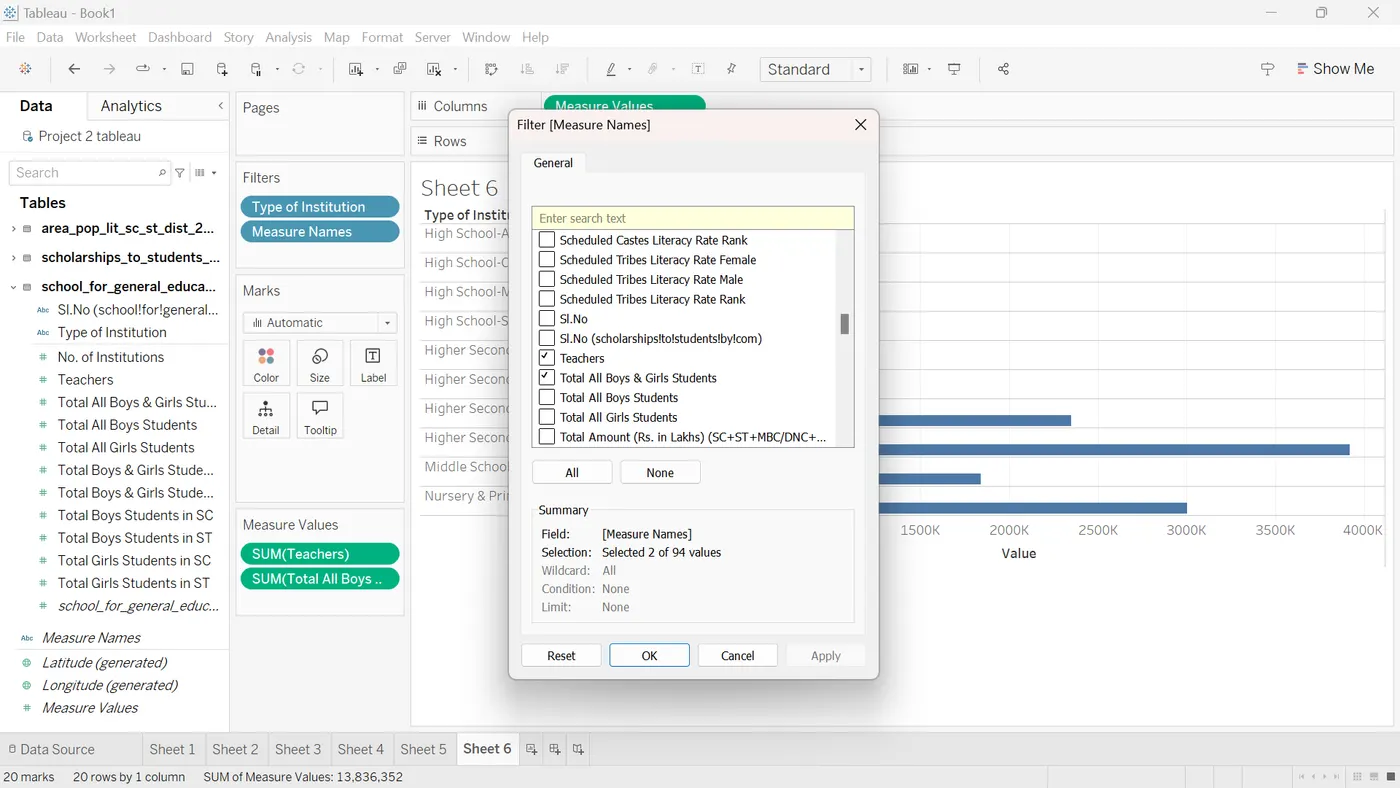
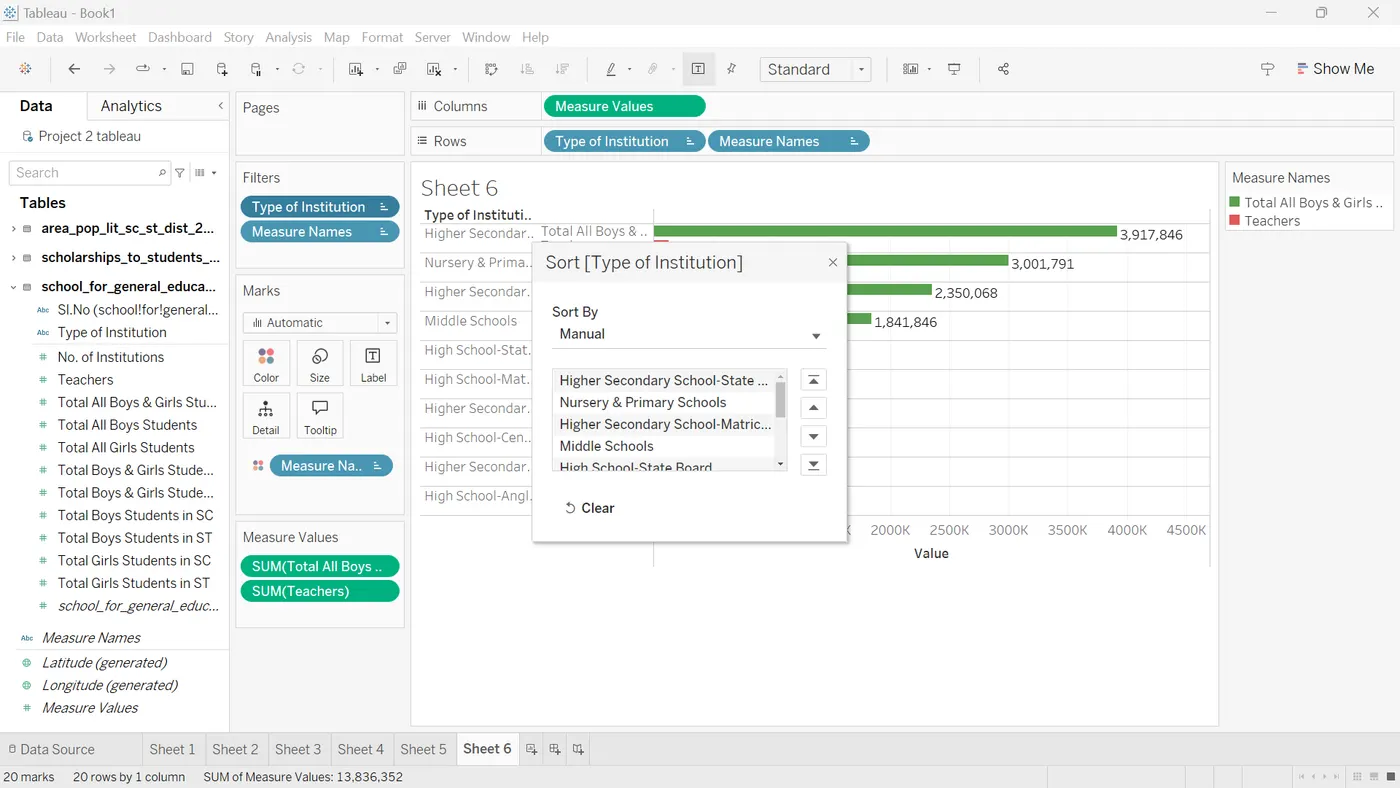
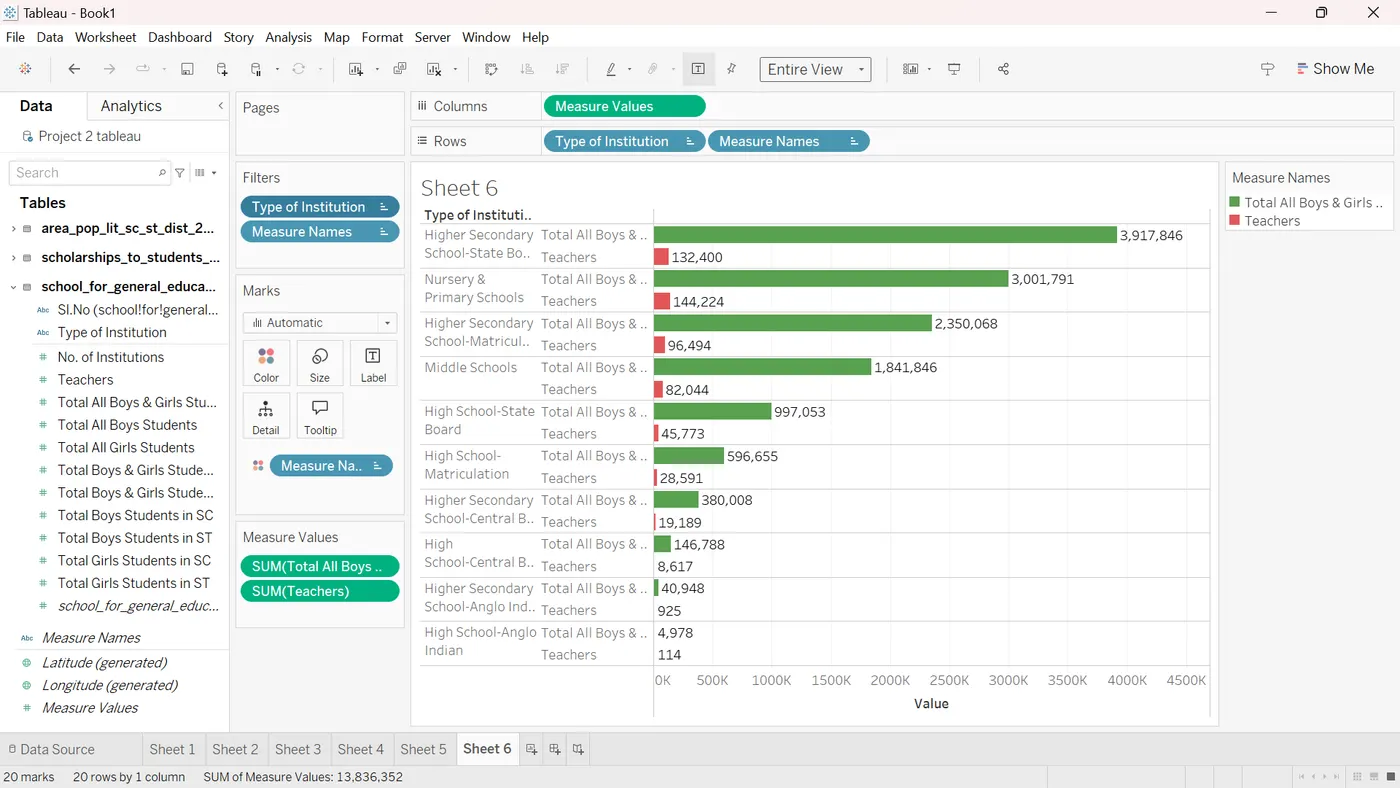
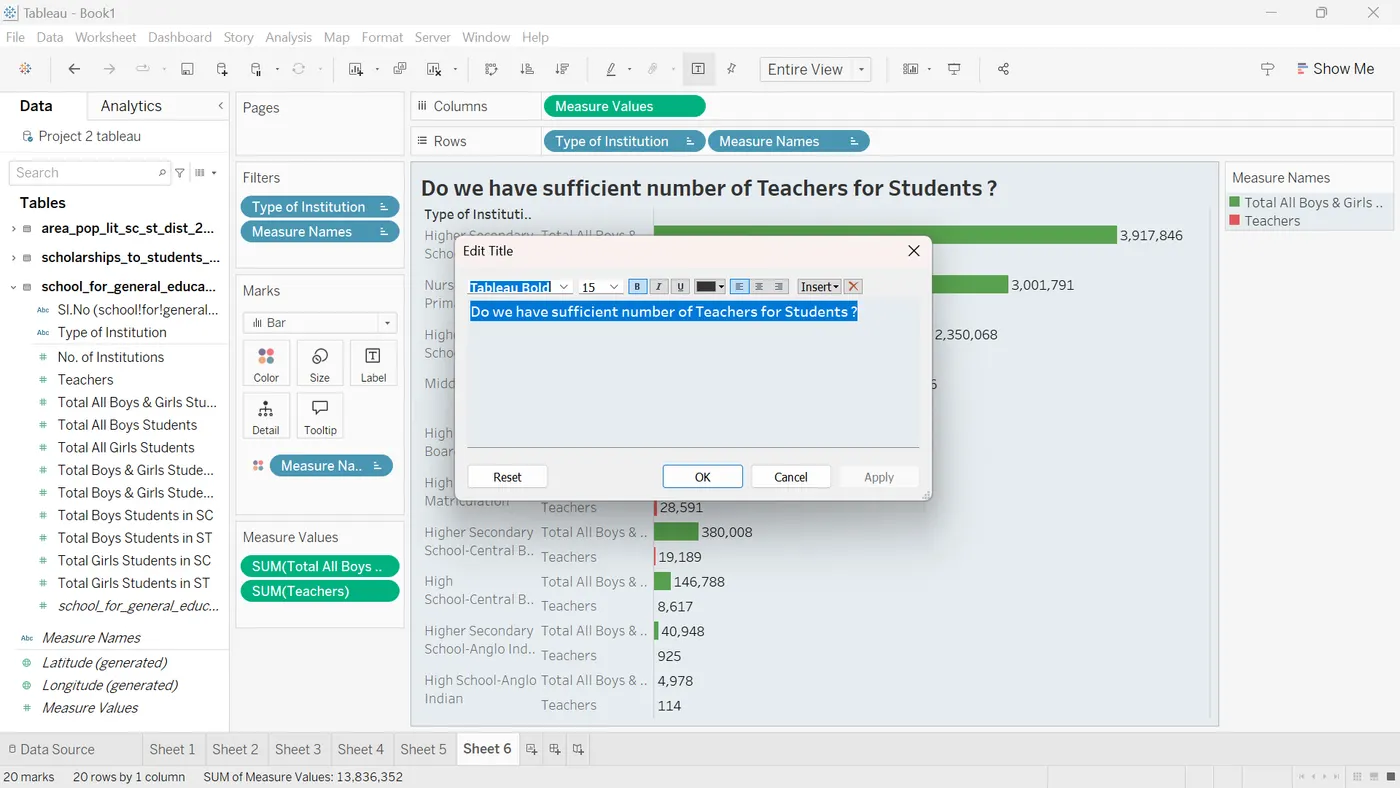
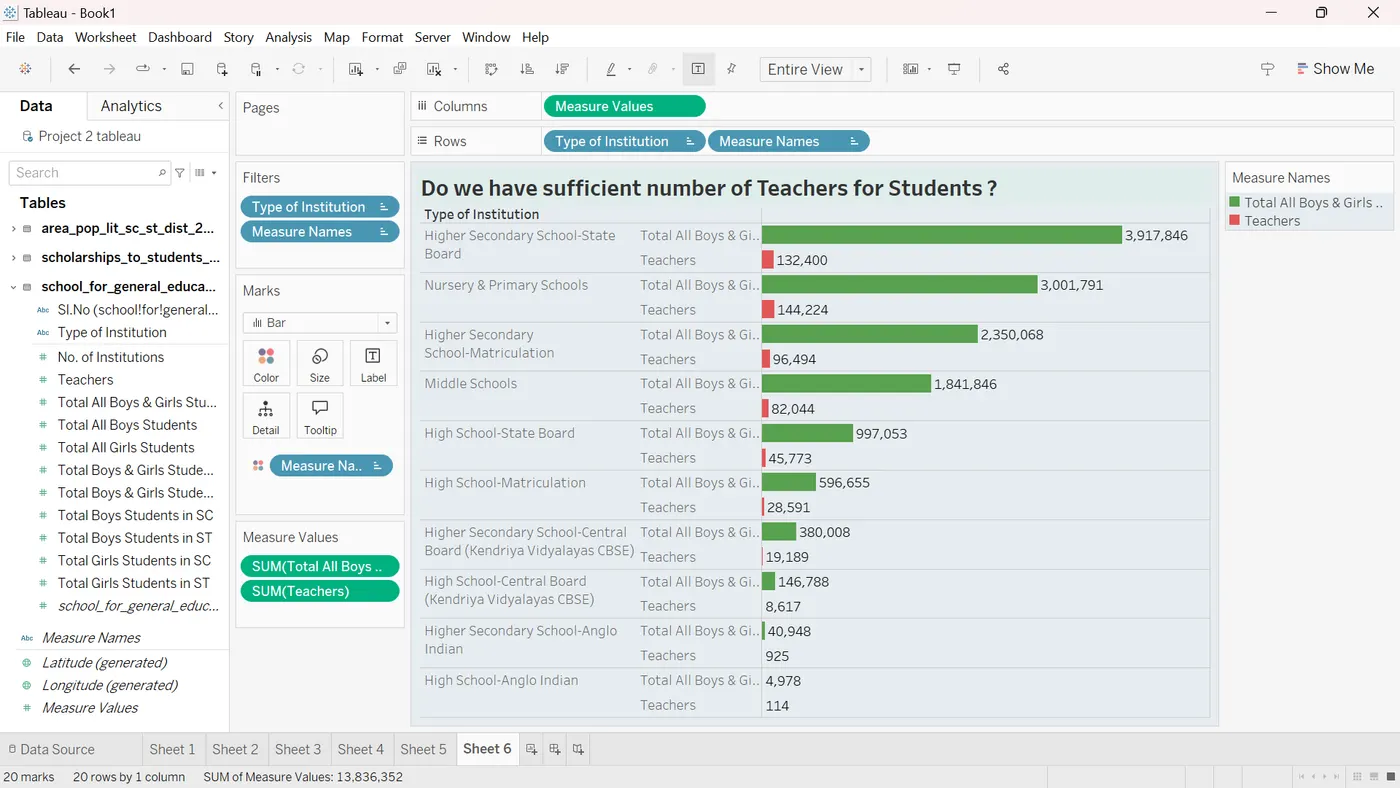
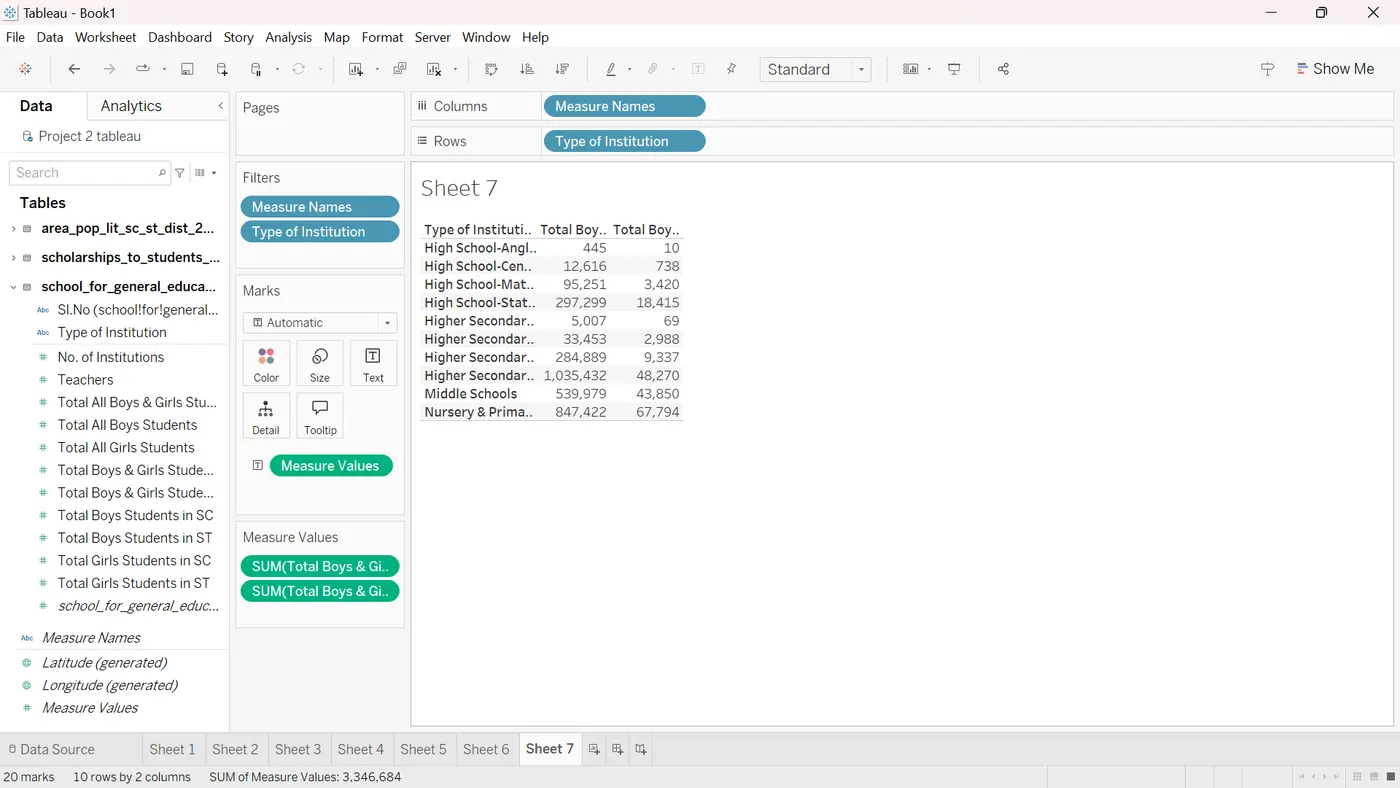
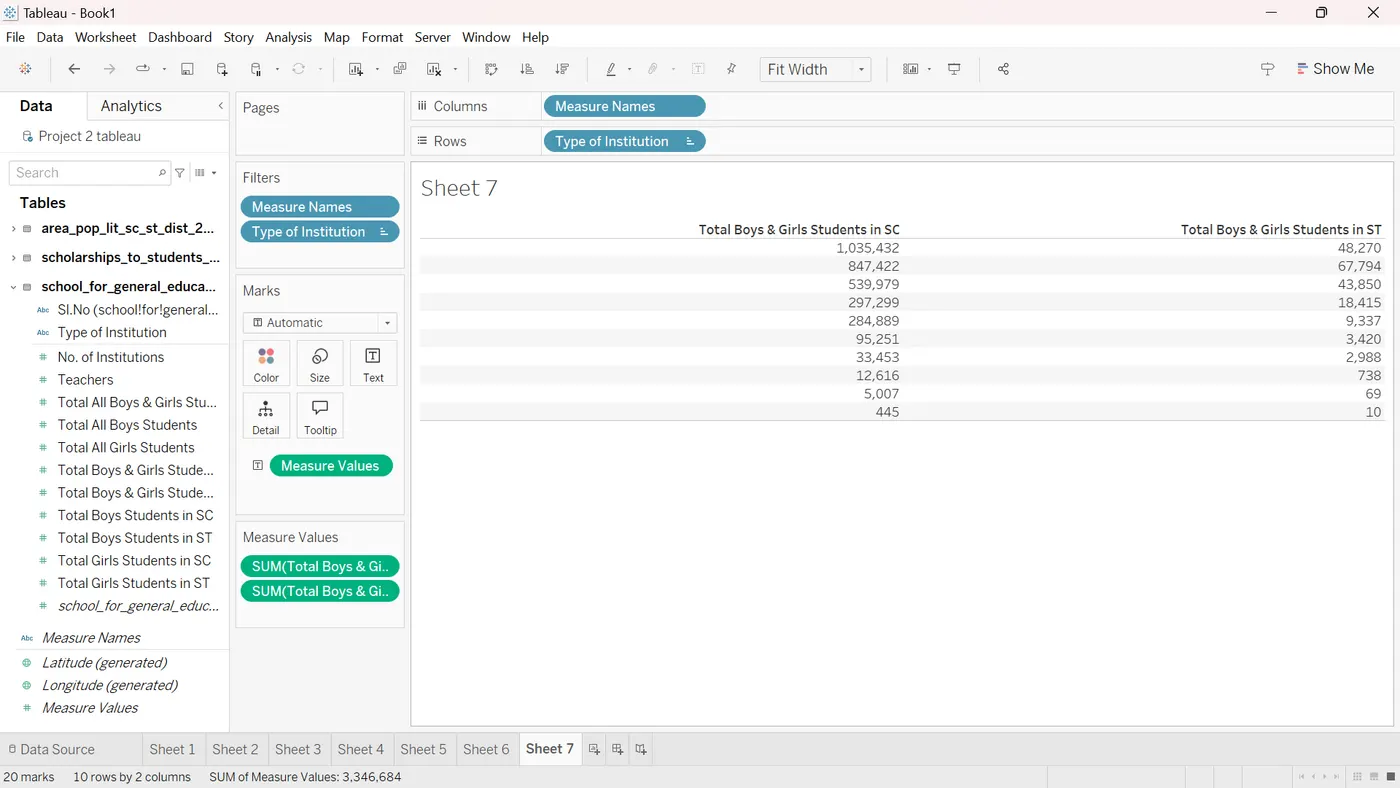
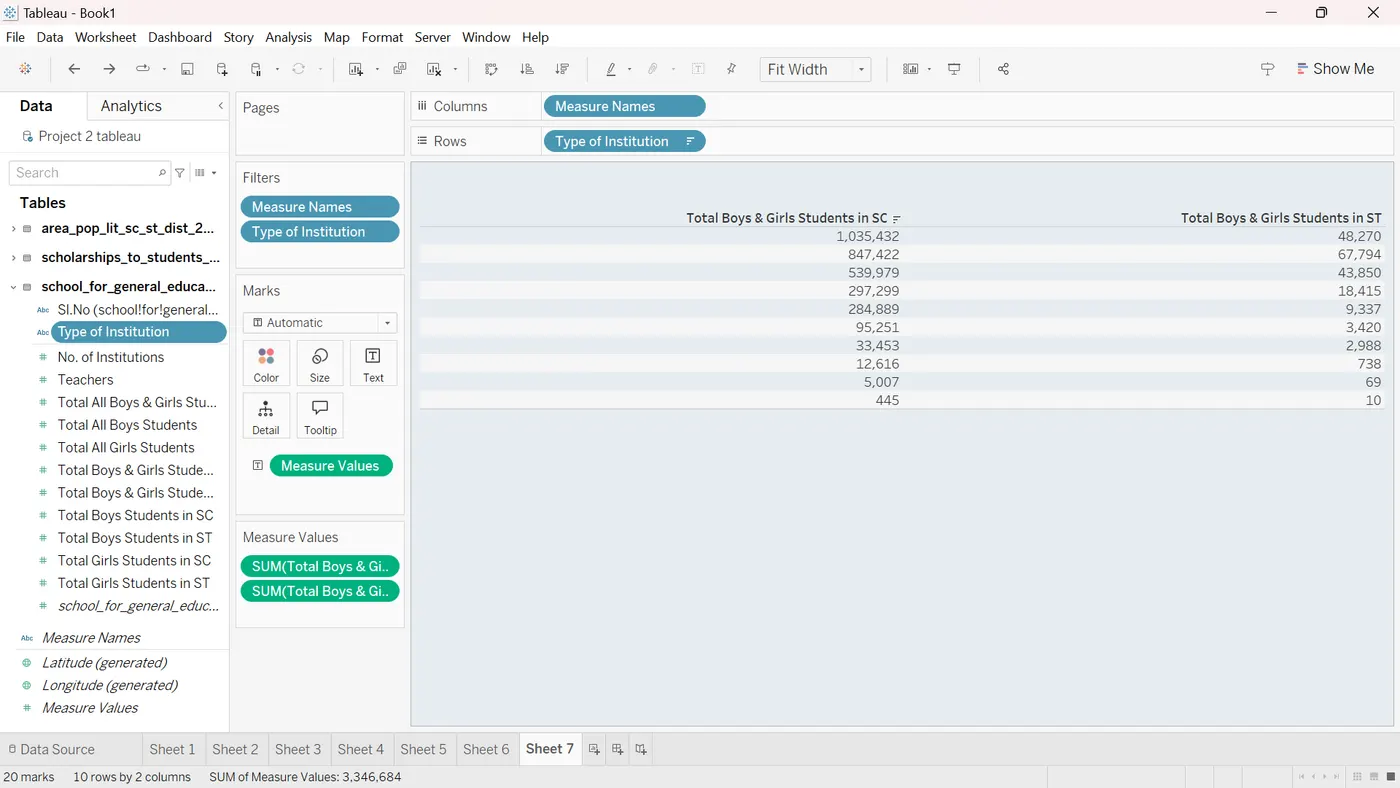
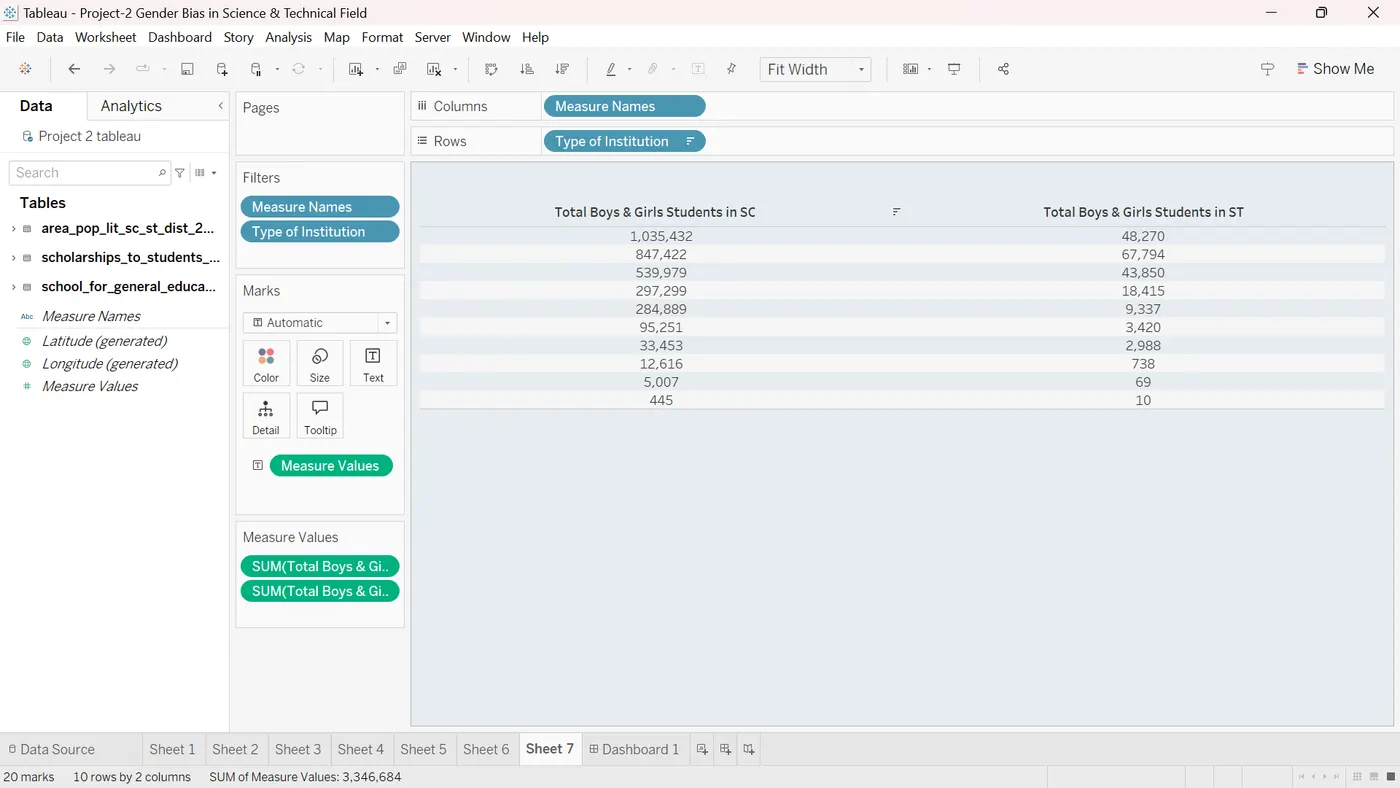
The data shows that the students are preferring state schools than central schools. Most of the SC & ST students are completing Middle schools, but there is comparitively less number in Matriculation.
And also there is less number of teachers for higher secondary school-State board.
- DASHBOARD