Project 2 - Gender Bias in Science and Technical field
Tableau Project 2 | Tableau Public
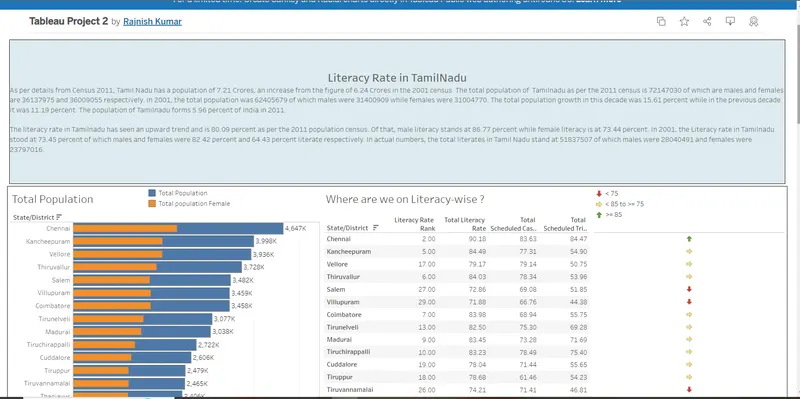
This dashboard empowers mission-driven organizations to harness the power of data visualization for social change. The data set talks about the literacy rates in Tamilnadu. It is distributed according to the cities and their ranks. It contains the population, as per gender.
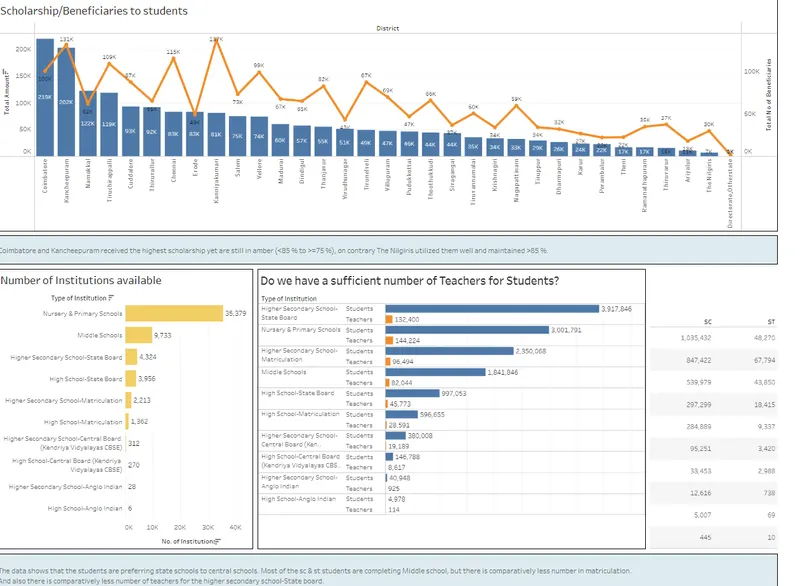
This dashboard gives us insight into the female population when compared to the total, and it addresses the question of where the state is literacy-wise. It shows us the status of each city and it also shows the scholarship/Beneficiaries each state is getting. The data has different institutions available and the number of teachers available.