Project 2 - EDA on Vehicle Insurance Customer Data
The goal of this project is to perform exploratory data analysis (EDA) on a dataset of vehicle insurance customers. The data contains information about the customers, such as their age, gender, driving history, and vehicle information. The goal of the EDA is to identify any patterns or trends in the data that could be used to improve the company's vehicle insurance products and services.
import numpy as np
import pandas as pd
from matplotlib import pyplot as plt
import seaborn as sns
# Loading the data files
customerDetails=pd.read_csv('customer_details.csv')
customerPolDetails=pd.read_csv('customer_policy_details.csv')
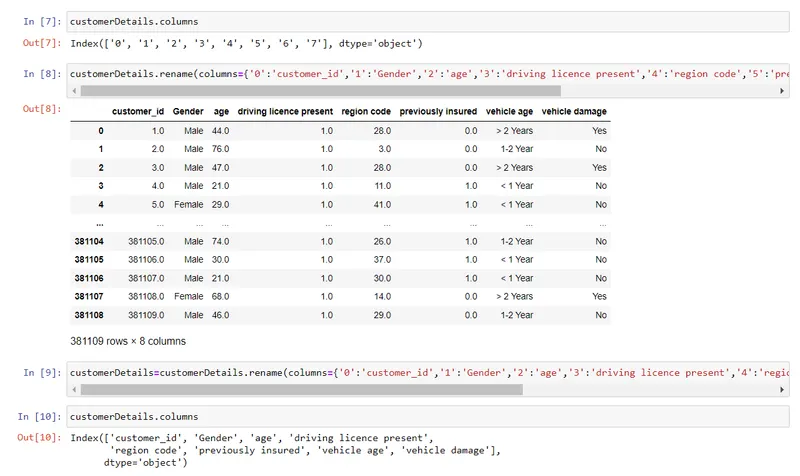
customerDetails.columns
customerDetails.rename(columns={'0':'customer_id','1':'Gender','2':'age','3':'driving licence present','4':'region code','5':'previously insured','6':'vehicle age','7':'vehicle damage'})
customerDetails=customerDetails.rename(columns={'0':'customer_id','1':'Gender','2':'age','3':'driving licence present','4':'region code','5':'previously insured','6':'vehicle age','7':'vehicle damage'})
customerDetails.columns
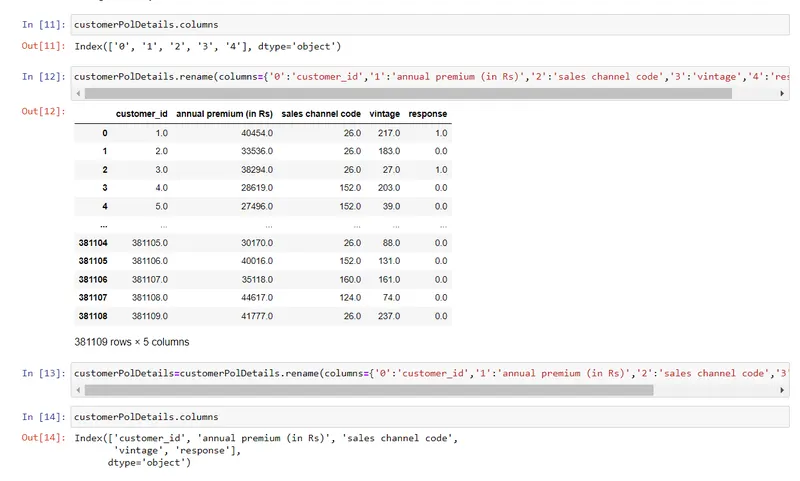
customerPolDetails.columns
customerPolDetails.rename(columns={'0':'customer_id','1':'annual premium (in Rs)','2':'sales channel code','3':'vintage','4':'response'})
customerPolDetails=customerPolDetails.rename(columns={'0':'customer_id','1':'annual premium (in Rs)','2':'sales channel code','3':'vintage','4':'response'})
customerPolDetails.columns
# Generate a summary of count of all the null values column wise.
customerDetails.isnull().sum()
customerPolDetails.isnull().sum()
customerDetails['customer_id'].isna().sum()
customerDetails['customer_id'].count()
customerPolDetails['customer_id'].isna().sum()
customerPolDetails['customer_id'].count()
## Replace all null values for numeric columns by mean.
## Drop Null values for customer_id
customerPolDetails = customerPolDetails.dropna(subset=['customer_id'])
customerPolDetails['customer_id'].mean()
customerPolDetails['annual premium (in Rs)'].fillna((customerPolDetails['annual premium (in Rs)'].mean()),inplace=True)
customerPolDetails['annual premium (in Rs)'].mean()
customerPolDetails['sales channel code'].fillna((customerPolDetails['sales channel code'].mean()),inplace=True)
customerPolDetails['sales channel code'].mean()
customerPolDetails['vintage'].fillna((customerPolDetails['vintage'].mean()),inplace=True)
customerPolDetails['vintage'].mean()
customerPolDetails['response'].fillna((customerPolDetails['response'].mean()),inplace=True)
customerPolDetails['response'].mean()
customerPolDetails.isnull().sum()
customerDetails = customerDetails.dropna(subset=['customer_id'])
customerDetails = customerDetails.dropna(subset=['vehicle damage'])
customerDetails = customerDetails.dropna(subset=['vehicle age'])
customerDetails = customerDetails.dropna(subset=['previously insured'])
customerDetails = customerDetails.dropna(subset=['region code'])
customerDetails = customerDetails.dropna(subset=['driving licence present'])
customerDetails = customerDetails.dropna(subset=['Gender'])
customerDetails = customerDetails.dropna(subset=['age'])
customerDetails['customer_id'].fillna((customerDetails['customer_id'].mode()), inplace=True)
customerDetails['Gender'].fillna((customerDetails['Gender'].mode().iloc[0]), inplace=True)
customerDetails['age'].fillna((customerDetails['age'].mode().iloc[0]), inplace=True)
customerDetails['region code'].fillna((customerDetails['region code'].mode().iloc[0]),inplace=True)
customerDetails['previously insured'].fillna((customerDetails['previously insured'].mode().iloc[0]),inplace=True)
customerDetails['vehicle age'].fillna((customerDetails['vehicle age'].mode().iloc[0]),inplace=True)
customerDetails['driving licence present'].fillna((customerDetails['driving licence present'].mode().iloc[0]),inplace=True)
customerDetails['vehicle damage'].fillna((customerDetails['vehicle damage'].mode().iloc[0]),inplace=True)
customerDetails.isnull().sum()
customerDetails.describe()
customerDetails.describe()
customerPolDetails.describe()
Q1=customerPolDetails.quantile(0.25)
Q3=customerPolDetails.quantile(0.75)
IQR=Q3-Q1
print(IQR)
customerDetails = customerDetails.rename(columns={'Gender':'Gender','driving licence present':'driving_licence_present','previously insured':'previously_insured','vehicle age':'vehicle_age','vehicle damage':'vehicle_damage'})
Gender = {'Male': 0, 'Female': 1}
driving_licence_present = {0: 0, 1: 1}
previously_insured = {0: 1, 1: 0}
vehicle_age = {'> 2 Years': 2, '1-2 Year': 1, '< 1 Year': 0}
vehicle_damage = {'Yes': 1, 'No': 0}
customerDetails['Gender'] = customerDetails['Gender'].map(Gender)
customerDetails['driving_licence_present'] = customerDetails['driving_licence_present'].map(driving_licence_present)
customerDetails['previously_insured'] = customerDetails['previously_insured'].map(previously_insured)
customerDetails['vehicle_age'] = customerDetails['vehicle_age'].map(vehicle_age)
customerDetails['vehicle_damage'] = customerDetails['vehicle_damage'].map(vehicle_damage)
customerDetails.head(2)
sns.boxplot(customerPolDetails['annual premium (in Rs)'])
percentile25 = customerPolDetails['annual premium (in Rs)'].quantile(0.25)
percentile75 = customerPolDetails['annual premium (in Rs)'].quantile(0.75)
iqr = np.subtract(*np.percentile(1, [75, 25]))
upper_limit = percentile75 + 1.5 * iqr
lower_limit = percentile25 - 1.5 * iqr
customerPolDetails[customerPolDetails['annual premium (in Rs)'] > upper_limit]
customerPolDetails[customerPolDetails['annual premium (in Rs)'] < lower_limit]
new_df = customerPolDetails[customerPolDetails['annual premium (in Rs)'] < upper_limit]
new_df.shape
plt.figure(figsize=(16,8))
plt.subplot(2,2,1)
sns.distplot(customerPolDetails['annual premium (in Rs)'])
plt.subplot(2,2,2)
sns.boxplot(customerPolDetails['annual premium (in Rs)'])
plt.subplot(2,2,3)
sns.distplot(new_df['annual premium (in Rs)'])
plt.subplot(2,2,4)
sns.boxplot(new_df['annual premium (in Rs)'])
plt.show()
sns.boxplot(customerPolDetails['vintage'])
sns.boxplot(customerPolDetails['sales channel code'])
sns.boxplot(customerPolDetails['response'])
# Outlier CustomerDetail :
sns.boxplot(customerDetails['age'])
sns.boxplot(customerDetails['vehicle_damage'])
sns.boxplot(customerDetails['previously_insured'])
sns.boxplot(customerDetails['region code'])
sns.boxplot(customerDetails['vehicle_age'])
# Remove white spaces
customerDetails.apply(lambda x : x.str.strip() if x.dtype == 'object' else x)
customerPolDetails.apply(lambda x : x.str.strip() if x.dtype == 'object' else x)
# case correction(lower or upper, any one)
customerDetails.apply(lambda x : x.str.upper() if x.dtype == 'object' else x)
# Convert nominal data (categorical) into dummies
# for future modeling use if required
dummy_variable = pd.get_dummies(customerDetails['vehicle_damage'])
dummy_variable.rename(columns={'No':'vehicle_damage - No','Yes':'vehicle_damage - Yes'}, inplace = True)
dummy_variable.head(5)
customerDetails = pd.concat([customerDetails, dummy_variable], axis = 1)
customerDetails.head(5)
# Drop Duplicates (duplicated rows)
customerDetails.drop("vehicle_damage", axis = 1, inplace =True)
customerDetails.head(5)
customerDetails
customerPolDetails
master_table = pd.merge(customerDetails,customerPolDetails)
master_table
master_table.set_index('customer_id')
## i: Gender wise average annual premium
plt.figure(figsize = (14, 5))
sns.distplot(master_table.loc[(master_table['Gender'] == 1), 'annual premium (in Rs)'])
sns.distplot(master_table.loc[(master_table['Gender'] == 0), 'annual premium (in Rs)'])
plt.title('Gender wise average annual premium', fontsize = 14)
plt.show()
## i: Age wise average annual premium
plt.figure(figsize = (14, 5))
sns.distplot(master_table.loc[(master_table['age'] == 44), 'annual premium (in Rs)'])
sns.distplot(master_table.loc[(master_table['age'] == 21), 'annual premium (in Rs)'])
plt.title('Age wise average annual premium', fontsize = 14)
plt.show()
## i: Gender wise average annual premium
plt.figure(figsize = (15, 6))
sns.distplot(master_table.loc[(master_table['driving_licence_present'] == 0), 'age'])
sns.distplot(master_table.loc[(master_table['driving_licence_present'] == 1), 'age'])
plt.title('Age distriution by license', fontsize = 15)
plt.show()
master_table
master_table.groupby('Gender',0).sum()
## iv: Vehicle age wise average annual premium.
plt.figure(figsize = (14, 5))
sns.distplot(master_table.loc[(master_table['vehicle_age'] == 2), 'annual premium (in Rs)'])
sns.distplot(master_table.loc[(master_table['vehicle_age'] == 1), 'annual premium (in Rs)'])
plt.title('vehicle age wise average annual premium', fontsize = 14)
plt.show()
corrMatrix = master_table.corr()
sns.heatmap(corrMatrix, annot = True)
plt.show()
Conclusion
The EDA on Vehicle Insurance Customer Data project will help the company to better understand its customers and identify any patterns or trends in the data that could be used to improve its products and services. The results of the EDA will be used to develop a set of recommendations for how the company can improve its vehicle insurance products and services.