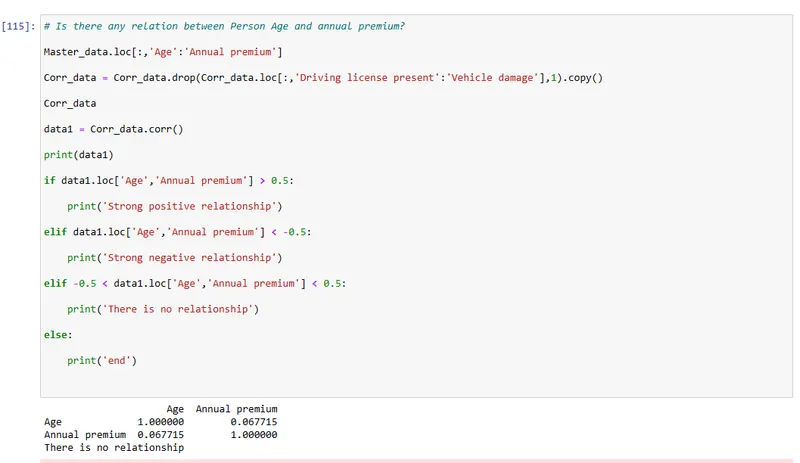
Project 2 - EDA on Vehicle Insurance Customer Data
By accessing below dumps created two data frames:

1)By importing pandas pakage
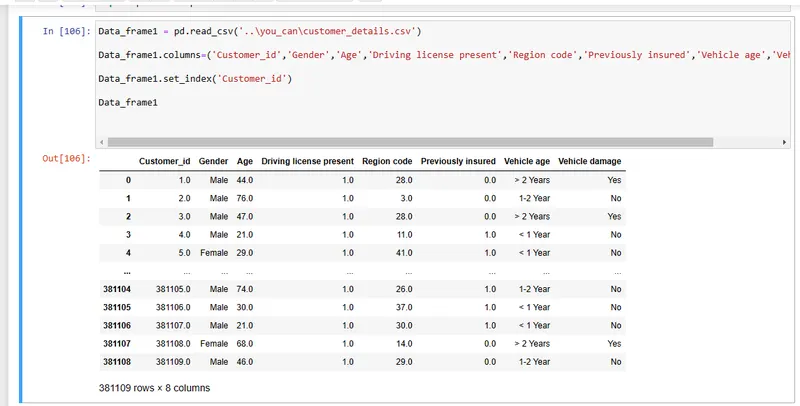
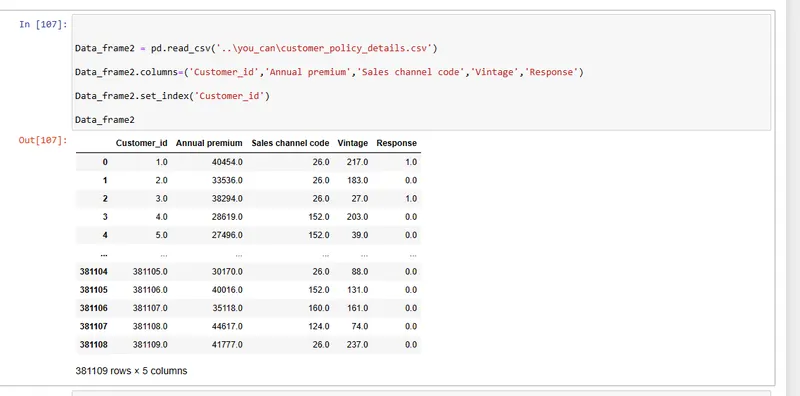
create Dataframes by restore data from attached file by using read_csv funtion and adding columns
Dataframe1:
Dataframe2:
2)by using aggregations and methods completed second query succesfullly.#Generate a summary of count of all the null values column wise:
print('*'*100)
print('Null Values')
print('Generated a summary of count of all the null values column wise for Customer_data:')
print('*'*100)
print(Data_frame1.isnull().sum())
print('*'*100)
print('Generated a summary of count of all the null values column wise for customer_policy_data:')
print('*'*100)
print(Data_frame2.isnull().sum())
print('*'*100)
##Drop Null values for customer_id because central tendencies for id’s is not feasible.
print('Droped Null values for customer_id because central tendencies for id’s is not feasible.::')
print('*'*100)
Data_frame1.dropna(subset=['Customer_id'],inplace=True)
print(Data_frame1.isnull().sum())
Data_frame2.dropna(subset=['Customer_id'],inplace=True)
print(Data_frame2.isnull().sum())
print('*'*100)
##Replace all null values for numeric columns by mean.
print('Replace all null values for numeric columns by mean')
list1=['Age','Driving license present','Region code','Previously insured']
for data in list1:
Data_frame1[data]=Data_frame1[data].fillna(Data_frame1[data].mean())
print(Data_frame1.isnull().sum())
list2 =['Annual premium','Sales channel code','Vintage','Response']
for data in list2:
Data_frame2[data]=Data_frame2[data].fillna(Data_frame2[data].mean())
print(Data_frame1.isnull().sum())
print('Succesfully replaced all null values for numeric columns by mean')
print('*'*100)
##Replace all null values for Categorical value by mode.
print('Replace all null values for Categorical value by mode.')
list_categorical1 = ['Gender','Vehicle age','Vehicle damage']
for data in list_categorical1:
Data_frame1[data]=Data_frame1[data].fillna(Data_frame1[data].mode().iloc[0])
print(Data_frame1.isnull().sum())
print('Succesfully Replaced all null values for Categorical value by mode.')
print('*'*100)
#Generate a summary of count of all the outliers column wise
print('Generated a summary of count of all the outliers column wise::')
print('*'*100)
df = Data_frame1.loc[:,'Age':'Previously insured']
Q1 = df.quantile(0.25)
Q3 = df.quantile(0.75)
IQR = Q3 - Q1
print(((df < (Q1 - 1.5 * IQR)) | (df > (Q3 + 1.5 * IQR))).sum())
print(df.groupby(['Driving license present']).count())
print('*'*100)
#Replace all outlier values for numeric columns by mean.
print('Replace all outlier values for numeric columns by mean::')
print('*'*100)
replace = (df < (Q1 - 1.5 * IQR)) | (df > (Q3 + 1.5 * IQR))
df[replace]=df['Driving license present'].mean()
print(((df < (Q1 - 1.5 * IQR)) | (df > (Q3 + 1.5 * IQR))).sum())
print('Replace all outlier values for numeric columns by mean::\n',df.groupby(['Driving license present']).count())
Outputs:
****************************************************************************************************
Null Values
Generated a summary of count of all the null values column wise for Customer_data:
****************************************************************************************************
Customer_id                386
Gender                     368
Age                        368
Driving license present    393
Region code                392
Previously insured         381
Vehicle age                381
Vehicle damage             407
dtype: int64
****************************************************************************************************
Generated a summary of count of all the null values column wise for customer_policy_data:
****************************************************************************************************
Customer_id           387
Annual premium        346
Sales channel code    400
Vintage               388
Response              361
dtype: int64
****************************************************************************************************
Droped Null values for customer_id because central tendencies for id’s is not feasible.::
****************************************************************************************************
Customer_id                  0
Gender                     368
Age                        366
Driving license present    392
Region code                391
Previously insured         381
Vehicle age                381
Vehicle damage             406
dtype: int64
Customer_id             0
Annual premium        344
Sales channel code    400
Vintage               388
Response              361
dtype: int64
****************************************************************************************************
Replace all null values for numeric columns by mean
Customer_id                  0
Gender                     368
Age                          0
Driving license present      0
Region code                  0
Previously insured           0
Vehicle age                381
Vehicle damage             406
dtype: int64
Customer_id                  0
Gender                     368
Age                          0
Driving license present      0
Region code                  0
Previously insured           0
Vehicle age                381
Vehicle damage             406
dtype: int64
Succesfully replaced all null values for numeric columns by mean
****************************************************************************************************
Replace all null values for Categorical value by mode.
Customer_id                0
Gender                     0
Age                        0
Driving license present    0
Region code                0
Previously insured         0
Vehicle age                0
Vehicle damage             0
dtype: int64
Succesfully Replaced all null values for Categorical value by mode.
****************************************************************************************************
Generated a summary of count of all the outliers column wise::
****************************************************************************************************
Age                           0
Driving license present    1203
Region code                   0
Previously insured            0
dtype: int64
                            Age  Region code  Previously insured
Driving license present
0.000000                    811          811                 811
0.997868                    392          392                 392
1.000000                 379520       379520              379520
****************************************************************************************************
Replace all outlier values for numeric columns by mean::
****************************************************************************************************
Age                           0
Driving license present    1203
Region code                   0
Previously insured            0
dtype: int64
Replace all outlier values for numeric columns by mean::
                             Age  Region code  Previously insured
Driving license present
0.997868                   1203         1203                1203
1.000000                 379520       379520              379520
By using Strip() , upper() fuction ,get_dummies and drop_duplicates
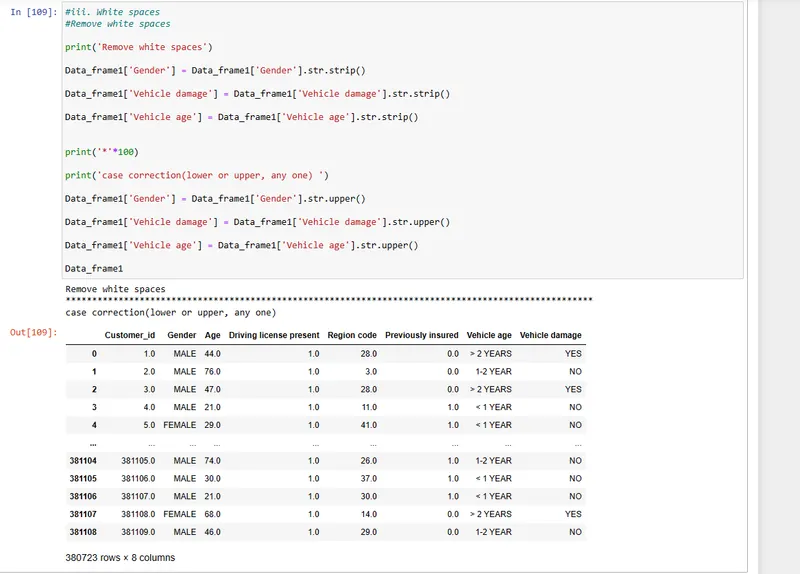
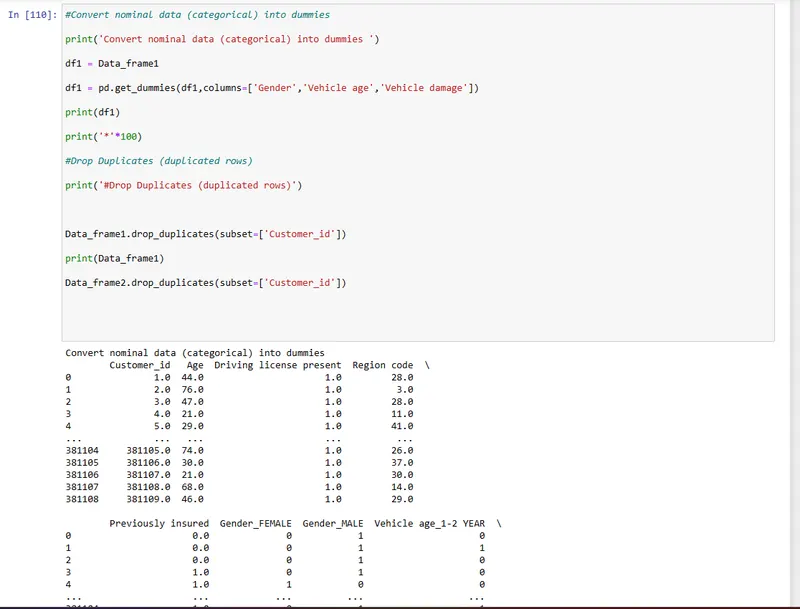
3)
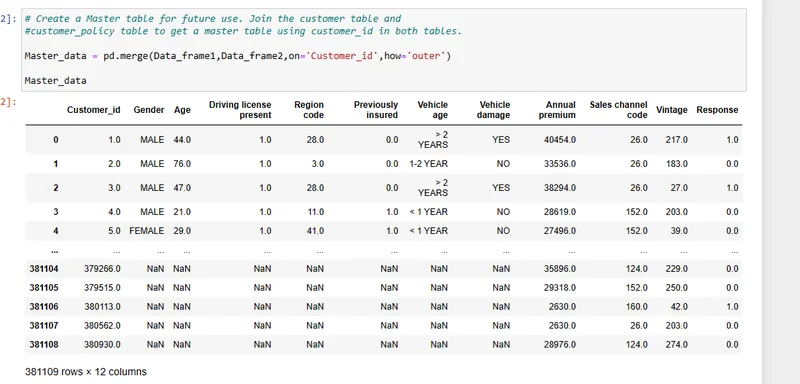
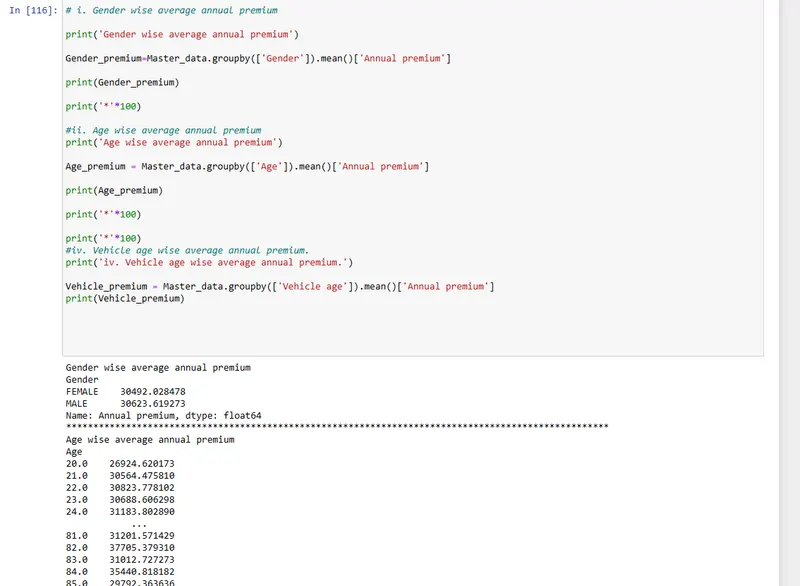
4)Groupby aggregation
5)by corr()