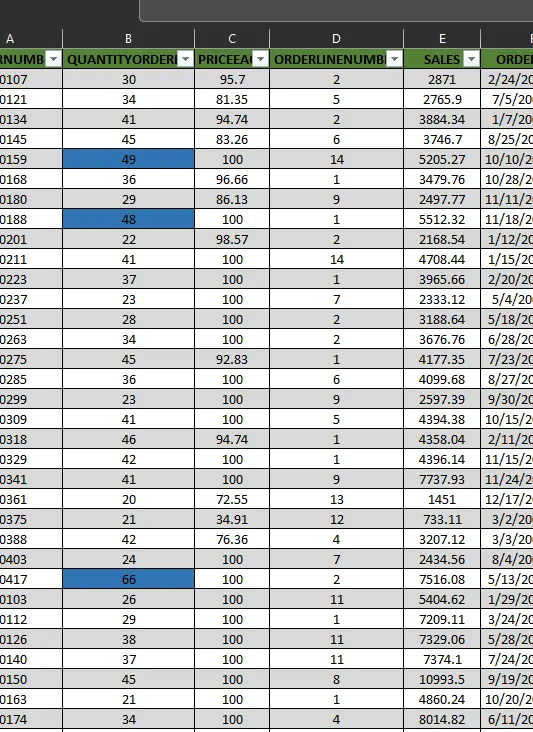
Project 1 - Data Cleaning and Transformation using Pivot table and Charts for the Report on requirement of Team Hiring
a)By Using Table Formats
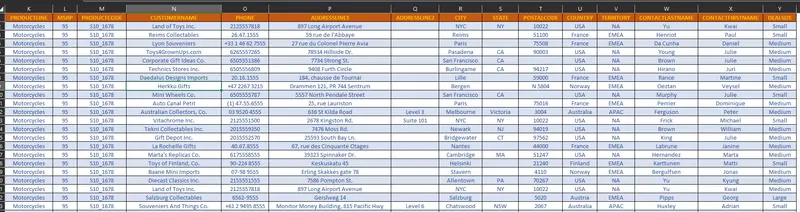
B)Generated Outcome BY Using SUM(),AVG(),STD.S(),VAR.S(),MAX(),MIN() Funtions
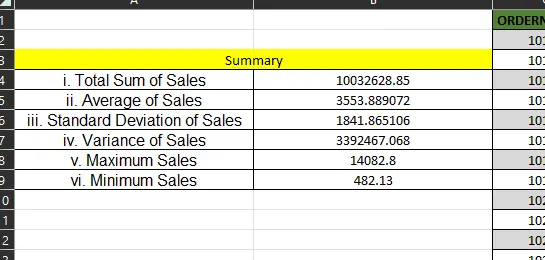
C)
Pivot table.
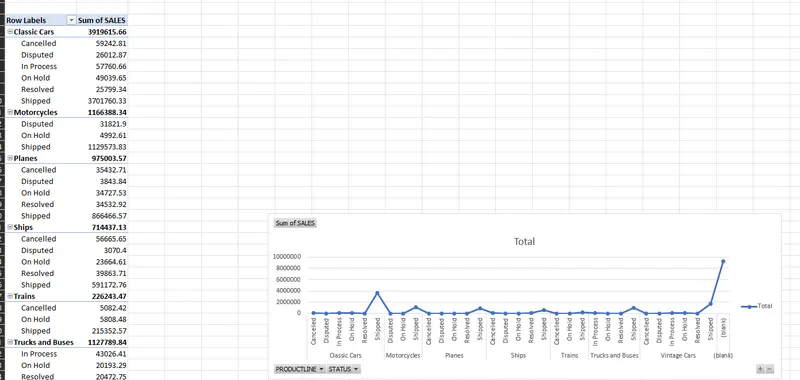
D)
Customized Ribbon "ABC".

e)Pivot Table.
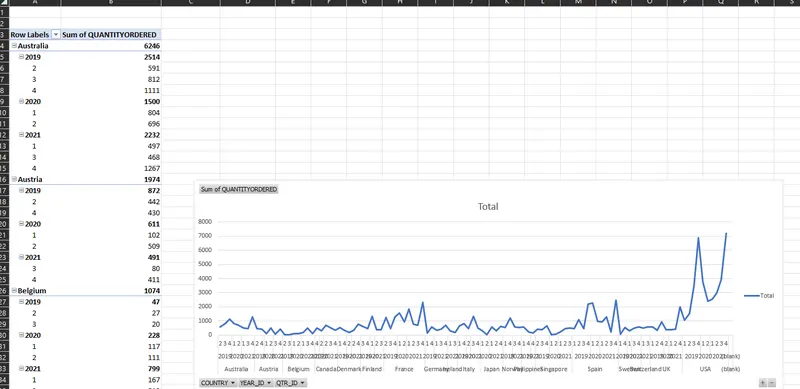
f)Generated by using Conditional text format.
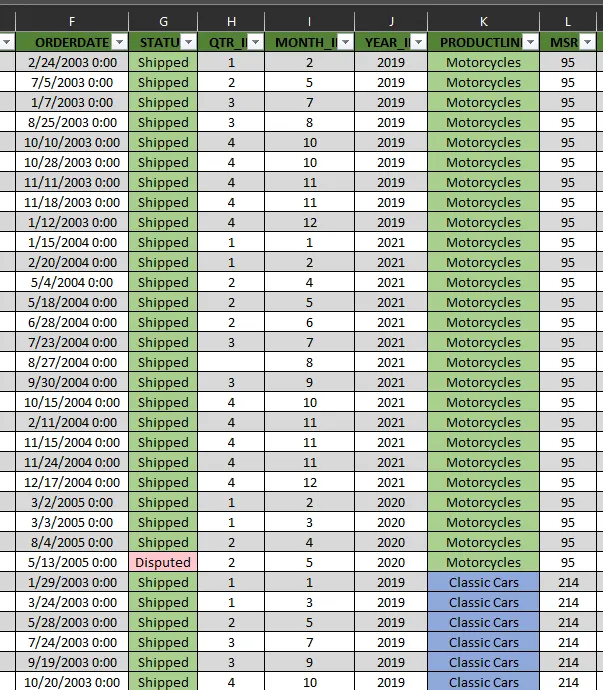
G)
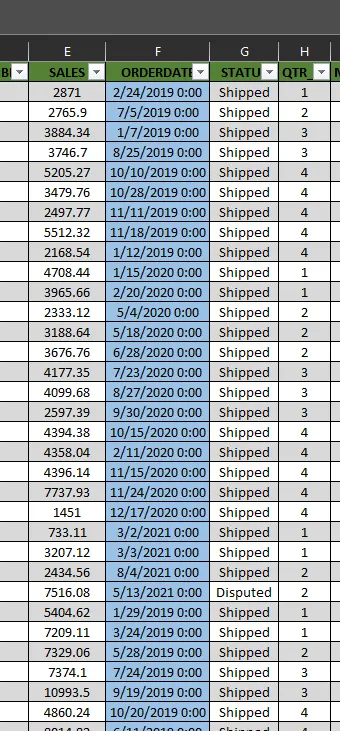
Used Replace (Ctrl+H) Method to replace the Years.
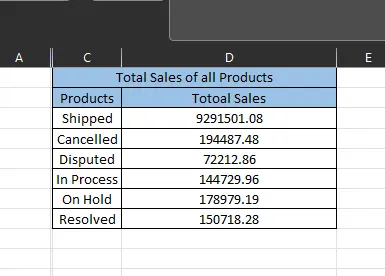
H)Generated outcome by using =Sumif() funtion.
I)
Generated Outcome by using left() and right() funtions.
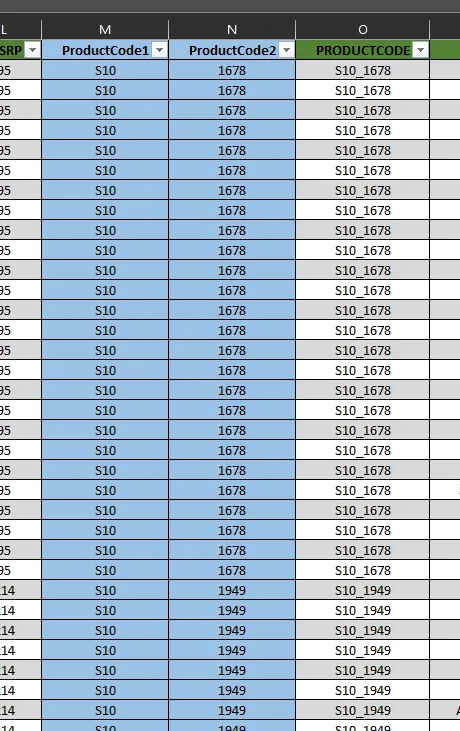
j)
By Using Conditional format.