Project 2 - EDA on Vehicle Insurance Customer Data
Project - 2 :
EDA on Vehicle Insurance Customer Data

A company has customer data that contains 8 columns of customer details and another table having name customer_policy data contains the policy details of the customer.
The company intends to offer some discount in premium for certain customers. To do that they ask their Data scientist team to get some information. Hence, following tasks DS team decided to perform:
# import

import pandas as pd
import numpy as np
import matplotlib.pyplot as plt
1.Adding column names to both datasets
# ================Loading data into files===============================

df1=pd.read_csv("customer_details.csv")
df1 # printing customer details table
| 0 | 1 | 2 | 3 | 4 | 5 | 6 | 7 | |
|---|---|---|---|---|---|---|---|---|
| 0 | 1.0 | Male | 44.0 | 1.0 | 28.0 | 0.0 | > 2 Years | Yes |
| 1 | 2.0 | Male | 76.0 | 1.0 | 3.0 | 0.0 | 1-2 Year | No |
| 2 | 3.0 | Male | 47.0 | 1.0 | 28.0 | 0.0 | > 2 Years | Yes |
| 3 | 4.0 | Male | 21.0 | 1.0 | 11.0 | 1.0 | < 1 Year | No |
| 4 | 5.0 | Female | 29.0 | 1.0 | 41.0 | 1.0 | < 1 Year | No |
| ... | ... | ... | ... | ... | ... | ... | ... | ... |
| 381104 | 381105.0 | Male | 74.0 | 1.0 | 26.0 | 1.0 | 1-2 Year | No |
| 381105 | 381106.0 | Male | 30.0 | 1.0 | 37.0 | 1.0 | < 1 Year | No |
| 381106 | 381107.0 | Male | 21.0 | 1.0 | 30.0 | 1.0 | < 1 Year | No |
| 381107 | 381108.0 | Female | 68.0 | 1.0 | 14.0 | 0.0 | > 2 Years | Yes |
| 381108 | 381109.0 | Male | 46.0 | 1.0 | 29.0 | 0.0 | 1-2 Year | No |
381109 rows × 8 columns
df2=pd.read_csv("customer_policy_details.csv")
df2 #printing customer policy details table
| 0 | 1 | 2 | 3 | 4 | |
|---|---|---|---|---|---|
| 0 | 1.0 | 40454.0 | 26.0 | 217.0 | 1.0 |
| 1 | 2.0 | 33536.0 | 26.0 | 183.0 | 0.0 |
| 2 | 3.0 | 38294.0 | 26.0 | 27.0 | 1.0 |
| 3 | 4.0 | 28619.0 | 152.0 | 203.0 | 0.0 |
| 4 | 5.0 | 27496.0 | 152.0 | 39.0 | 0.0 |
| ... | ... | ... | ... | ... | ... |
| 381104 | 381105.0 | 30170.0 | 26.0 | 88.0 | 0.0 |
| 381105 | 381106.0 | 40016.0 | 152.0 | 131.0 | 0.0 |
| 381106 | 381107.0 | 35118.0 | 160.0 | 161.0 | 0.0 |
| 381107 | 381108.0 | 44617.0 | 124.0 | 74.0 | 0.0 |
| 381108 | 381109.0 | 41777.0 | 26.0 | 237.0 | 0.0 |
381109 rows × 5 columns
# 1...(1)~ Adding coulumn names to customer details table-

df1.columns= ['customer_id','Gender','Age','Driving license present','region code','previously insured','vehicle age','vehicle damage']
df1 # Printing the customer policy table with column names
| customer_id | Gender | Age | Driving license present | region code | previously insured | vehicle age | vehicle damage | |
|---|---|---|---|---|---|---|---|---|
| 0 | 1.0 | Male | 44.0 | 1.0 | 28.0 | 0.0 | > 2 Years | Yes |
| 1 | 2.0 | Male | 76.0 | 1.0 | 3.0 | 0.0 | 1-2 Year | No |
| 2 | 3.0 | Male | 47.0 | 1.0 | 28.0 | 0.0 | > 2 Years | Yes |
| 3 | 4.0 | Male | 21.0 | 1.0 | 11.0 | 1.0 | < 1 Year | No |
| 4 | 5.0 | Female | 29.0 | 1.0 | 41.0 | 1.0 | < 1 Year | No |
| ... | ... | ... | ... | ... | ... | ... | ... | ... |
| 381104 | 381105.0 | Male | 74.0 | 1.0 | 26.0 | 1.0 | 1-2 Year | No |
| 381105 | 381106.0 | Male | 30.0 | 1.0 | 37.0 | 1.0 | < 1 Year | No |
| 381106 | 381107.0 | Male | 21.0 | 1.0 | 30.0 | 1.0 | < 1 Year | No |
| 381107 | 381108.0 | Female | 68.0 | 1.0 | 14.0 | 0.0 | > 2 Years | Yes |
| 381108 | 381109.0 | Male | 46.0 | 1.0 | 29.0 | 0.0 | 1-2 Year | No |
381109 rows × 8 columns
# 1...(2)~ Adding columns to the customer policy details table

df2.columns=['customer_id','annual premium (in Rs)','sales channel code','vintage','response']
df2 # Printing the customer policy table with column names
| customer_id | annual premium (in Rs) | sales channel code | vintage | response | |
|---|---|---|---|---|---|
| 0 | 1.0 | 40454.0 | 26.0 | 217.0 | 1.0 |
| 1 | 2.0 | 33536.0 | 26.0 | 183.0 | 0.0 |
| 2 | 3.0 | 38294.0 | 26.0 | 27.0 | 1.0 |
| 3 | 4.0 | 28619.0 | 152.0 | 203.0 | 0.0 |
| 4 | 5.0 | 27496.0 | 152.0 | 39.0 | 0.0 |
| ... | ... | ... | ... | ... | ... |
| 381104 | 381105.0 | 30170.0 | 26.0 | 88.0 | 0.0 |
| 381105 | 381106.0 | 40016.0 | 152.0 | 131.0 | 0.0 |
| 381106 | 381107.0 | 35118.0 | 160.0 | 161.0 | 0.0 |
| 381107 | 381108.0 | 44617.0 | 124.0 | 74.0 | 0.0 |
| 381108 | 381109.0 | 41777.0 | 26.0 | 237.0 | 0.0 |
381109 rows × 5 columns
2.Checking and Cleaning Data Quality
'''
2) Checking and cleaning data quality

 i) Null Values

    a) ~ Generating the summary of count all the null values column wise for customer details table
'''

df1_null = df1.isnull()
print(' n True = Null values in customer details table,n -------------------- n False = Not Null values in customer details table : n ------------------')
for i in df1_null.columns.values.tolist():
    print(i)
    print("-"*26)
    print(df1_null[i].value_counts())
    print("-"*26)
 True = Null values in customer details table,
 --------------------
 False = Not Null values in customer details table :
 ------------------
customer_id
--------------------------
False    380723
True        386
Name: customer_id, dtype: int64
--------------------------
Gender
--------------------------
False    380741
True        368
Name: Gender, dtype: int64
--------------------------
Age
--------------------------
False    380741
True        368
Name: Age, dtype: int64
--------------------------
Driving license present
--------------------------
False    380716
True        393
Name: Driving license present, dtype: int64
--------------------------
region code
--------------------------
False    380717
True        392
Name: region code, dtype: int64
--------------------------
previously insured
--------------------------
False    380728
True        381
Name: previously insured, dtype: int64
--------------------------
vehicle age
--------------------------
False    380728
True        381
Name: vehicle age, dtype: int64
--------------------------
vehicle damage
--------------------------
False    380702
True        407
Name: vehicle damage, dtype: int64
--------------------------
~ SUMMARY OF NULL VALUES ON CUSTOMER DETAILS TABLE ~
Customer_Id has 386 Null values
Gender has 368 Null values
age has 368 Null values
driving license present has 393 Null values
region code has 392 Null values
previously insured has 381 Null values
vehicle age has 381 Null values
vehicle damage has 407 Null values
'''
2)-i) Null Values

      a) ~ Generating the summmary of couunt all the null values column wise for customer-policy-details table
'''
df2_null = df2.isnull()
print(' n True = Null values in customer-policy-details table,n -------------------- n False = Not Null values in customer-policy- details table : n ------------------')
for i in df2_null.columns.values.tolist():
    print(i)
    print("-"*26)
    print(df2_null[i].value_counts())
    print("-"*26)
 True = Null values in customer-policy-details table,
 --------------------
 False = Not Null values in customer-policy- details table :
 ------------------
customer_id
--------------------------
False    380722
True        387
Name: customer_id, dtype: int64
--------------------------
annual premium (in Rs)
--------------------------
False    380763
True        346
Name: annual premium (in Rs), dtype: int64
--------------------------
sales channel code
--------------------------
False    380709
True        400
Name: sales channel code, dtype: int64
--------------------------
vintage
--------------------------
False    380721
True        388
Name: vintage, dtype: int64
--------------------------
response
--------------------------
False    380748
True        361
Name: response, dtype: int64
--------------------------
~ SUMMARY OF NULL VALUES ON CUSTOMER -POLICY- DETAILS TABLE ~
Customer_Id has 387 Null values
annual premium has 346 Null values
sales channel code has 400 Null values
vintage has 388 Null values
response has 361 Null values
# 2).i) Null Values
#       b) ~ Dropping Null Values for Customer _id for customer details table


df1.dropna(subset=['customer_id'],inplace=True)
print(' customer details table n Null values in customer_id column after dropping null values :',df1['customer_id'].isna().sum())
 customer details table
 Null values in customer_id column after dropping  null values : 0
# 2).i) Null Values
#       b) ~ Dropping Null Values for Customer _id in customer-policy-details table

df2.dropna(subset=['customer_id'],inplace=True)
print(' customer-policy-details table n Null values in customer_id column after dropping null values :',df2['customer_id'].isna().sum())
 customer-policy-details table
 Null values in customer_id column after dropping  null values : 0
'''
2).i)Null Values

c) Replace all values for numeric columns by mean

'''
df1.head()
| customer_id | Gender | Age | Driving license present | region code | previously insured | vehicle age | vehicle damage | |
|---|---|---|---|---|---|---|---|---|
| 0 | 1.0 | Male | 44.0 | 1.0 | 28.0 | 0.0 | > 2 Years | Yes |
| 1 | 2.0 | Male | 76.0 | 1.0 | 3.0 | 0.0 | 1-2 Year | No |
| 2 | 3.0 | Male | 47.0 | 1.0 | 28.0 | 0.0 | > 2 Years | Yes |
| 3 | 4.0 | Male | 21.0 | 1.0 | 11.0 | 1.0 | < 1 Year | No |
| 4 | 5.0 | Female | 29.0 | 1.0 | 41.0 | 1.0 | < 1 Year | No |
From customer details table,
age and region code contains numerical data
driving license present and previously insured contains categorical data
# Replacing the null values of age by its mean value

df1['Age'].fillna(df1['Age'].mean(),inplace=True)
print(' Null values in Age column after dropping null values :',df1['Age'].isna().sum())
Null values in Age column after dropping null values : 0
# Replacing the null values of region code by its mean value

df1['region code'].fillna(df1['region code'].mean(),inplace=True)
print(' Null values in region code column after dropping null values :',df1['region code'].isna().sum())
Null values in region code column after dropping null values : 0
df2.head()
| customer_id | annual premium (in Rs) | sales channel code | vintage | response | |
|---|---|---|---|---|---|
| 0 | 1.0 | 40454.0 | 26.0 | 217.0 | 1.0 |
| 1 | 2.0 | 33536.0 | 26.0 | 183.0 | 0.0 |
| 2 | 3.0 | 38294.0 | 26.0 | 27.0 | 1.0 |
| 3 | 4.0 | 28619.0 | 152.0 | 203.0 | 0.0 |
| 4 | 5.0 | 27496.0 | 152.0 | 39.0 | 0.0 |
From customer-policy-details table,
annual premium, sales channel code and vintage contains numerical data
response has categorical data
# Replacing the null values of annual premium by its mean value

df2['annual premium (in Rs)'].fillna(df2['annual premium (in Rs)'].mean(),inplace=True)
print(' Null values in annual premium (in Rs) column after dropping null values :',df2['annual premium (in Rs)'].isna().sum())
Null values in annual premium (in Rs) column after dropping null values : 0
# Replacing the null values of channel code by its mean value

df2['sales channel code'].fillna(df2['sales channel code'].mean(),inplace=True)
print(' Null values in sales channel code column after dropping null values :',df2['sales channel code'].isna().sum())
Null values in sales channel code column after dropping null values : 0
# Replacing the null values of vintage by its mean value

df2['vintage'].fillna(df2['vintage'].mean(),inplace=True)
print(' Null values in vintage column after dropping null values :',df2['vintage'].isna().sum())
Null values in vintage column after dropping null values : 0
'''
2).i)Null Values

    d) Replacing categorical null values by its mode

'''
# Replacing the null values of driving license present by its mode value

df1['Driving license present'].fillna(df1['Driving license present'].mode()[0],inplace=True)
print(' Null values in Driving license present column after dropping null values :',df1['Driving license present'].isna().sum())
Null values in Driving license present column after dropping null values : 0
# Replacing the null values of previously insured by its mode value

df1['previously insured'].fillna(df1['previously insured'].mode()[0],inplace=True)
print(' Null values in previously insured column after dropping null values :',df1['previously insured'].isna().sum())
Null values in previously insured column after dropping null values : 0
# Replacing the null values of vintage by its mode value

df2['vintage'].fillna(df2['vintage'].mode()[0],inplace=True)
print(' Null values in previously insured column after dropping null values :',df2['vintage'].isna().sum())
Null values in previously insured column after dropping null values : 0
'''
2.(ii). OUTLIERS

a) Generate the summary of count of all the null values column wise

'''
df1.describe()
| customer_id | Age | Driving license present | region code | previously insured | |
|---|---|---|---|---|---|
| count | 380723.000000 | 380723.000000 | 380723.000000 | 380723.000000 | 380723.000000 |
| mean | 190548.776244 | 38.822788 | 0.997870 | 26.389436 | 0.457800 |
| std | 110016.805160 | 15.504826 | 0.046105 | 13.223671 | 0.498217 |
| min | 1.000000 | 20.000000 | 0.000000 | 0.000000 | 0.000000 |
| 25% | 95269.500000 | 25.000000 | 1.000000 | 15.000000 | 0.000000 |
| 50% | 190543.000000 | 36.000000 | 1.000000 | 28.000000 | 0.000000 |
| 75% | 285822.500000 | 49.000000 | 1.000000 | 35.000000 | 1.000000 |
| max | 381109.000000 | 85.000000 | 1.000000 | 52.000000 | 1.000000 |
Q1=df1.describe().loc["25%","Age"]
Q3=df1.describe().loc["75%","Age"]

IQR=Q3-Q1

print('Customer details table')
print('Outliers present in age column are :',df1.loc[df1["Age"]<(Q1-IQR*1.5),"Age"].count())
print('Outliers present in age column are :',df1.loc[df1["Age"]>(Q3+IQR*1.5),"Age"].count())
Customer details table
Outliers present in age column are : 0
Outliers present in age column are : 0
Q1=df1.describe().loc["25%","region code"]
Q3=df1.describe().loc["75%","region code"]

IQR=Q3-Q1

print('Customer details table')
print('Outliers present in region code column are :',df1.loc[df1["region code"]<(Q1-IQR*1.5),"region code"].count())
print('Outliers present in region code column are :',df1.loc[df1["region code"]>(Q3+IQR*1.5),"region code"].count())
Customer details table
Outliers present in region code column are : 0
Outliers present in region code column are : 0
df2.describe()
| customer_id | annual premium (in Rs) | sales channel code | vintage | response | |
|---|---|---|---|---|---|
| count | 380722.000000 | 380722.000000 | 380722.000000 | 380722.000000 | 380361.000000 |
| mean | 190547.491663 | 30563.999774 | 112.036687 | 154.347192 | 0.122526 |
| std | 110013.824148 | 17190.147550 | 54.177046 | 83.628096 | 0.327892 |
| min | 1.000000 | 2630.000000 | 1.000000 | 10.000000 | 0.000000 |
| 25% | 95276.250000 | 24416.000000 | 29.000000 | 82.000000 | 0.000000 |
| 50% | 190536.500000 | 31656.000000 | 131.000000 | 154.000000 | 0.000000 |
| 75% | 285818.750000 | 39391.750000 | 152.000000 | 227.000000 | 0.000000 |
| max | 381109.000000 | 540165.000000 | 163.000000 | 299.000000 | 1.000000 |
Q1=df2.describe().loc["25%","annual premium (in Rs)"]
Q3=df2.describe().loc["75%","annual premium (in Rs)"]

IQR=Q3-Q1

print('Customer-policy-details table')
print('Outliers present in annual premium (in Rs)  column are :',df2.loc[df2["annual premium (in Rs)"]<(Q1-IQR*1.5),"annual premium (in Rs)"].count())
print('Outliers present in annual premium (in Rs)  column are :',df2.loc[df2["annual premium (in Rs)"]>(Q3+IQR*1.5),"annual premium (in Rs)"].count())
Customer-policy-details table
Outliers present in annual premium (in Rs)  column are : 0
Outliers present in annual premium (in Rs)  column are : 10332
Q1=df2.describe().loc["25%","vintage"]
Q3=df2.describe().loc["75%","vintage"]

IQR=Q3-Q1

print('Customer-policy-details table')
print('Outliers present in vintage column are :',df2.loc[df2["vintage"]<(Q1-IQR*1.5),"vintage"].count())
print('Outliers present in vintage column are :',df2.loc[df2["vintage"]>(Q3+IQR*1.5),"vintage"].count())
Customer-policy-details table
Outliers present in vintage column are : 0
Outliers present in vintage column are : 0
'''
2.(ii).

 (b) Replacing the outliers with mean values

'''
# We are replacing the outliers of annual premium (in Rs) column with mean values in customer-policy-details table


mean=df2["annual premium (in Rs)"].mean()
print('Mean of annual premium (in Rs) column values: ',mean)
Mean of annual premium (in Rs) column values: 30563.99977390893
def replace_outlier(df):
    q1=df.quantile(0.25)
    q3=df.quantile(0.75)
    iqr=q3-q1
    upper=df[~(df>(q3+1.5*iqr))].max()
    lower=df[~(df<(q1-1.5*iqr))].min()
    df=np.where(df>upper,df.mean(),np.where(df<lower,df.mean(),df))
    return df
df2["annual premium (in Rs)"] = replace_outlier(df2["annual premium (in Rs)"])
df2['annual premium (in Rs)'] # Outliers are filled with mean values
0         40454.0
1         33536.0
2         38294.0
3         28619.0
4         27496.0
           ...
381104    30170.0
381105    40016.0
381106    35118.0
381107    44617.0
381108    41777.0
Name: annual premium (in Rs), Length: 380722, dtype: float64
'''
2).(iii)

  ~ Remove White spaces
    another way
'''

df1["Gender"]=df1["Gender"].str.strip()
df1["vehicle age"]=df1["vehicle age"].str.strip()
df1["vehicle damage"]=df1["vehicle damage"].str.strip()
'''
2).(iv).

    ~ Case Correction for customer details table

'''

df1["Gender"]=df1["Gender"].str.lower()
df1["vehicle age"]=df1["vehicle age"].str.lower()
df1["vehicle damage"]=df1["vehicle damage"].str.lower()
'''
2).(v).

    ~ Converting nominal data into dummies

'''

dummies_gender=pd.get_dummies(df1["Gender"])
dummies_vehicle_age=pd.get_dummies(df1["vehicle age"])
dummies_vehicle_damage=pd.get_dummies(df1["vehicle damage"])
dummies_dlp=pd.get_dummies(df1["Driving license present"])
dummies_pre=pd.get_dummies(df1["previously insured"])
# 2).(vi) Drop duplictates from customer details table

print(df1.duplicated().sum())
0
# 2).(vi) Drop duplictates from customer-policy-details table

print(df2.duplicated().sum())
0
df1.drop_duplicates(inplace=True) #dropping duplicates
df2.drop_duplicates(inplace=True) #dropping duplicates
3.Merging
# merging

mas_data=pd.merge(df1,df2,on='customer_id')
mas_data
| customer_id | Gender | Age | Driving license present | region code | previously insured | vehicle age | vehicle damage | annual premium (in Rs) | sales channel code | vintage | response | |
|---|---|---|---|---|---|---|---|---|---|---|---|---|
| 0 | 1.0 | male | 44.0 | 1.0 | 28.0 | 0.0 | > 2 years | yes | 40454.0 | 26.0 | 217.0 | 1.0 |
| 1 | 2.0 | male | 76.0 | 1.0 | 3.0 | 0.0 | 1-2 year | no | 33536.0 | 26.0 | 183.0 | 0.0 |
| 2 | 3.0 | male | 47.0 | 1.0 | 28.0 | 0.0 | > 2 years | yes | 38294.0 | 26.0 | 27.0 | 1.0 |
| 3 | 4.0 | male | 21.0 | 1.0 | 11.0 | 1.0 | < 1 year | no | 28619.0 | 152.0 | 203.0 | 0.0 |
| 4 | 5.0 | female | 29.0 | 1.0 | 41.0 | 1.0 | < 1 year | no | 27496.0 | 152.0 | 39.0 | 0.0 |
| ... | ... | ... | ... | ... | ... | ... | ... | ... | ... | ... | ... | ... |
| 380331 | 381105.0 | male | 74.0 | 1.0 | 26.0 | 1.0 | 1-2 year | no | 30170.0 | 26.0 | 88.0 | 0.0 |
| 380332 | 381106.0 | male | 30.0 | 1.0 | 37.0 | 1.0 | < 1 year | no | 40016.0 | 152.0 | 131.0 | 0.0 |
| 380333 | 381107.0 | male | 21.0 | 1.0 | 30.0 | 1.0 | < 1 year | no | 35118.0 | 160.0 | 161.0 | 0.0 |
| 380334 | 381108.0 | female | 68.0 | 1.0 | 14.0 | 0.0 | > 2 years | yes | 44617.0 | 124.0 | 74.0 | 0.0 |
| 380335 | 381109.0 | male | 46.0 | 1.0 | 29.0 | 0.0 | 1-2 year | no | 41777.0 | 26.0 | 237.0 | 0.0 |
380336 rows × 12 columns
4. Getting required data to make decisions for future growth
# 4. Getting required data for decisions

# 4....1) Gender wise average annual premium

gwiseanpl=mas_data.groupby(["Gender"])["annual premium (in Rs)"].mean()
gwiseanpl
Gender
female    29273.474247
male      29323.022594
Name: annual premium (in Rs), dtype: float64
# 4....2) Age wise average annual premium

agwise=mas_data.groupby(["Age"])["annual premium (in Rs)"].mean()
agwise
Age
20.0    26342.073517
21.0    29751.791916
22.0    29946.848634
23.0    29838.344763
24.0    30125.557096
            ...
81.0    29287.910702
82.0    36480.586199
83.0    28995.818172
84.0    35440.818182
85.0    26637.454525
Name: annual premium (in Rs), Length: 67, dtype: float64
# 4....3) Is your data balanced between the genders

mas_data.groupby('Gender').count()
| customer_id | Age | Driving license present | region code | previously insured | vehicle age | vehicle damage | annual premium (in Rs) | sales channel code | vintage | response | |
|---|---|---|---|---|---|---|---|---|---|---|---|
| Gender | |||||||||||
| female | 174485 | 174485 | 174485 | 174485 | 174485 | 174309 | 174300 | 174485 | 174485 | 174485 | 174329 |
| male | 205484 | 205484 | 205484 | 205484 | 205484 | 205279 | 205266 | 205484 | 205484 | 205484 | 205281 |
~ SUMMARY
The ratio between male and female is approximately 1.77
The data is balanced between the gender as the data for gender is approximately same
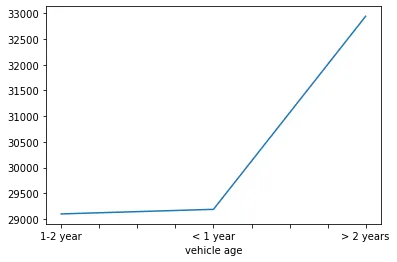
# 4....4) Vehicle age wise average plan

vwiseavp=mas_data.groupby(["vehicle age"])["annual premium (in Rs)"].mean()
vwiseavp
vehicle age
1-2 year     29099.066738
< 1 year     29188.150594
> 2 years    32943.540830
Name: annual premium (in Rs), dtype: float64
vwiseavp.plot() # line graph
<AxesSubplot:xlabel='vehicle age'>
5. Checking the relation between Person Age and Annual Premium
# 5. Is there any relation between person age and annual premium

n=mas_data['Age'].corr(mas_data["annual premium (in Rs)"])
n
0.0506575892861754
mas_data[['Age','annual premium (in Rs)']].corr()
| Age | annual premium (in Rs) | |
|---|---|---|
| Age | 1.000000 | 0.050658 |
| annual premium (in Rs) | 0.050658 | 1.000000 |
~ Summary
Since the pearson coefficient lies between 0.5 and -0.5
So,there is no relation between age and annual premium (in Rs)
Kindly, review the project
Regards,
Sai Sumanth Reddy