Project 2 - Development of TFT Cluster Speedometer Software Component
1.Develop the Simulink model based on the given requirements and also create SLDD file and link the same to the model.
Perform the complete V and V workflow for the obtained model.
Requirements:
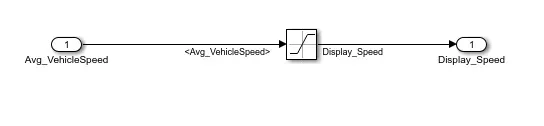
Calculating TFT Display Speed:
|
Average Vehicle Speed would be displayed only if its between 2 kmph & 250 kmph. Any value outside this range will be discarded by its lower limit & upper limit |
|
When Average Vehicle Speed is < 2 kmph, DisplaySpeed = 2 kmph |
|
When Average Vehicle Speed is in between 2 kmph & 250 kmph, Display Speed = Average Vehicle Speed |
|
When Average Vehicle Speed is > 250 kmph, Display Speed = 250 kmph |
1.2 Main Data Filtering:
|
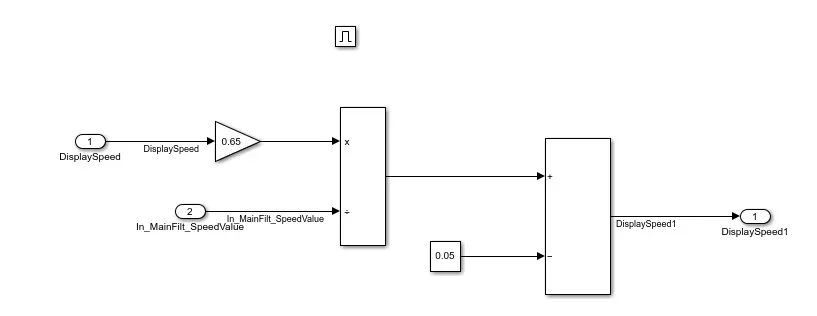
Main Data Filtering subsystem will be activated for every 10th millisecond |
|||||||||||||||||||||||||||||
|
DisplaySpeed1 (t) = ((DisplaySpeed (t) x 0.65)/ Main Filter Speed Value)- 0.05
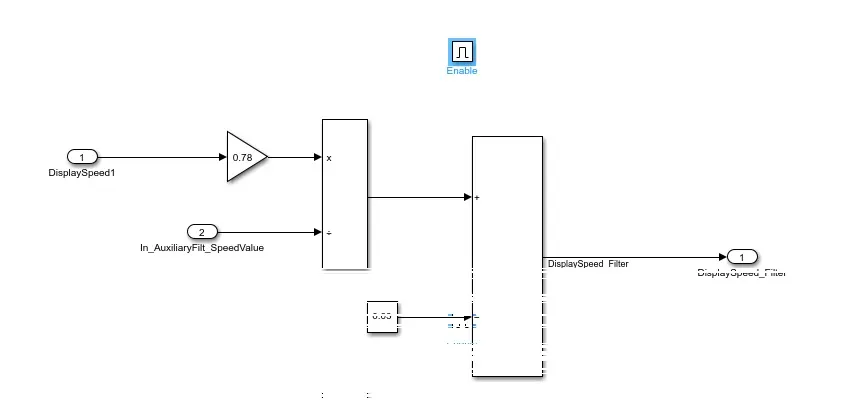
1.3 Auxiliary Data Filtering:
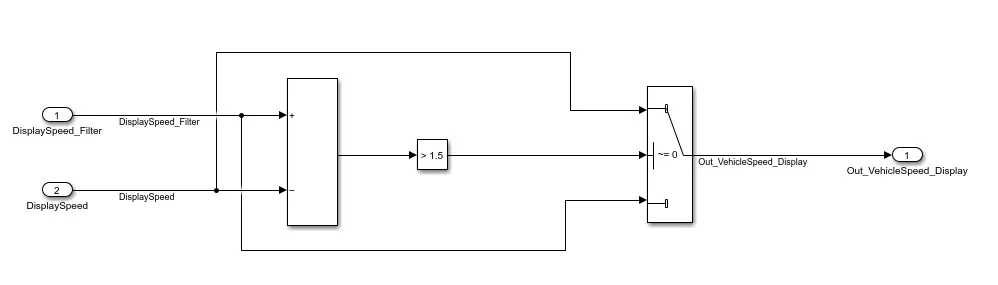
1.4 TFT Speed Output:
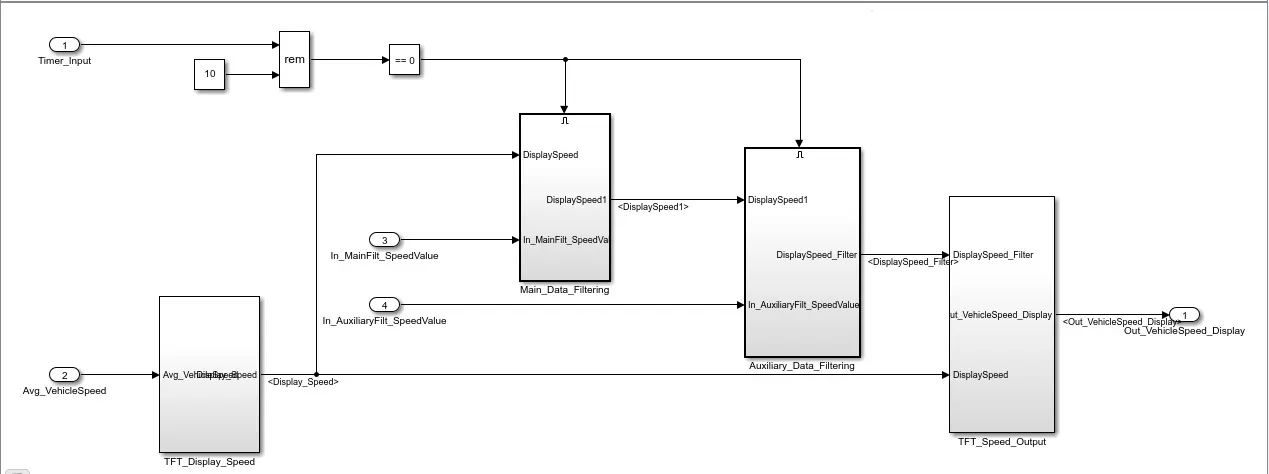
The final model looks like below:
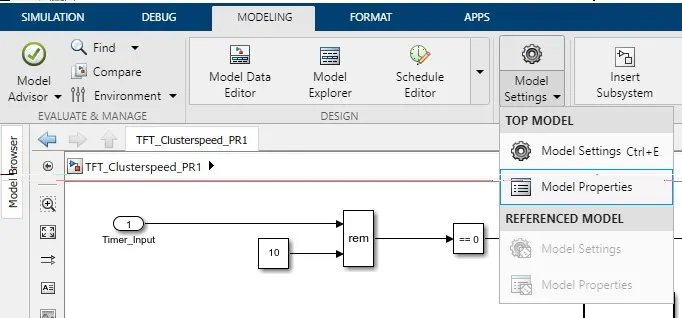
CASE-1:When Average Vehicle Speed is < 2 kmph, DisplaySpeed = 2 kmph Average Vehicle Speed is 1 display speed : 2kmph CASE-2:When Average Vehicle Speed is in between 2 kmph & 250 kmph, Display Speed = Average Vehicle Speed Average Vehicle Speed is 200 display speed : 200kmph CASE-3:When Average Vehicle Speed is > 250 kmph, Display Speed = 250 kmph Average Vehicle Speed is 260 display speed : 250 kmph 2.simulink data dictionary(SLDD). 2.To create SLDD(simulink data dictionary) Open modelling->goto modelling properties:
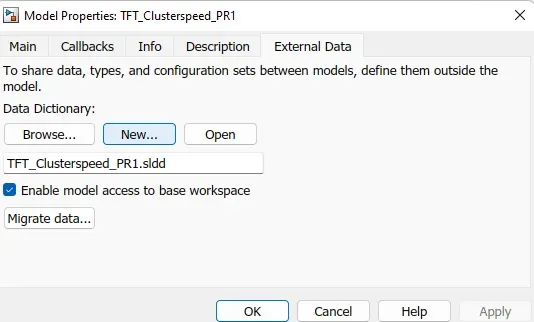
->click on External data ->New -> give name -> apply - ok:
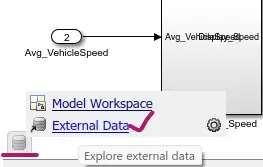
Now a symbol is shown below the model like below image:
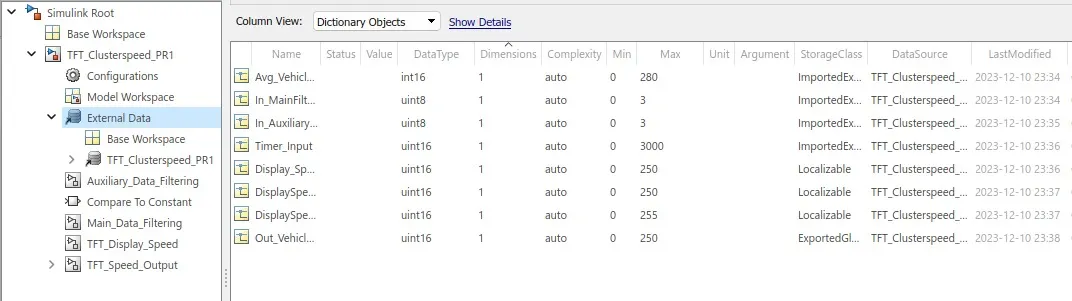
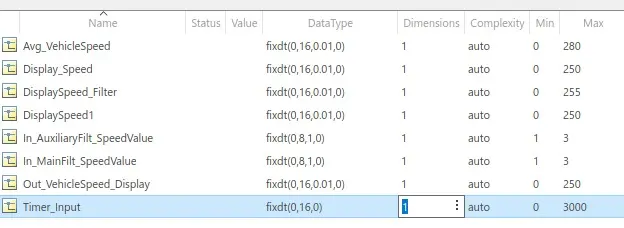
Now add all the simulink signals in design data like below:
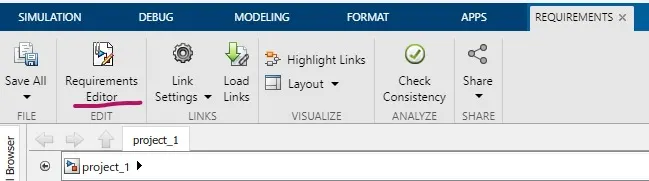
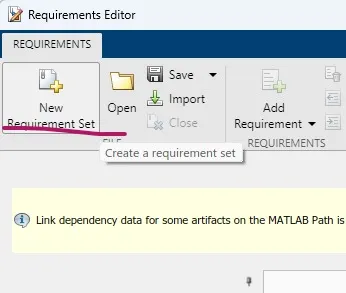
3. Requirement tagging report: Open model -> goto apps -> select requirement manager -> a window will open -> in that select requirement editor. click on new requirement set.
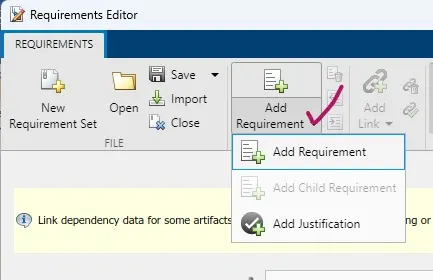
click on Add requirement.
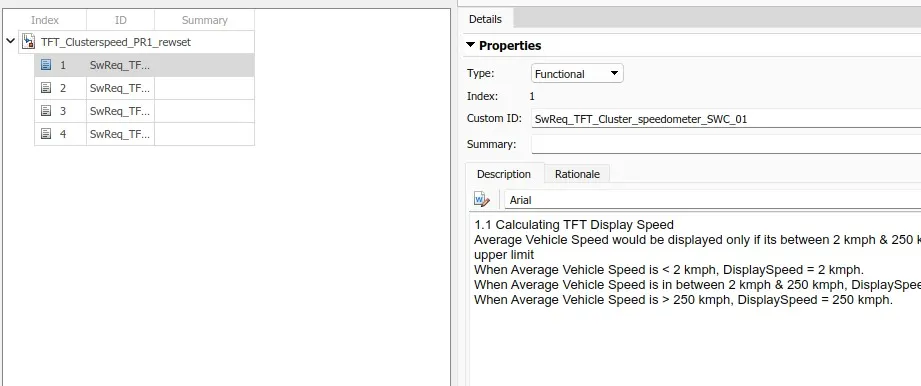
now we have to add remaining requirements in requirement set. Here, Four requirement are there.
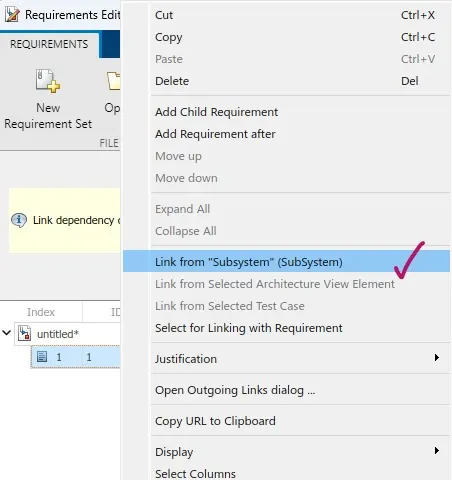
Now we have to link the link to every subsytem. click on particular subsystem -> give right click on your requirement -> select link from"(Name of the subsystem)".
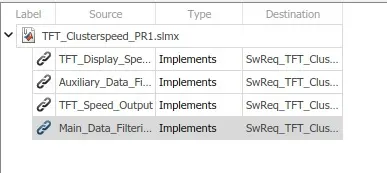
now we have to add remaining links in requirement set. Here, Four links are there.
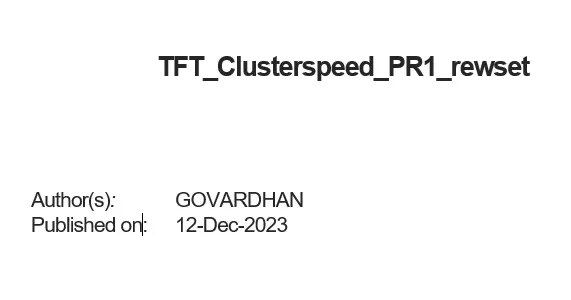
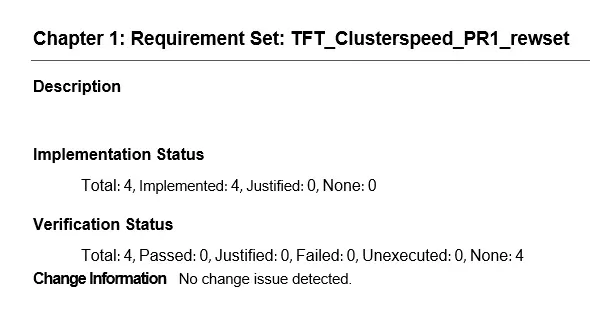
Save all links & requirements. Now we have to generate report. click on export -> generate report -> give name -> apply - ok. Report looks like below:
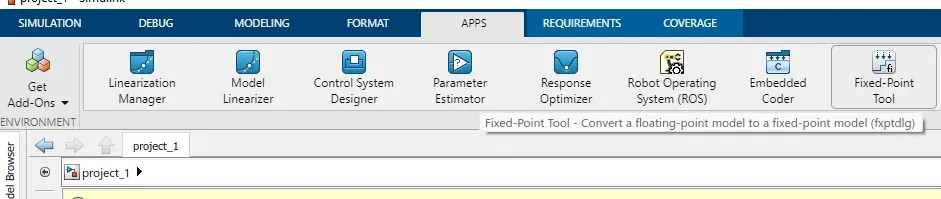
4.FIXED POINT TOOL BOX: Open model -> goto apps -> select FIXED POINT.
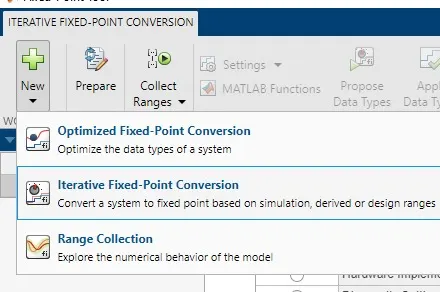
Click on New -> select Iterative fixed point conversion among three.
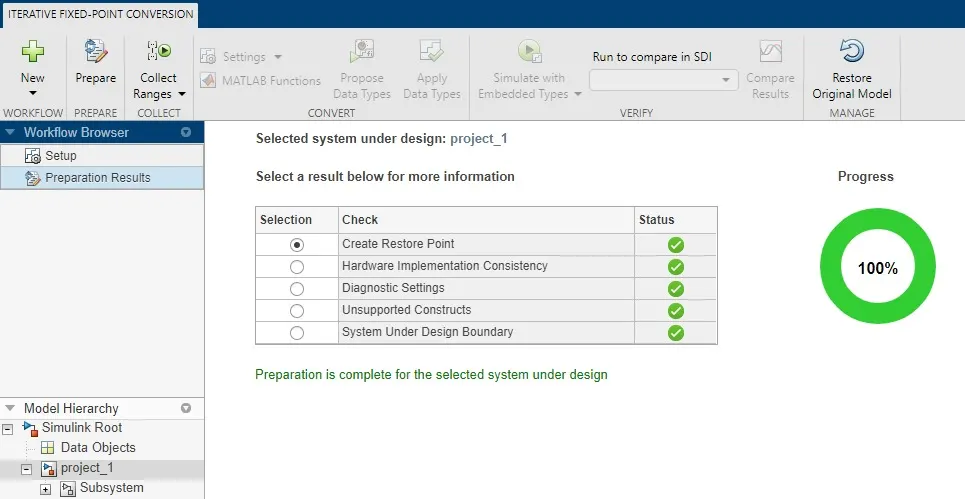
Click on prepare if the preparation is 100%. then goto next process.
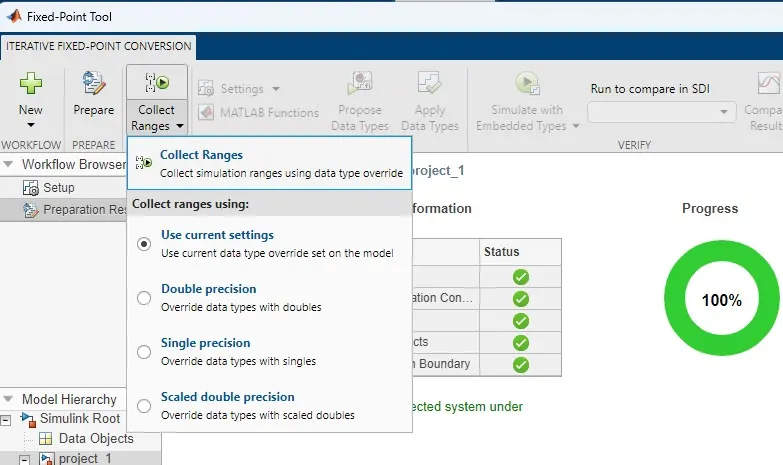
Under collect ranges -> click on use current settings then click on collect ranges.
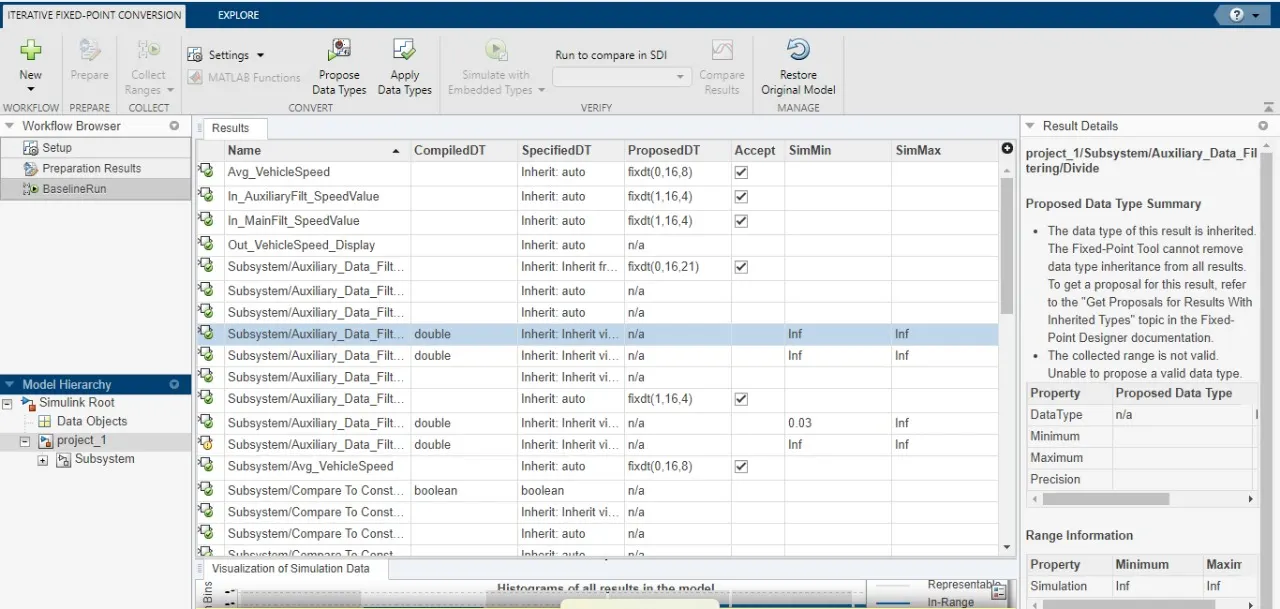
Now all data types are updated according to the block ranges.Like below:
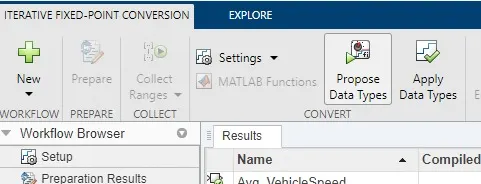
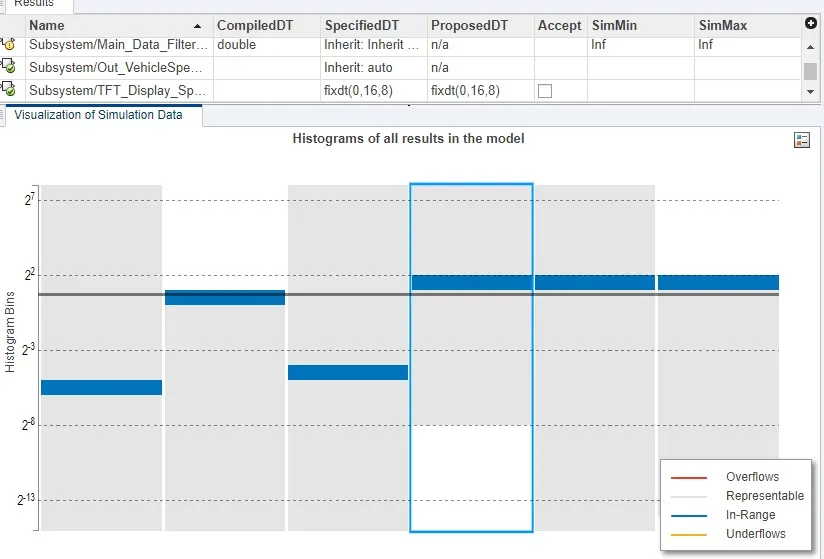
click on propose Data types.
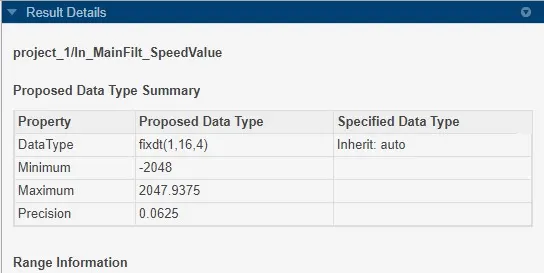
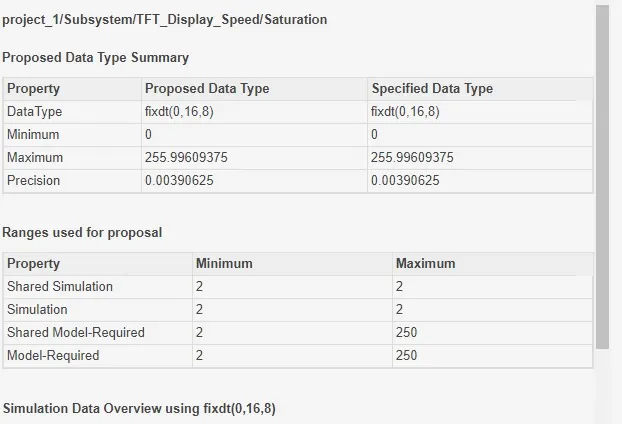
Property, proposed data type and specified data type are updated.
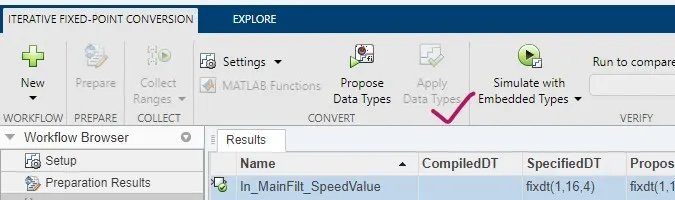
Click on Apply data types. our model get automatically updated as per the ranges collected.
Here,the picture shown is before updating the data type.
Here,the picture shown is after updating the data type.
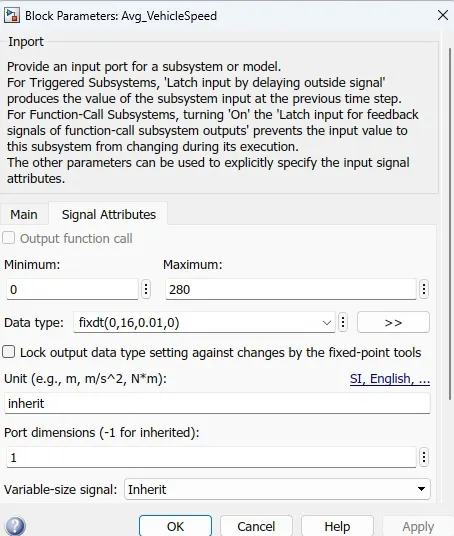
In case any block is not updated data types means we have to explicitly give the ranges. Do updates in SLDD file also,
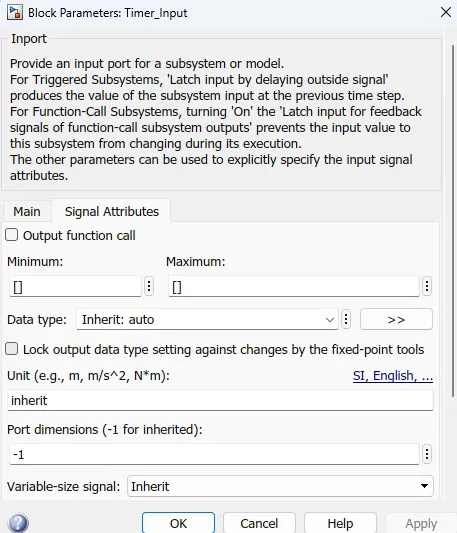
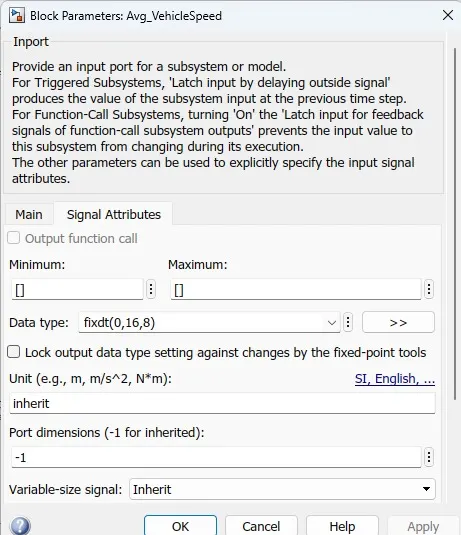
Explicitly given in the signal attributes.
In propsed data type summary: Property, proposed data type and specified data type are automatically updated.
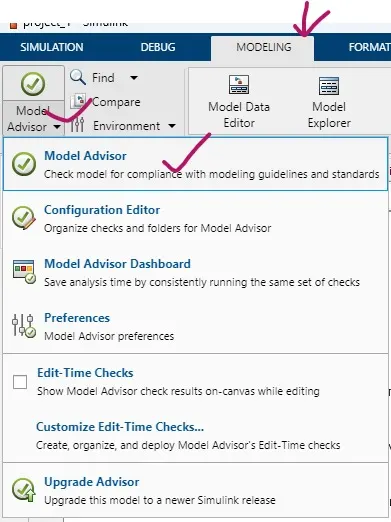
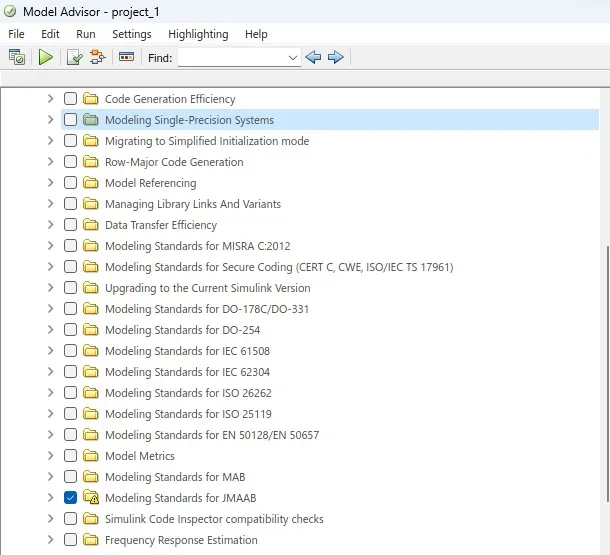
5. Model advisor-JMAAB compliance report: After Developing the model & simulating without any errors. Goto modelling tab -> select model advisor among three options.
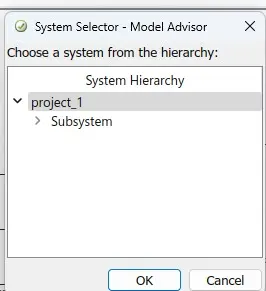
choose project_1(entire model) -> select ok.
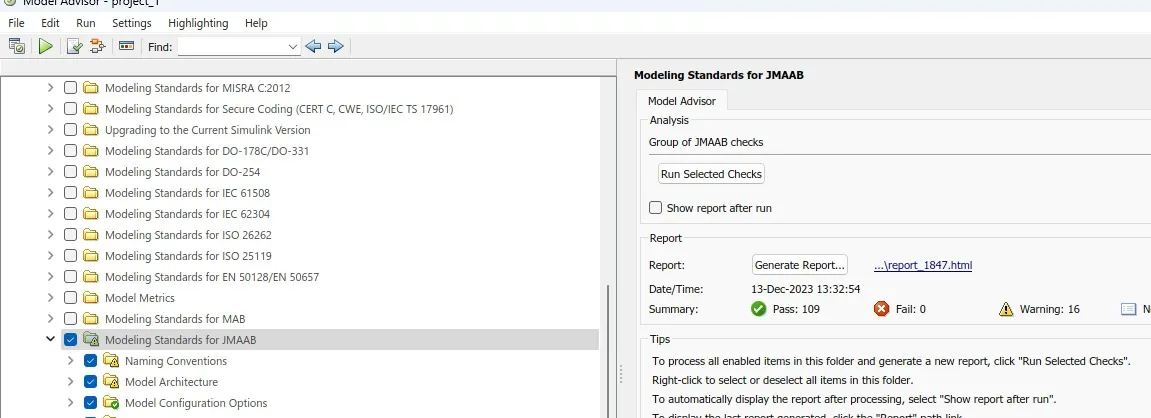
Under By product -> enable Modeling standards for JMAAB. Click on RUN button to see the checks information about the model(fail,pass & warnings).
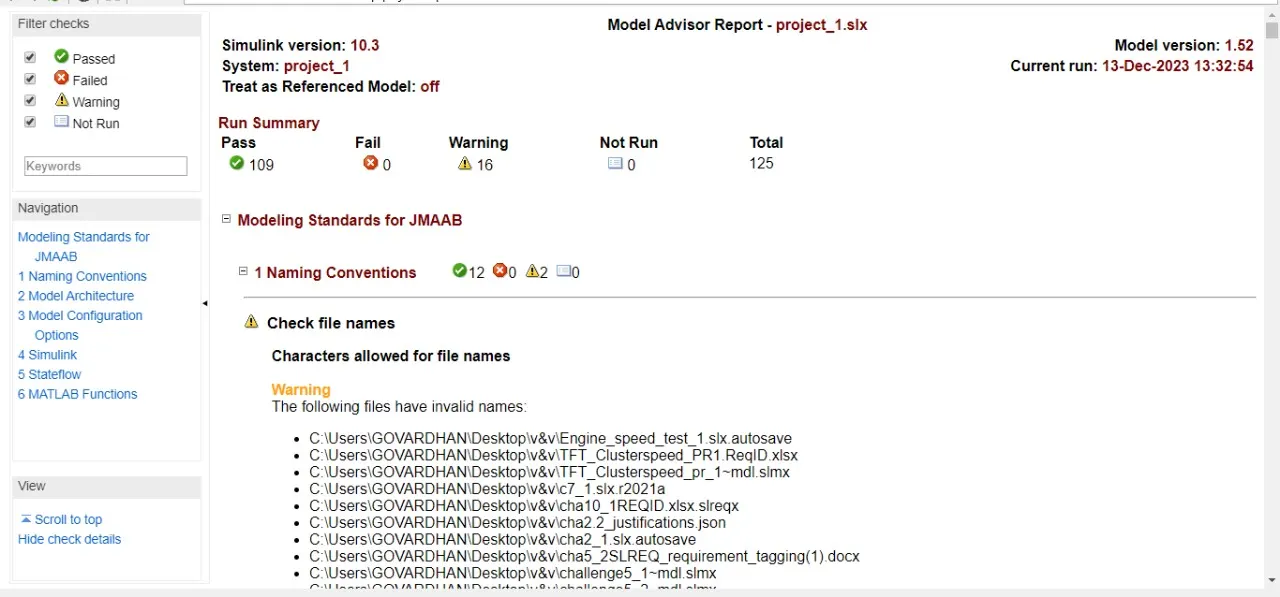
Here,i have 109-pass cases 0- fail, 16- warnings.
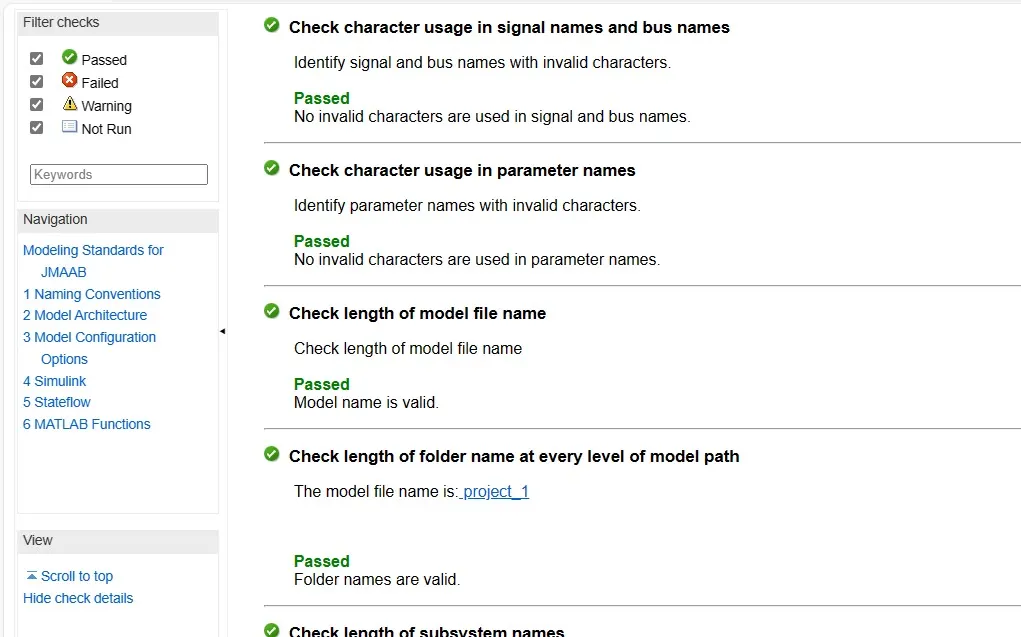
Now we have to generate report under model advisor. click on generate report. enter the basic details about the report get generate. -> apply -> ok. The generated report looks like below:
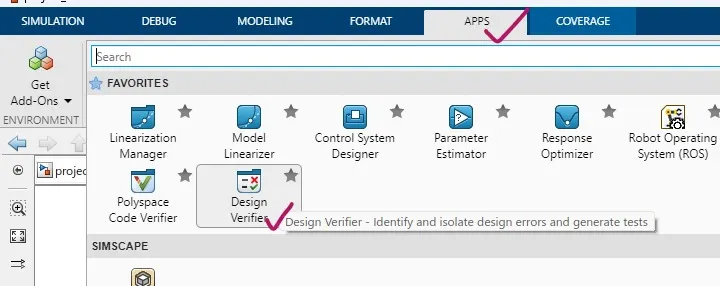
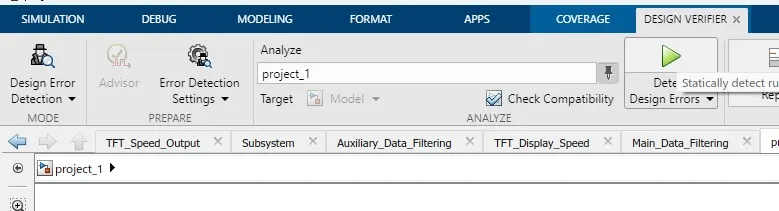
6.SLDV(Simulink design verifier) Design Error detection Report: * What is SLDV(Simulink design verifier). ->It is a toolbox foe format verification of model for not identifying any small errors in the model. these all errors are not detecting at the model level by Cntrl+R, C ntrl+D it can be detected here. After running model Goto apps tab -> select Design Verifier.
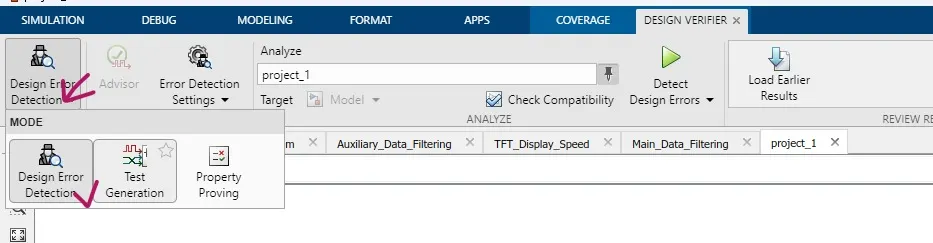
A window will open select Design error detection among three options.
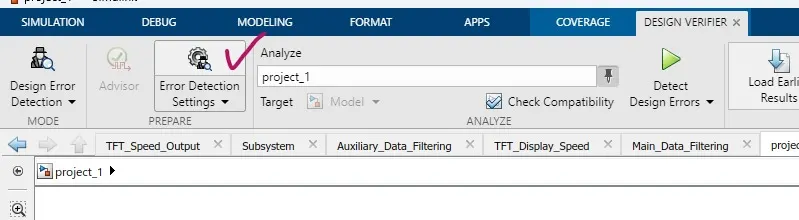
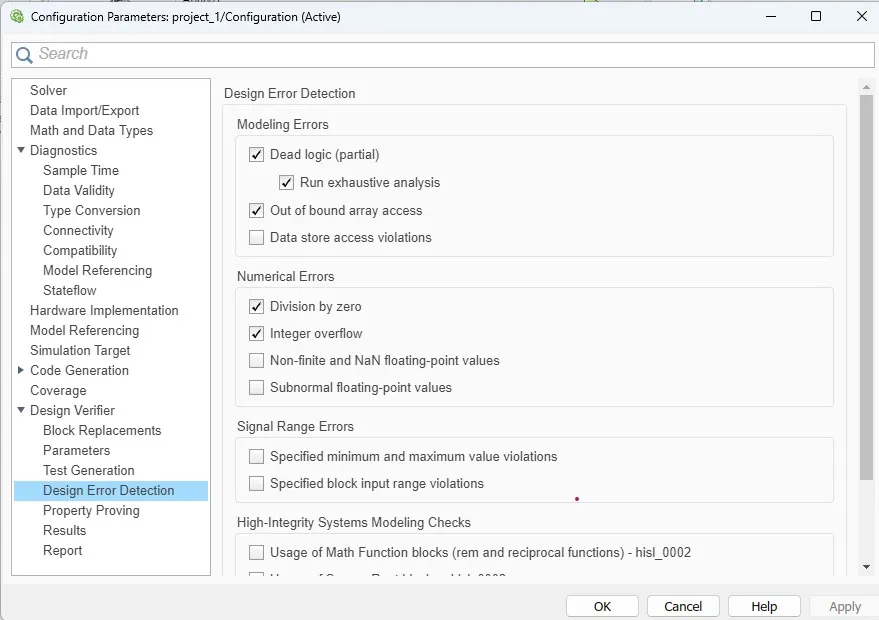
Click on Error Detection settings and make some changes according to the requirement.
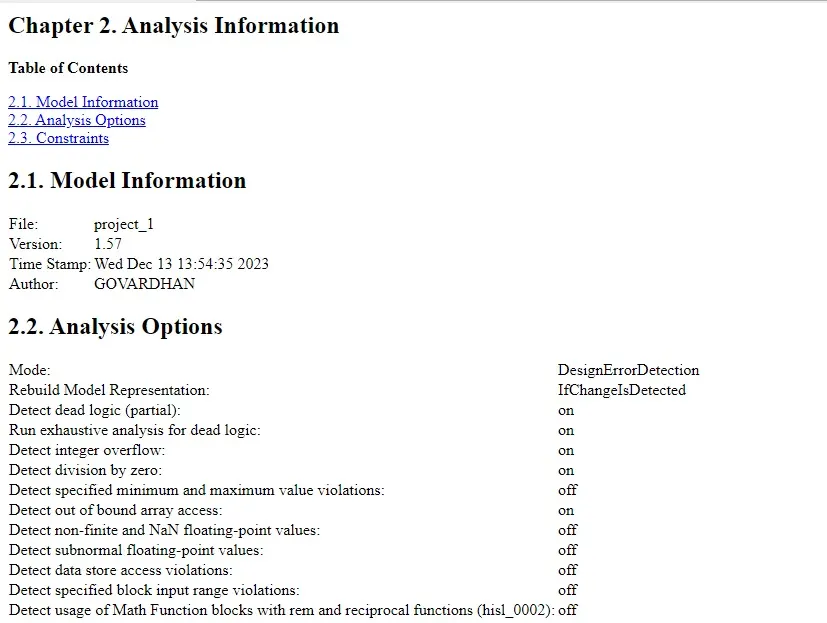
like below, Enable those options in configuration parameters ->Design verifier -> Design Error Detection.
Check compatability -> click on Detect design errors.
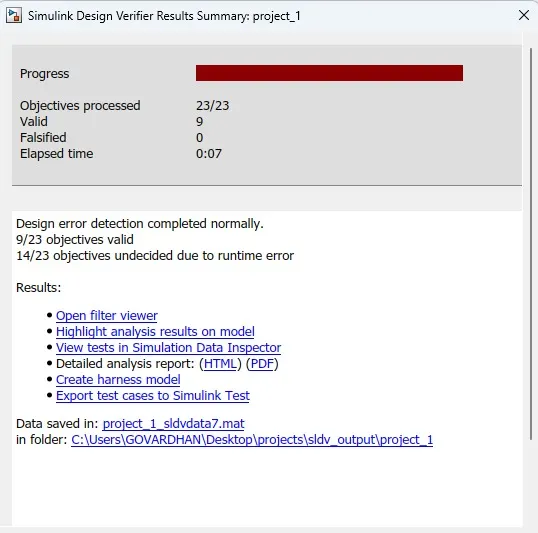
A window wiil open it tells about the objectives peocessed valid and falsified objects. and it give elapsed time also.
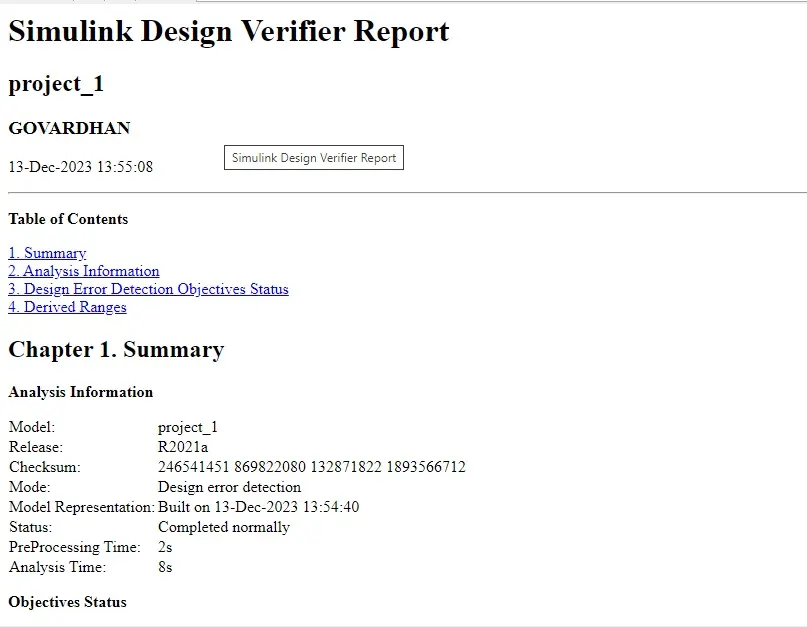
Now we have to generate report for SLDV - click on HTML in the above window it directly open the report. The generated report lokks like below: It gives detailed information about what are the objects falsified and satisified.
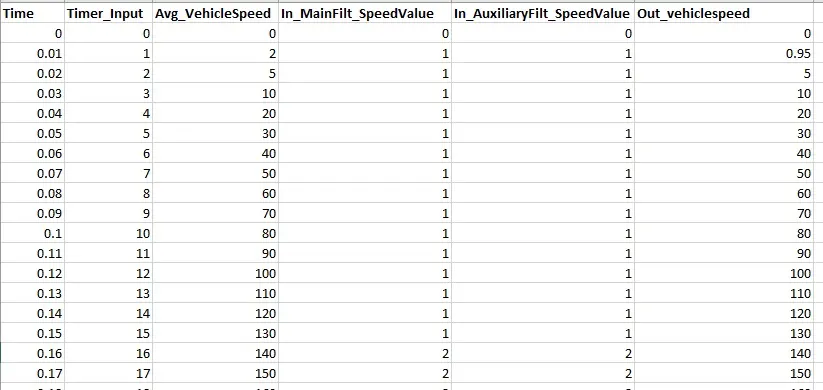
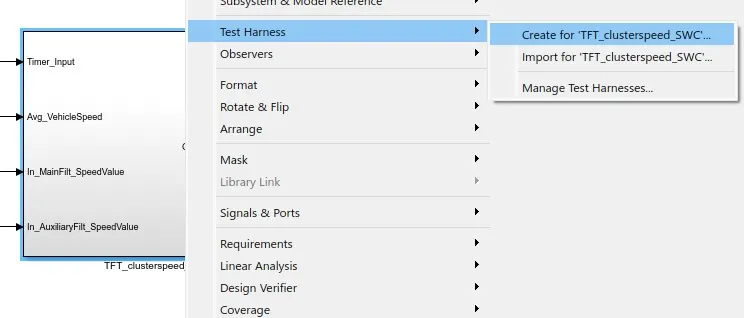
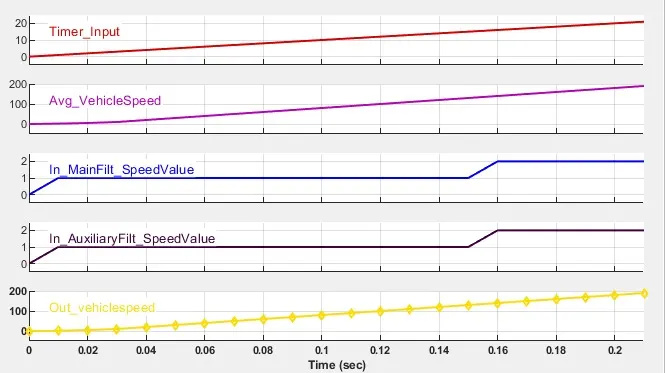
7.Functional test cases,MIL,SIL harness, Coverage Report. Functional test cases: here the harness inputs are out_vehiclespeed. Now we have to perform MIL and SIL tests. MIL HARNESS:
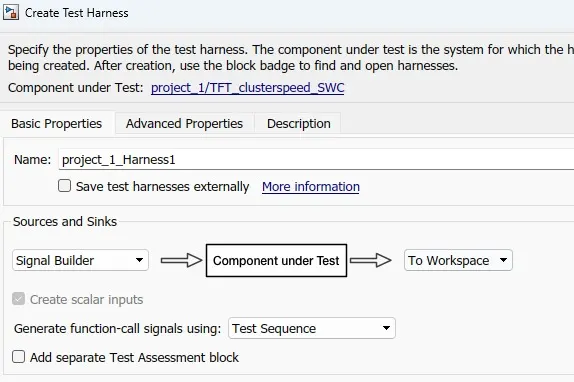
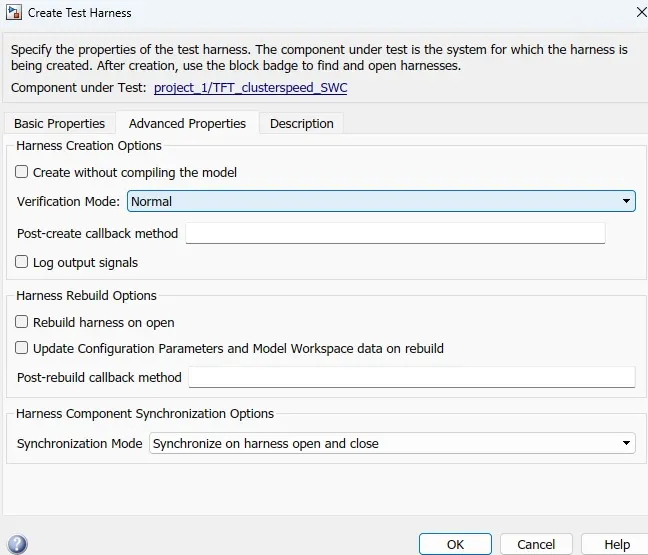
Before this treat subsytem as atomic subsystem. Awindow will open like below,give input : signal builder, output: to workspace.
In advanced parameters verification mode as: Normal
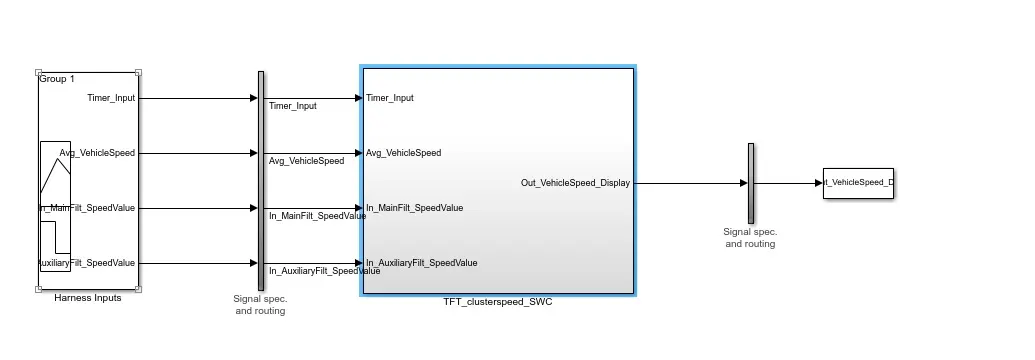
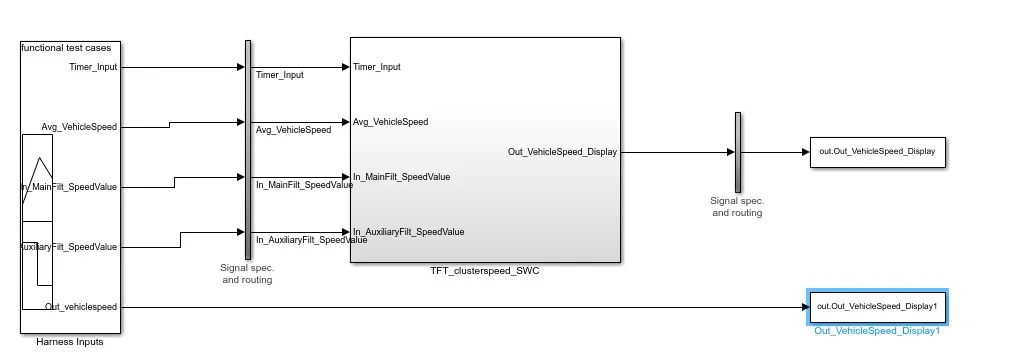
After applying ok the model looks like below:
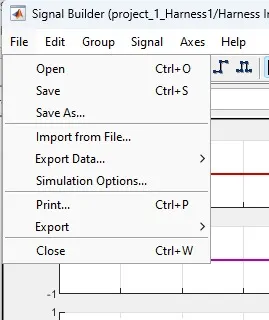
double click on signal builder a window will open -> click on file -> select import from file.
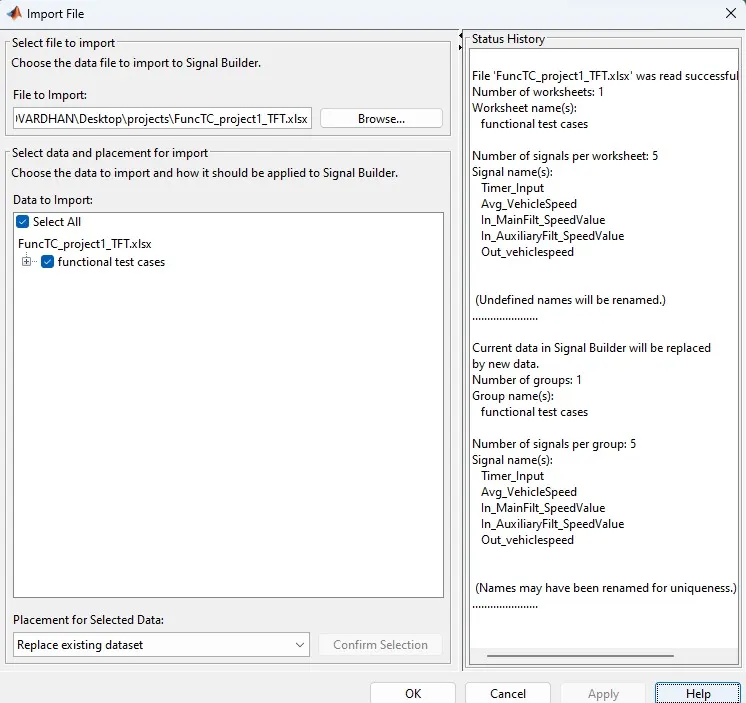
Browse the file name -> enable select all -> placement for selected data: replaceexisting data base -> confirm selection -> apply -> ok, These are the inputs for test harness
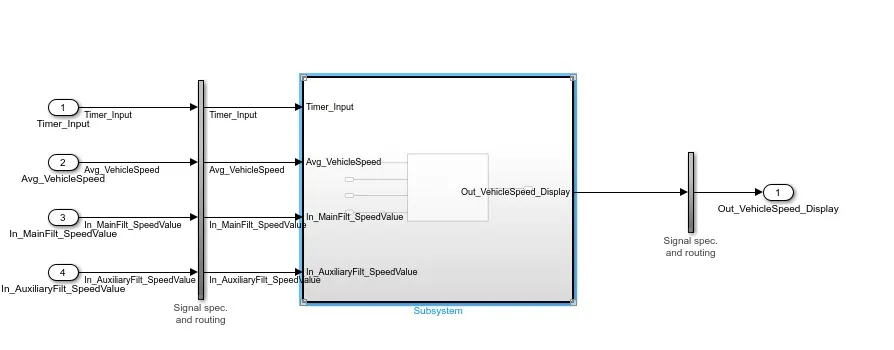
Now the MIL is looks like below with an extra input (out vehicle speed).
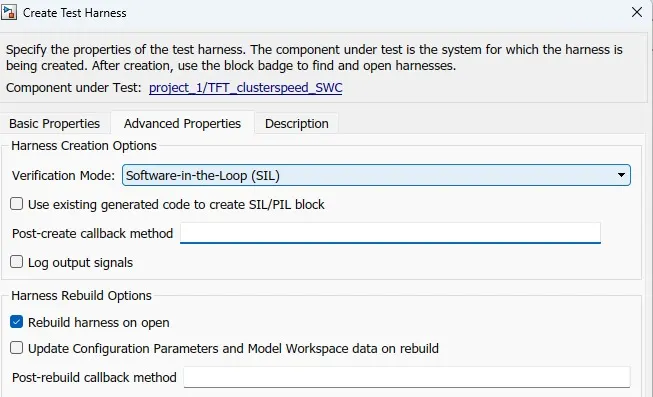
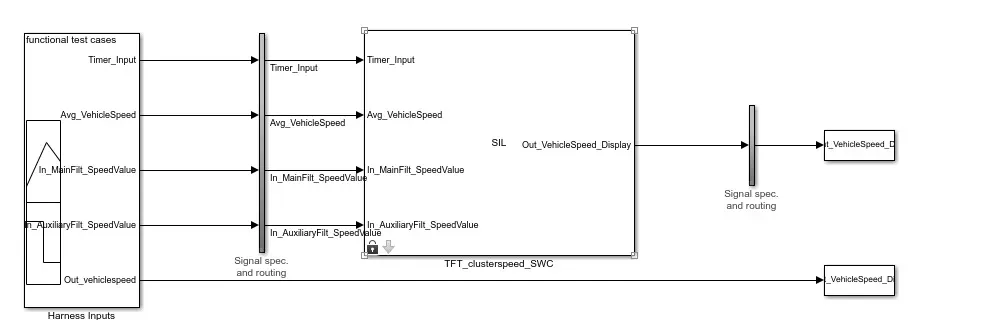
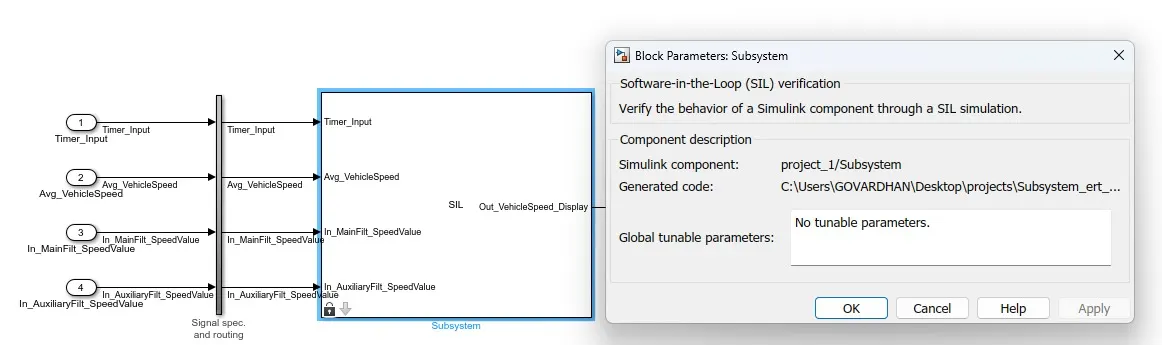
TEST HARNESS FOR SIL: There is no much difference between MIL & SIL, the only difference is change the verification mode as : SIL(Software in loop). -> click on ok. Harness inputs are build -> Browse the file name -> enable select all -> placement for selected data: replaceexisting data base -> confirm selection -> apply -> ok,
Now the test harness of SIL model looks like below:
Harness inputs for SIL test:
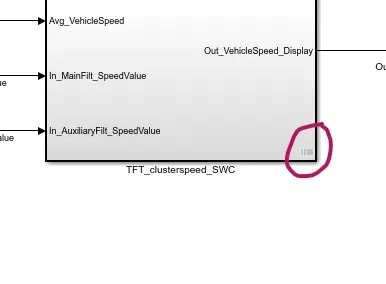
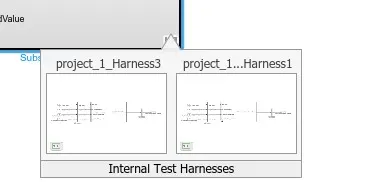
At bottom of our model a symbol shown below, if we click on prospective the harness are present in that.
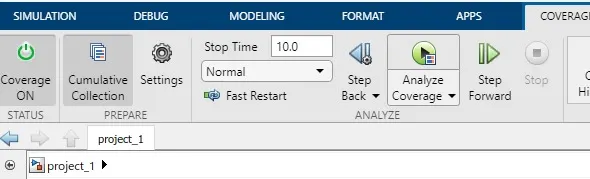
COVERAGE REPORTS: Goto apps -> click on coverage.
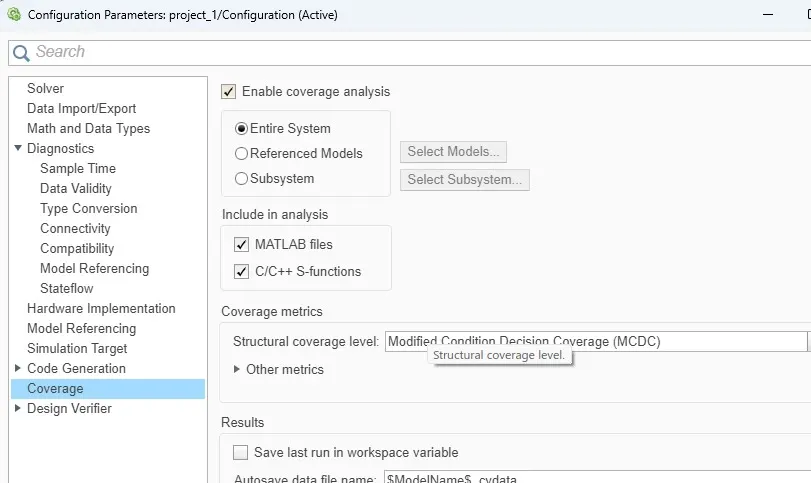
Make sure you have to enable coverage analysis in configuration settings.
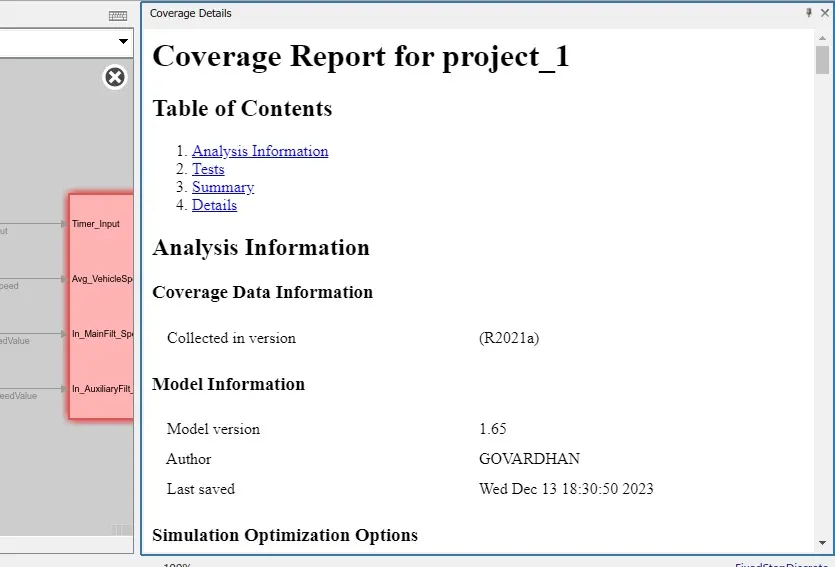
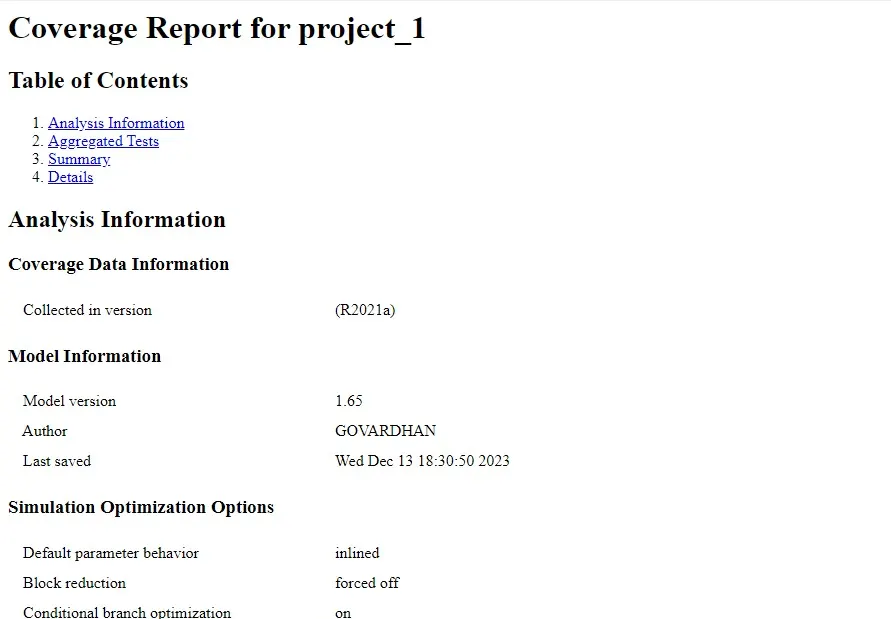
Click on RUN coverage our model shows the coverage report.like below.
COVERAGE REPORT:
8.SLDV TEST GENERATION REPORT: SLDV(simulink design verifier). goto apps -> select Desidn verifier
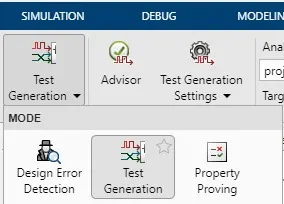
A window will open for coverage like below,select mode: Test generation among three options.
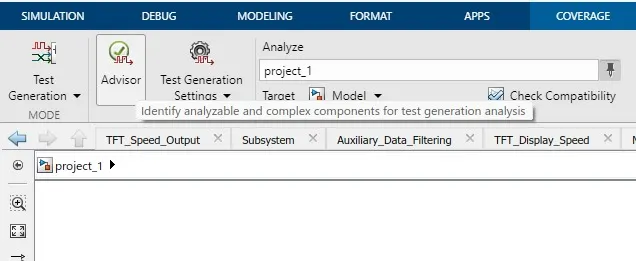
Make some changes in test generation settings according to the requirement. -> click on Advisor.
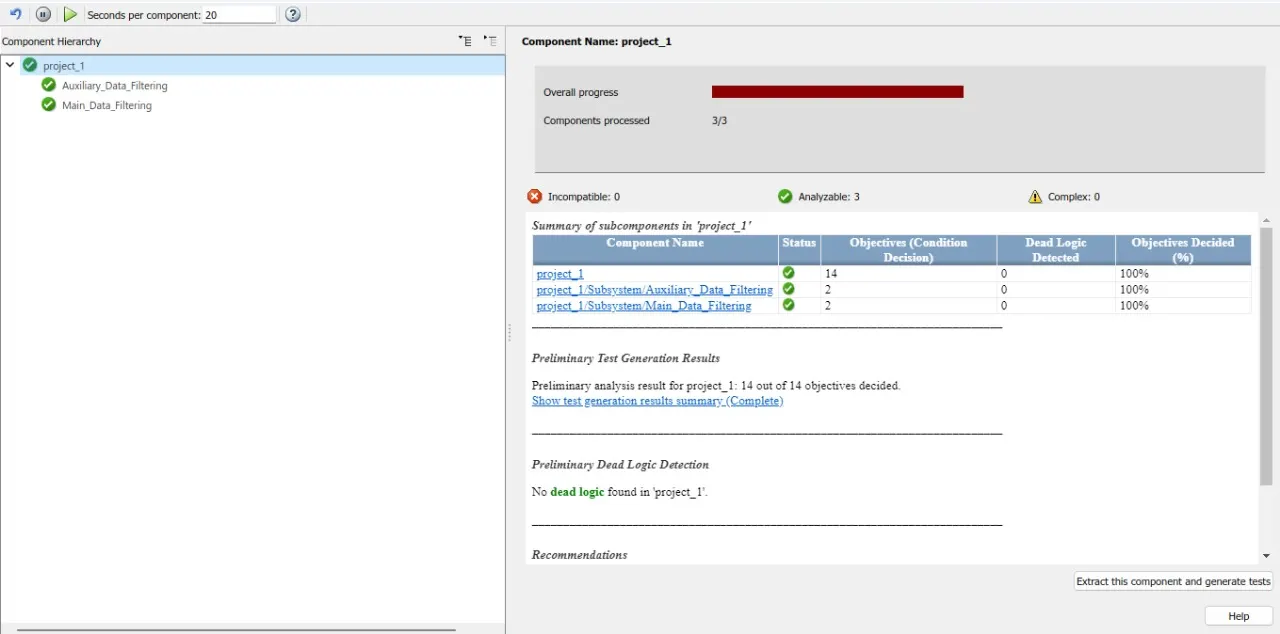
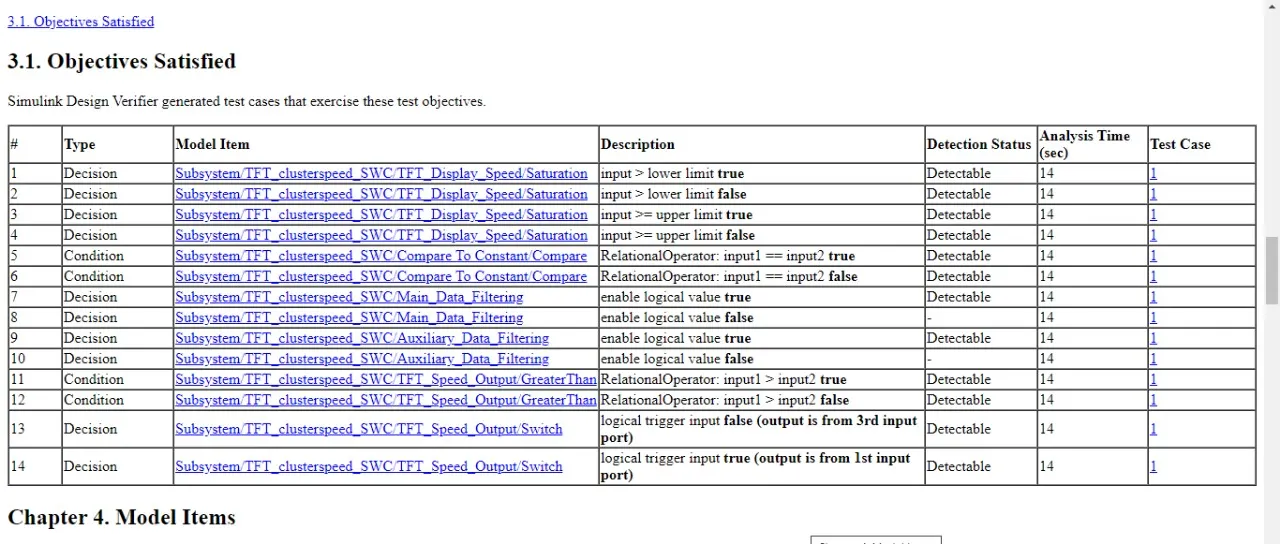
It will open a window, in that it describes about the objectives(coondition) & fit detects any dead logics present in the model. click on RUN button. test generation starts working.
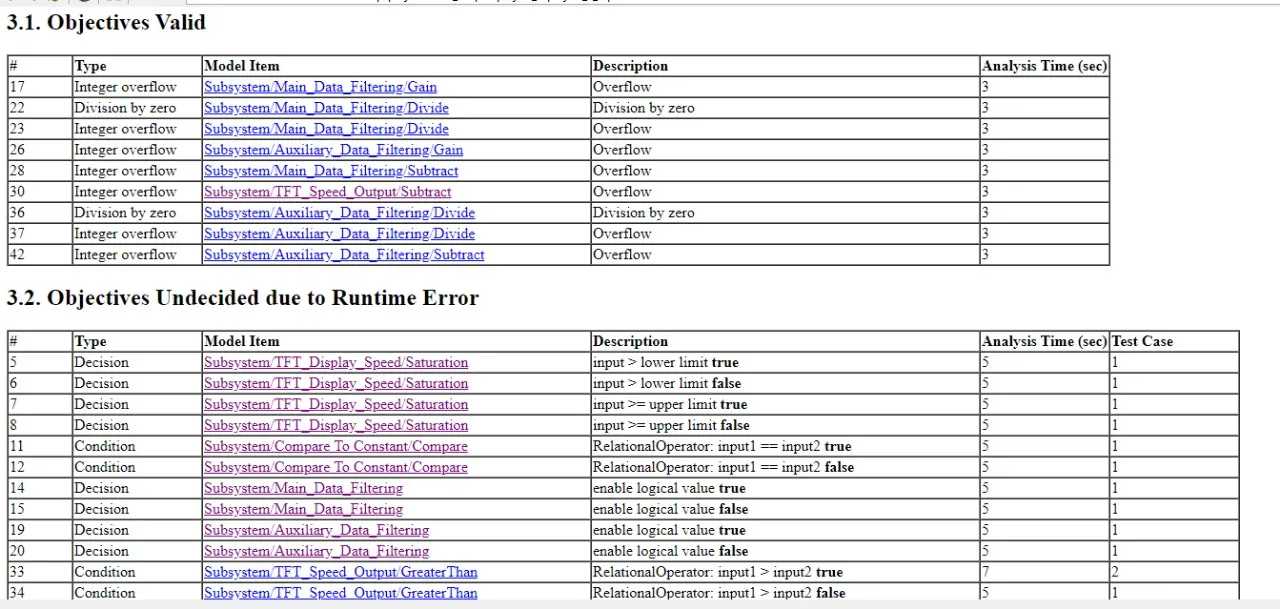
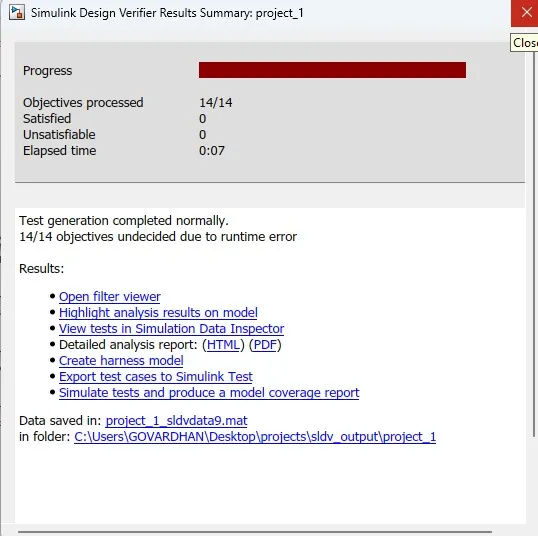
This is the progress report if test generation.here 14 objectives are undecided due to run time error. and elapsed time is 0.07.
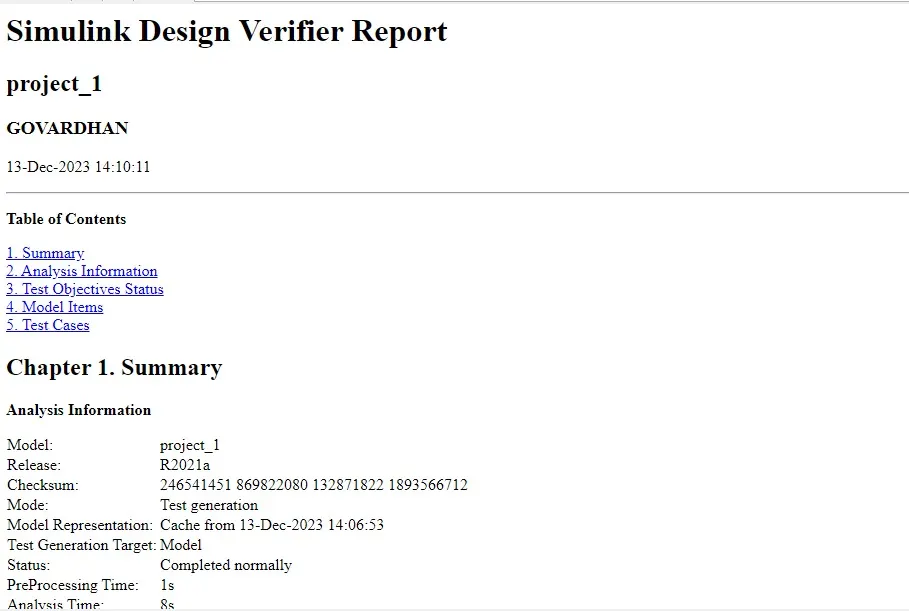
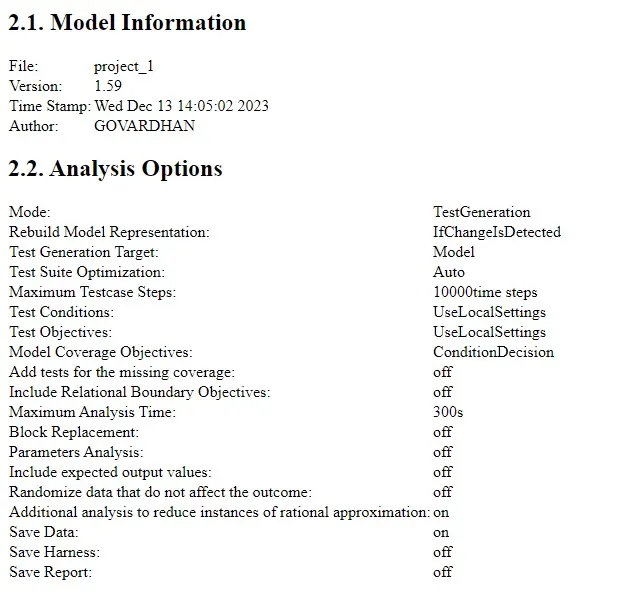
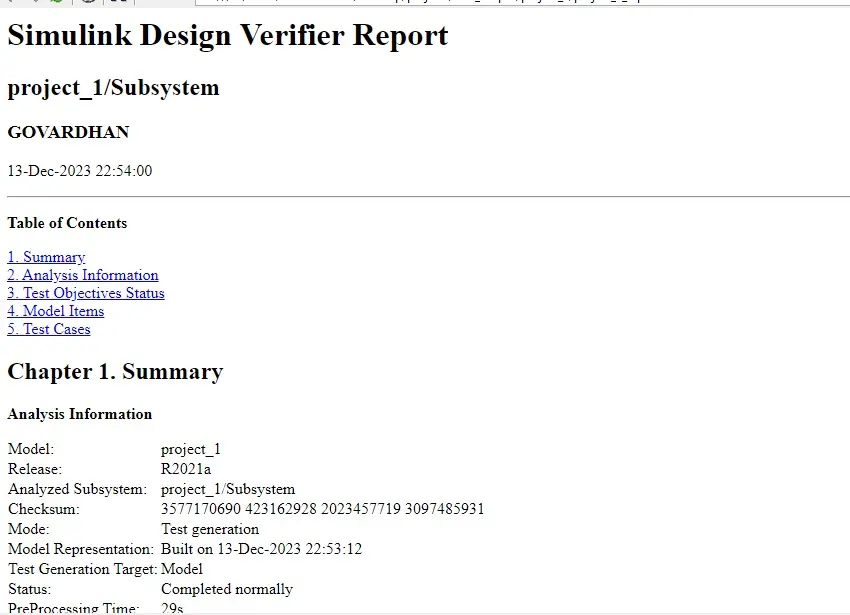
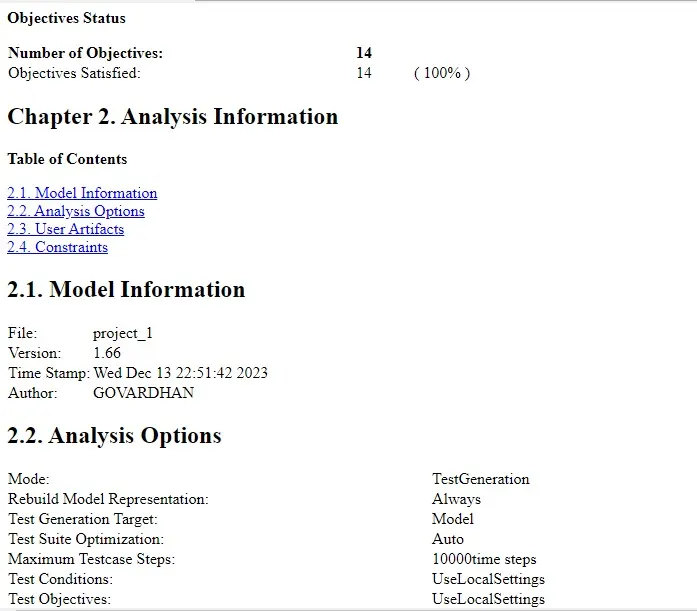
TEST GENERATION REPORT: report looks lie below:
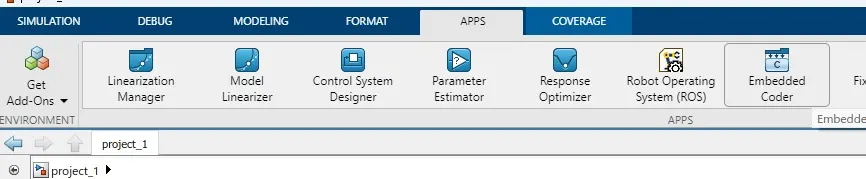
9.AUTO CODE GENERATION REPORT,.c & .h CODES. Goto apps -> select embedded coder. In c-code select build option to build the code.
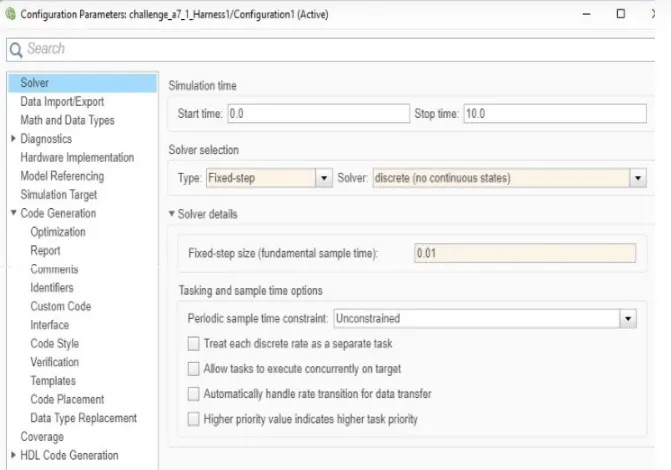
make sure you have to do some settings in configuration parameters. in solver.
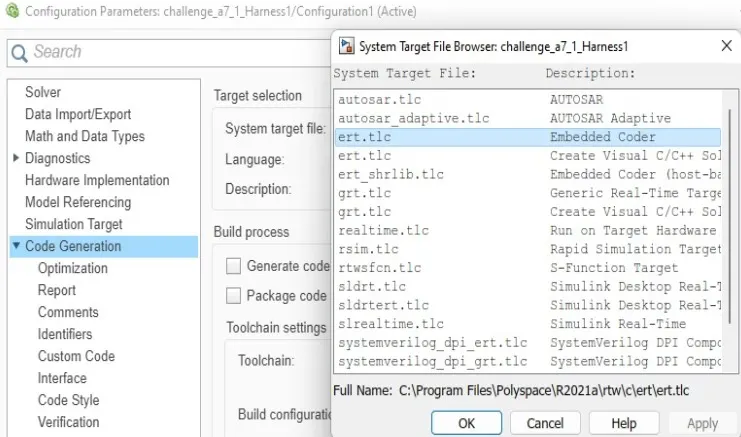
In code generation Target file is ert,tlc - Embedded coder. -> apply -> ok
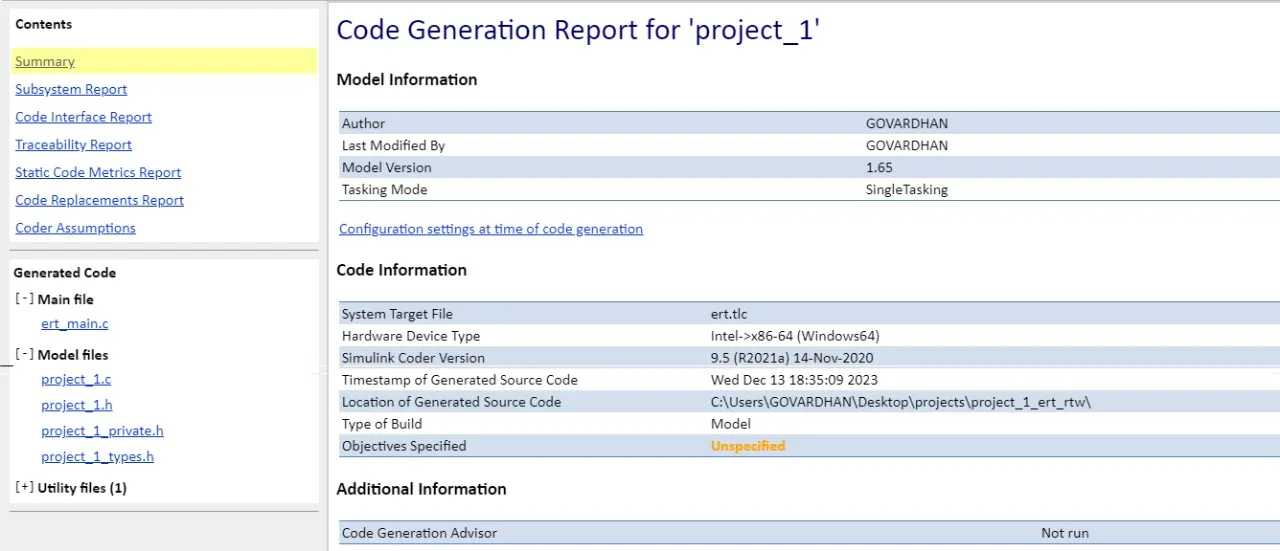
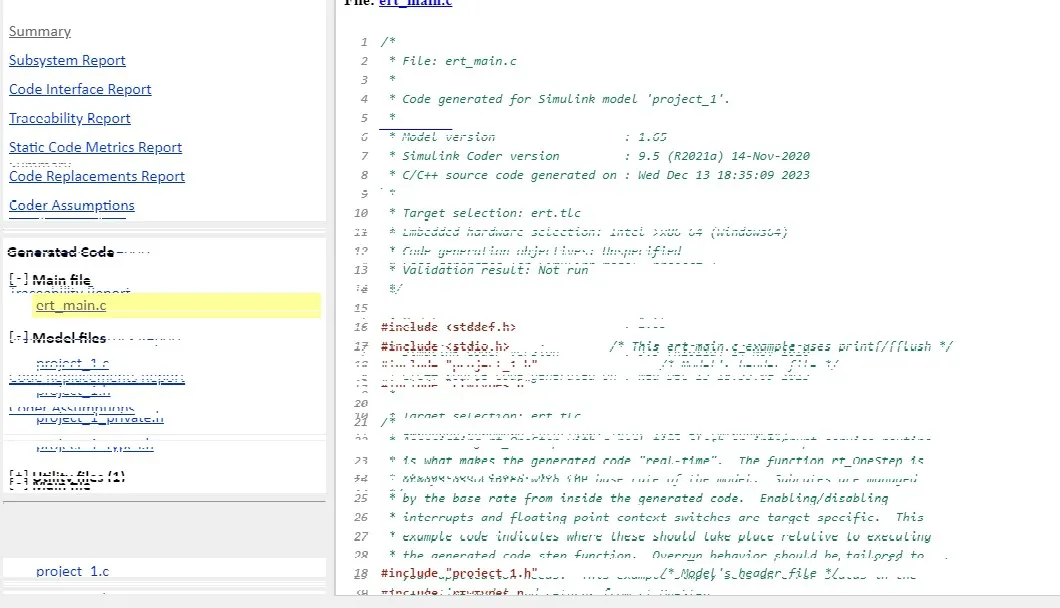
Now the code generation report looks like below:
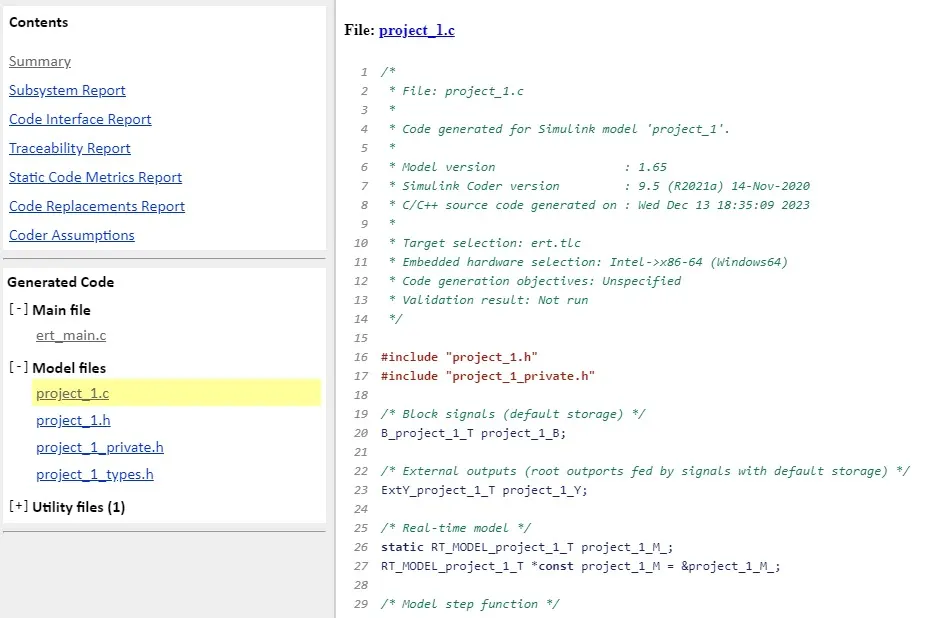
.C file
.h file:
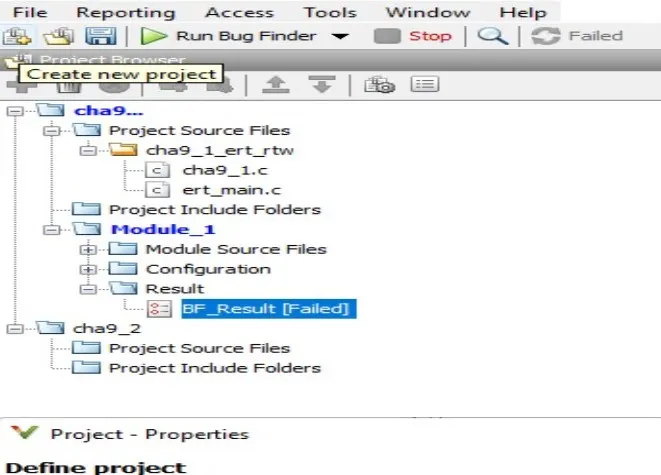
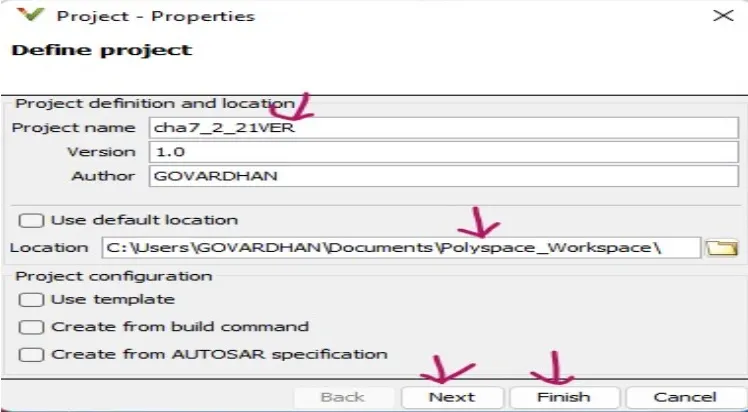
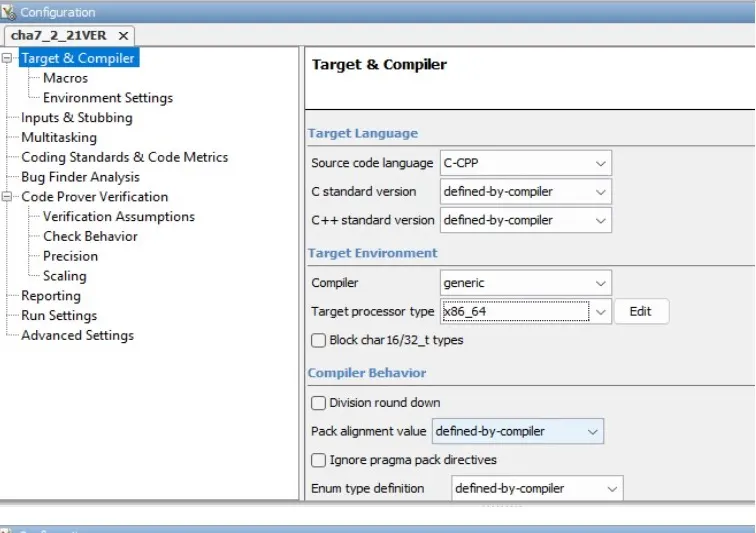
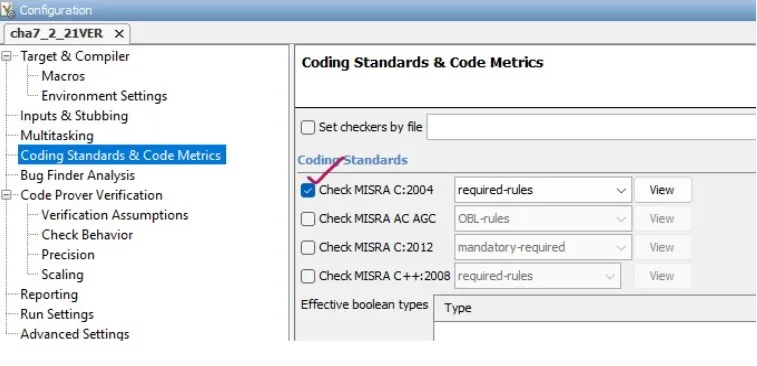
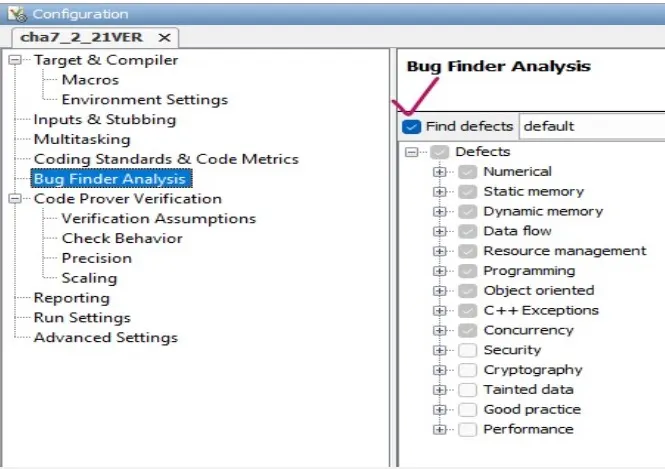
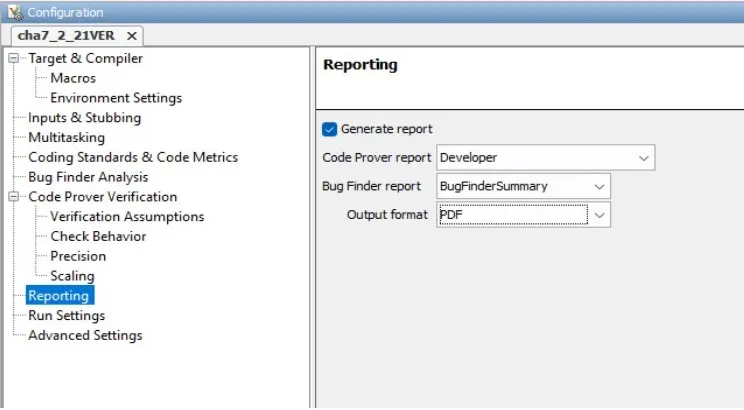
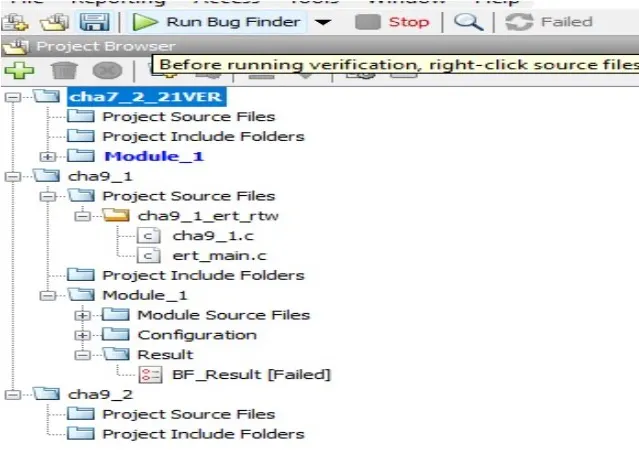
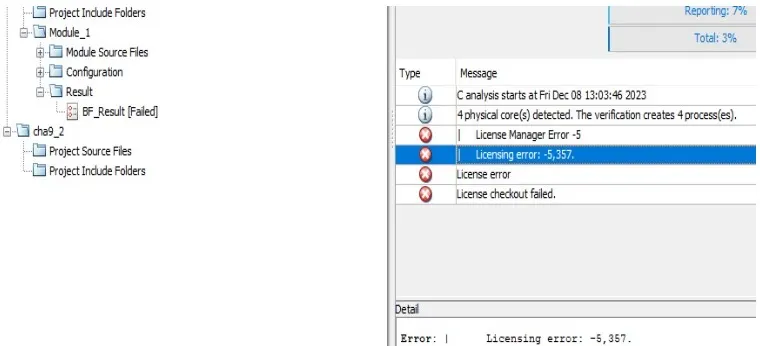
10.POLY SPACE ANALYSIS REPORT OUTPUTS; As we don't have the polyspace licence,Only steps to find out the polyspace bug finder report is wriien below: POLYSPACE BUG FINDER: Polyspace Bug finder is a static analysis tool that can help you verify the absence of runtime errors in your matlab code to generate a polyspace Bug finder output you can follow these steps: 1.BUG FINDER: 1.open MATLAB and navigate to the directory where you were code is located. 2.open the polyspace bug finder interface by typing polyspace in the MATLAB command window. 3.In the polyspace bug finder interface, select: create new project and give your project name.
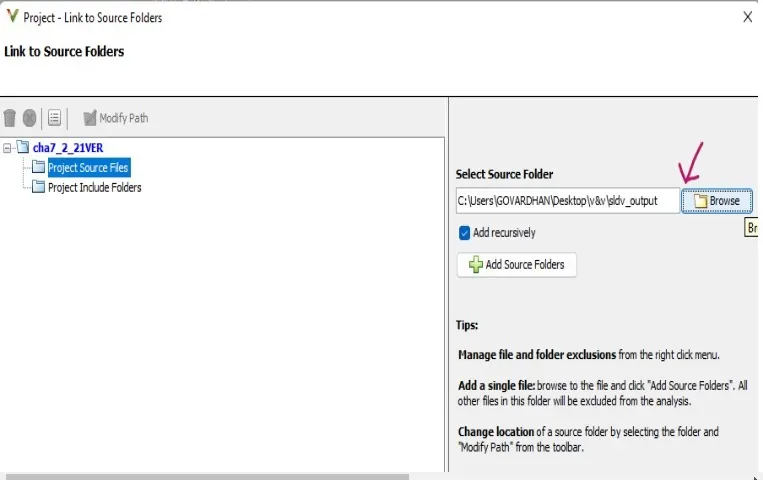
4.Select matlab as the programming language for your project. -> Browse the file.
5.In the project setting window select the files you want to analyse and specify any additional analysis options. In configuration settings: Do some settings shown below:
6.Click run analysis to start the analysis process.
7.Once the analysis complete polyspace bug finder will generate report that list any potential bugs it has identified in your code. 8.To view the reports selected view report in the policies bug finder interface. 9.The report will display a list of potential bugs along with a detailed information about each bug and recommendations for how to fix it. 10.You can save the report in various formats such as a pdf, html or XML by selecting export report in the participate bug finder interface. 11.Review the project and fix any potential bugs identified by by policies bug finder to improve the quality and relatable of your matlab code. Don't have the polyspace licence:
2.CODE FINDER: Polyspace code prover is a static analysis tool that can help you verify the absence of runtime errors in your matlab code to generate a polyspace code prover output you can follow these steps: The process of code proven is same as bug finder the only difference is set the code prover at run button: 1.Open MATLAB and navigate to directory where you were code is located. 2.Open the participate code prover interface by typing psrun in the MATLAB command window. 3.In the polyspace code prover interface select create new project and give your project a name. 4.Select matlab as a programming language for your project. 5.In the project settings window select the files you want to analyse and specify any additional analysis options. 6.Click run analysis to start the analysis process. 7.Once the analysis is complete polyspace code prover will generate and output that indicates whether your code is free of runtime errors. 8.To view the output selective view results in the pollyspace code prover interface. 9.The output will indicate whether your code is free of runtime errors or if any errors were detected. 10.You can you can save the output in various formats such as PDF, html or XML by selecting export results in the polyspace code prover interface. 11.Review the output and address any errors identified by polyspace code prover to ensure the correctnees and reliable of your matlab code. 11.Test manager reports – baseline & back-to-back testing. BASELINE TESTING: What is baseline testing: In baseline comparision the model output is calculated and it is compared against the excepted results. Goto apps -> select simulink test.
A window will open select simulink test manager.
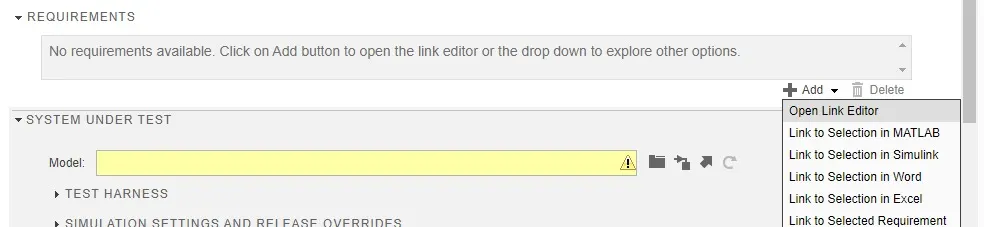
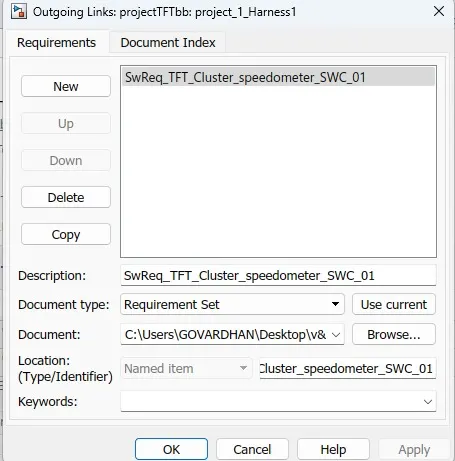
Click on NEW give name of the test apply -> ok. under requirements: click on add -> open link editor.
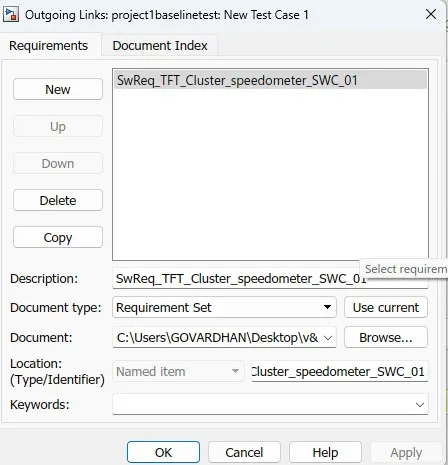
a dialob box will open clicl on new -> type : requirement set - use current -> browse the file for requirements ->selct particular requirement -> apply -> ok.
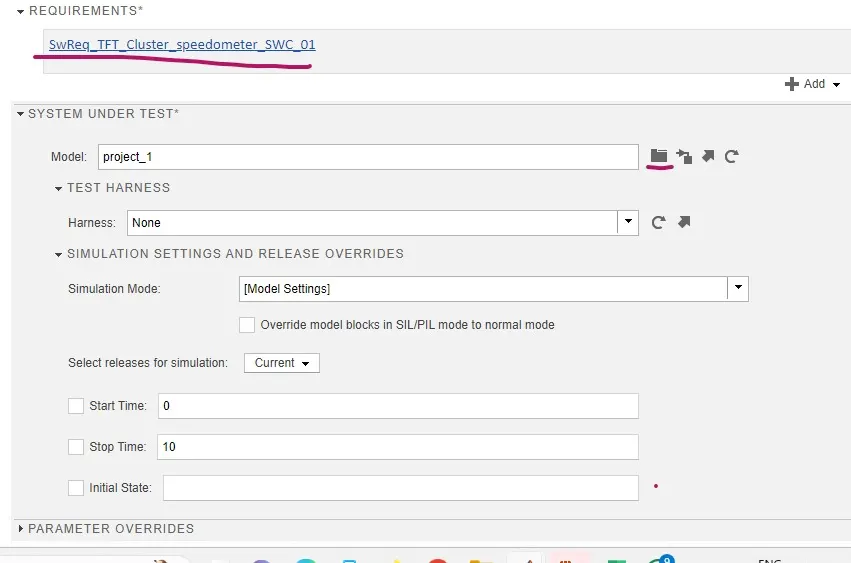
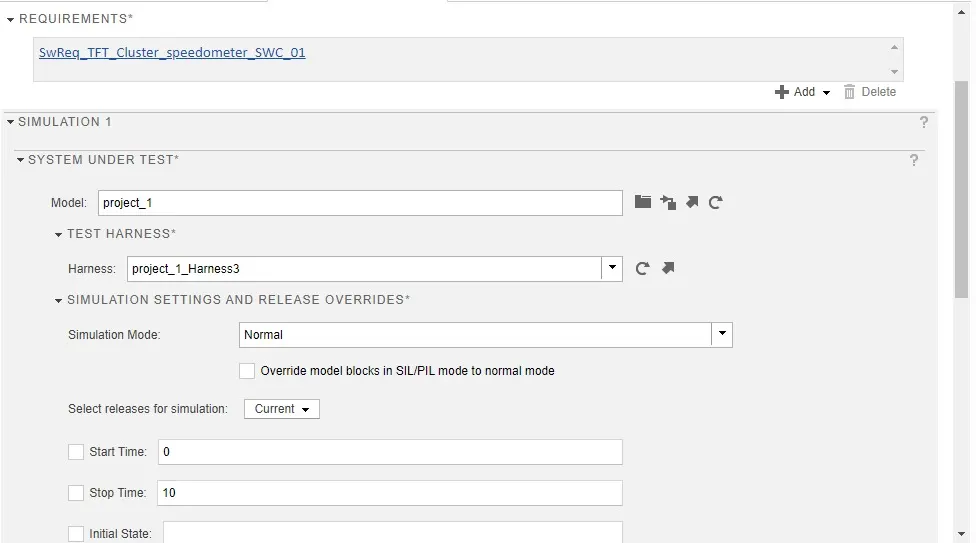
under System under test: click on browse(model.slx file)upload it. now the requirement & System under test:are shown below.
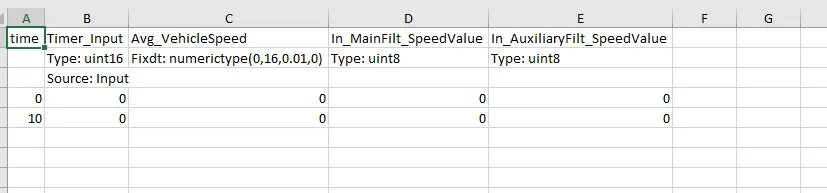
Automatically thye inputs are created in excel sheet.like below
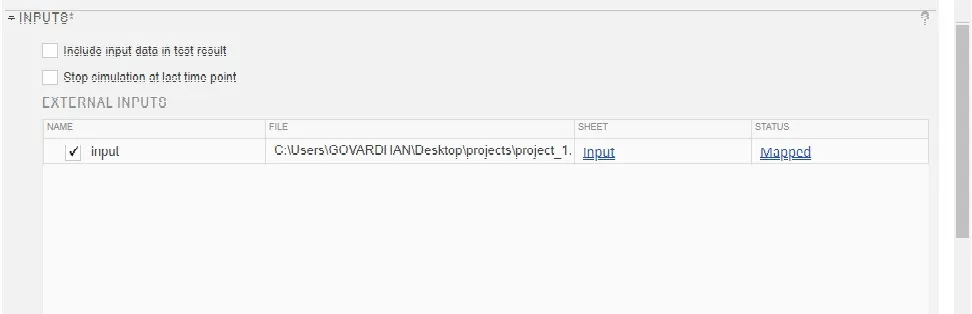
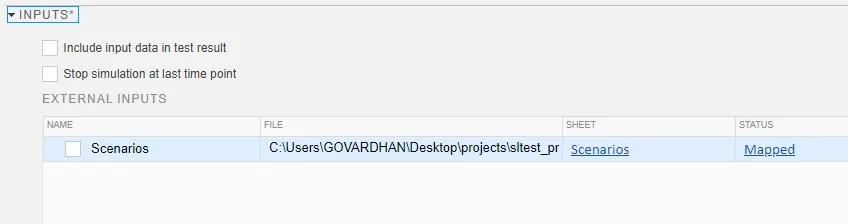
Under inputs: click n create -> browse the file.Now your inputs are mapped like below,
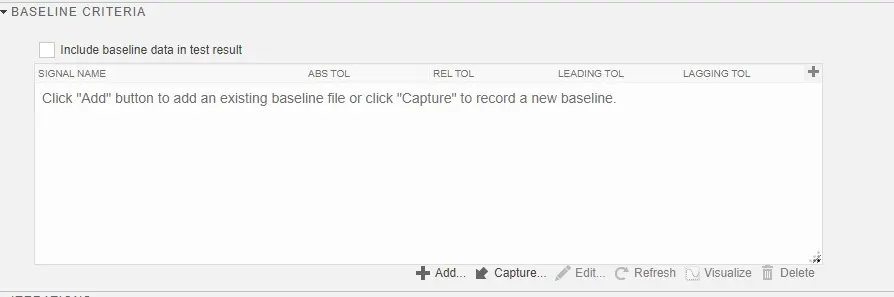
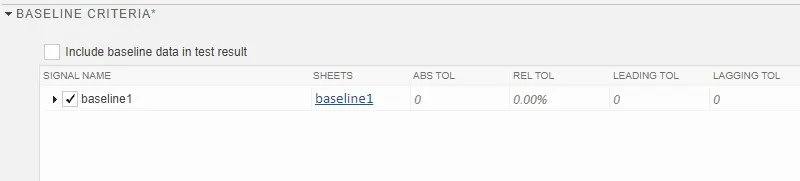
Under baseline criteria: Click on capture,
Now baseline also mapped like below:
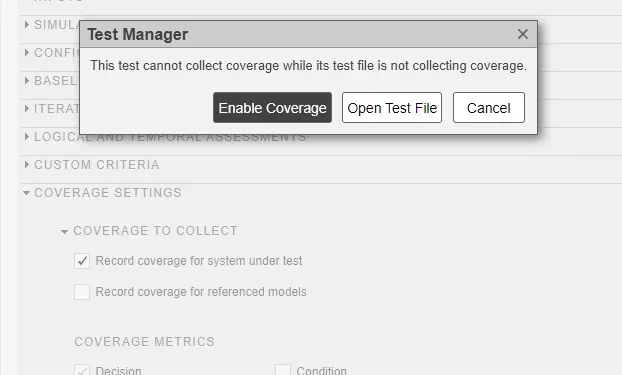
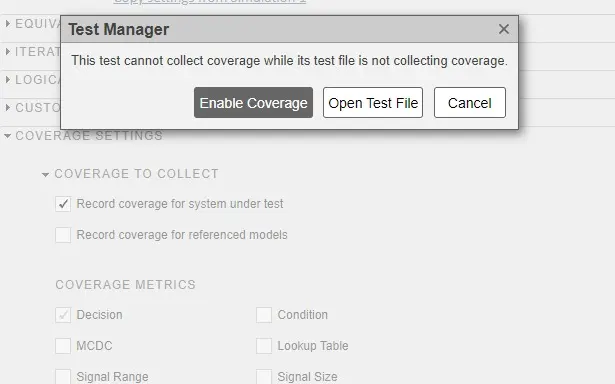
Under coverage: click on coverage to collect: record coverage for system under test & decision automatically set.
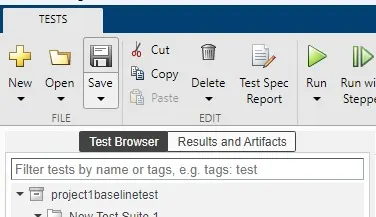
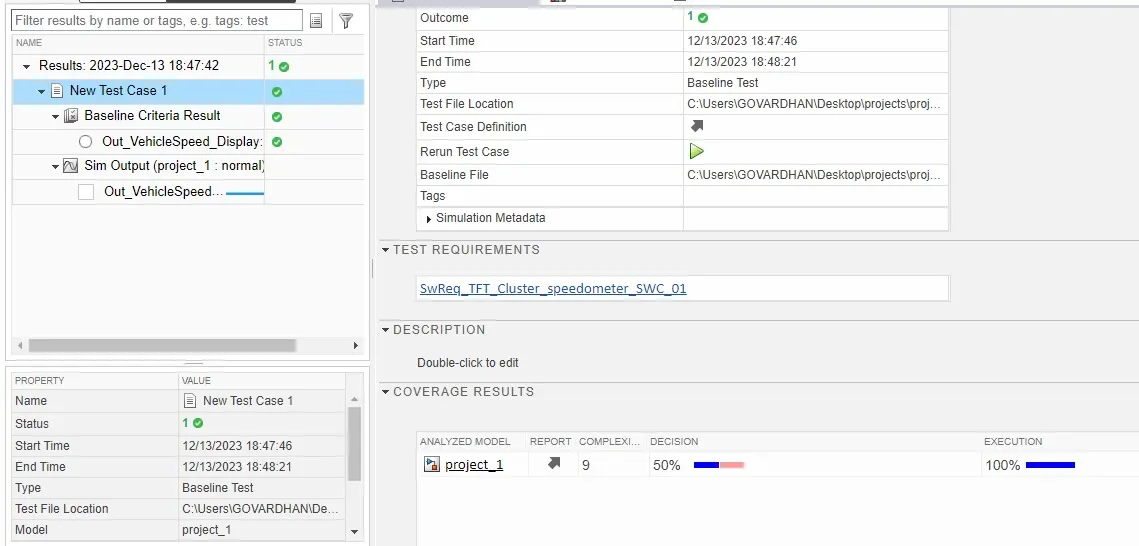
Save all -> click on RUN button.
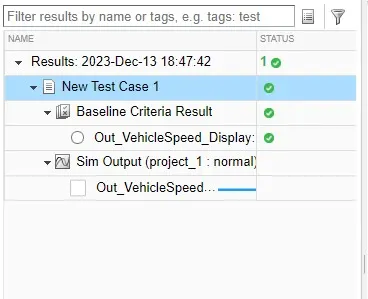
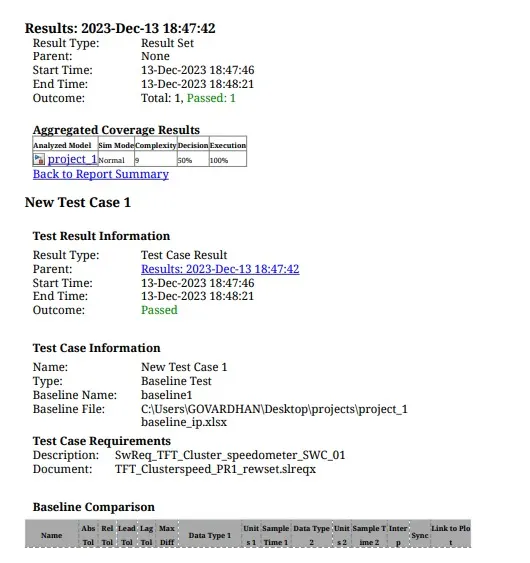
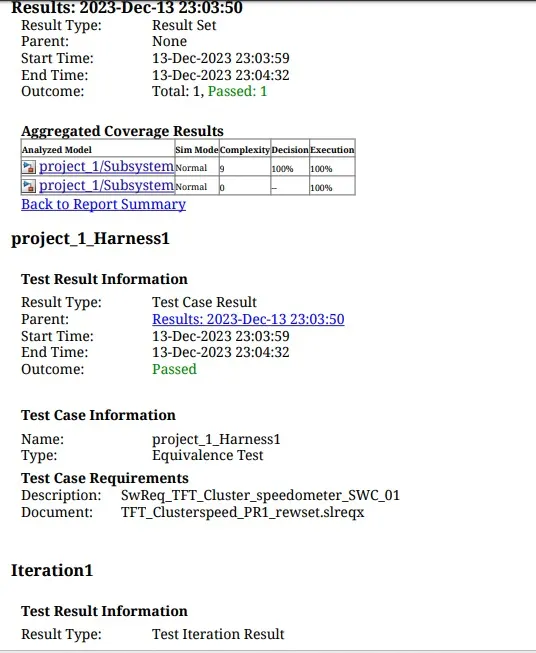
Here,all test cases are passed.
In new test case 1- only 50 % decision is achieved and 100% execution.
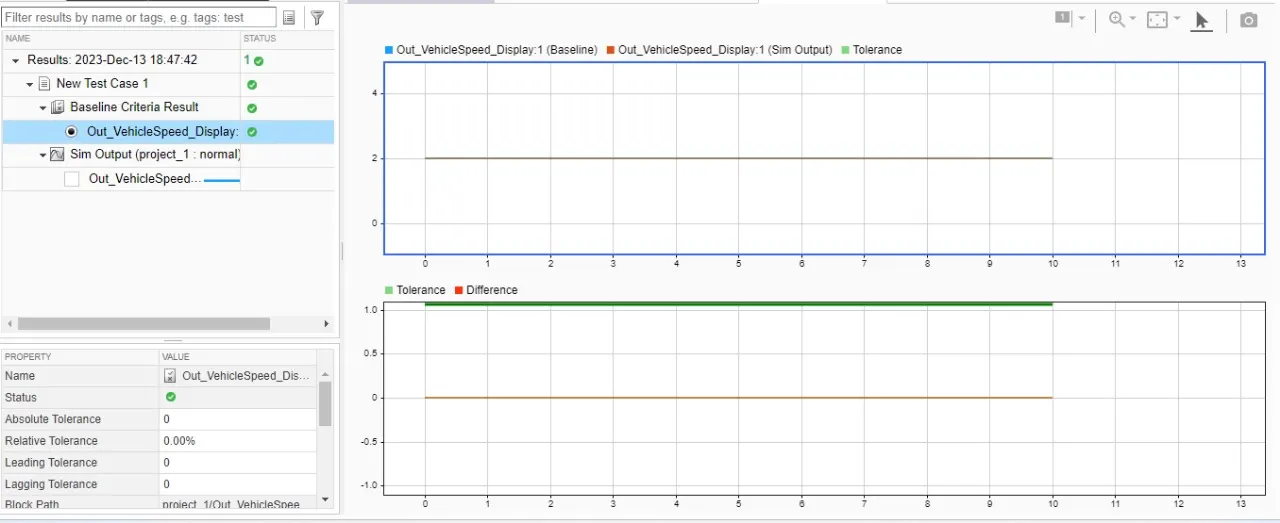
The output shown is OUT_vehiclespeed_display.OUT_vehiclespeed_display1 is 2 & OUT_vehiclespeed_display is 0.
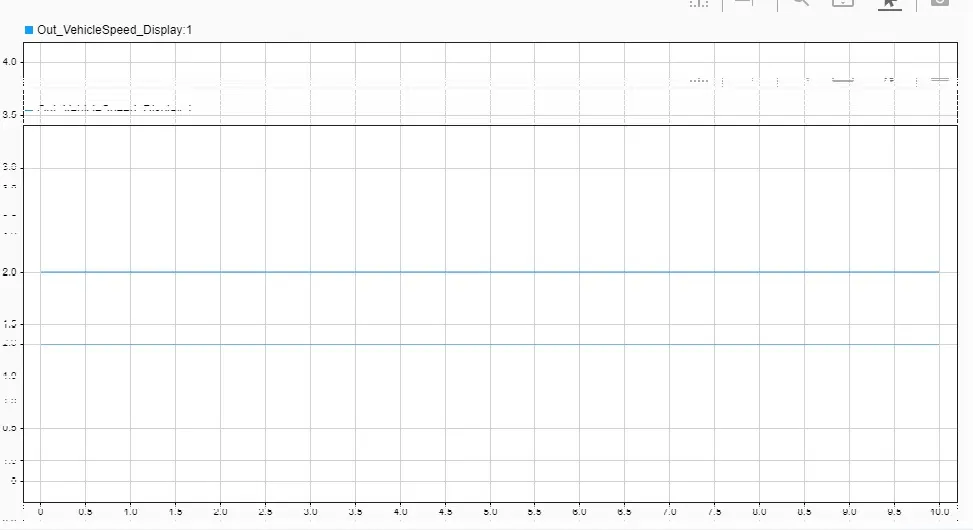
Output vehicle speed output:
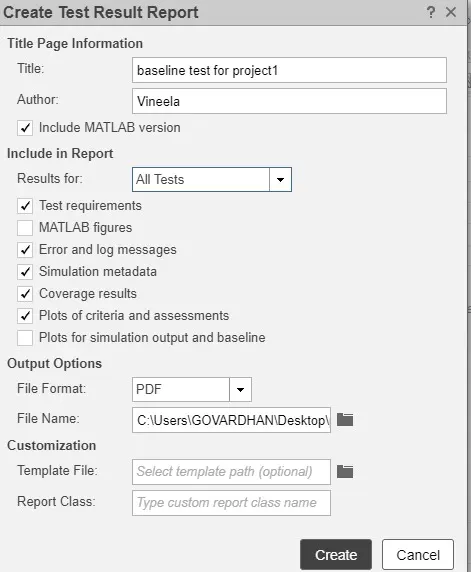
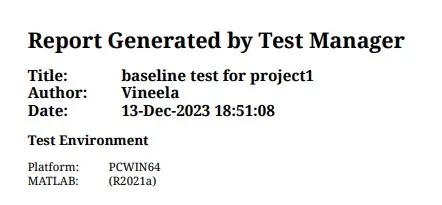
save all tests -> generate report on the basis of tests.right click on results -> give title name ,author andresults : all test,format:PDF -> apply -ok.
The report looks like below:
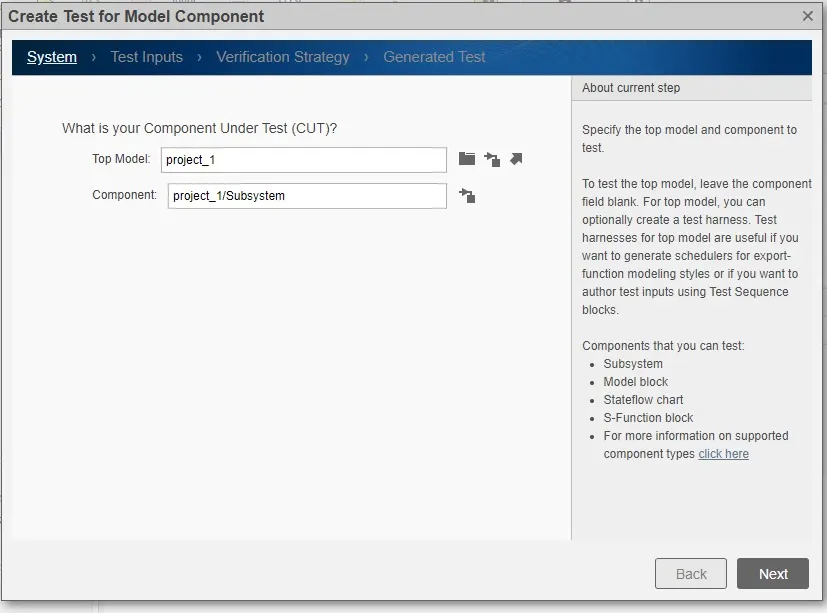
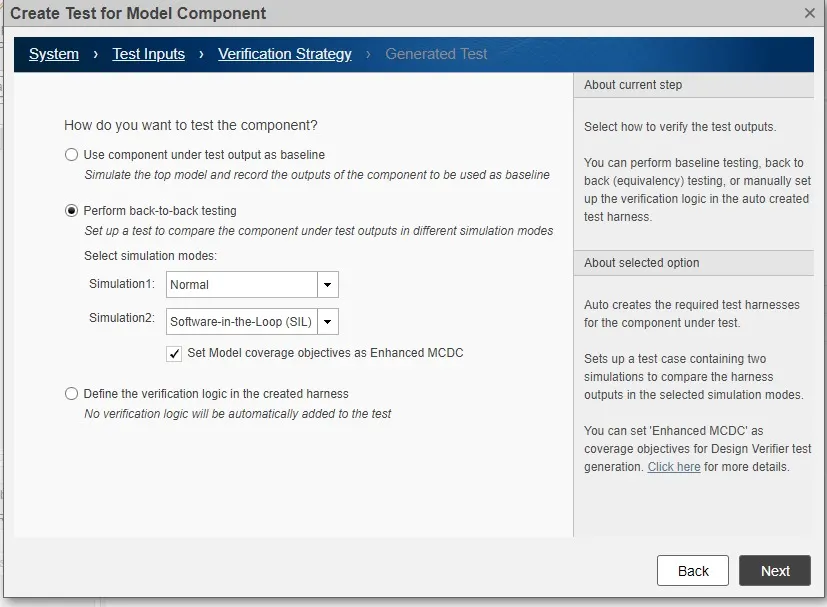
BACK TO BACK TEST: In test manager -> click on new -> give your test name -> apply -> ok. click on new select test for model component. window will open give top model name before this make sure give a click on model such that it easily identify tour model.-> click on next.
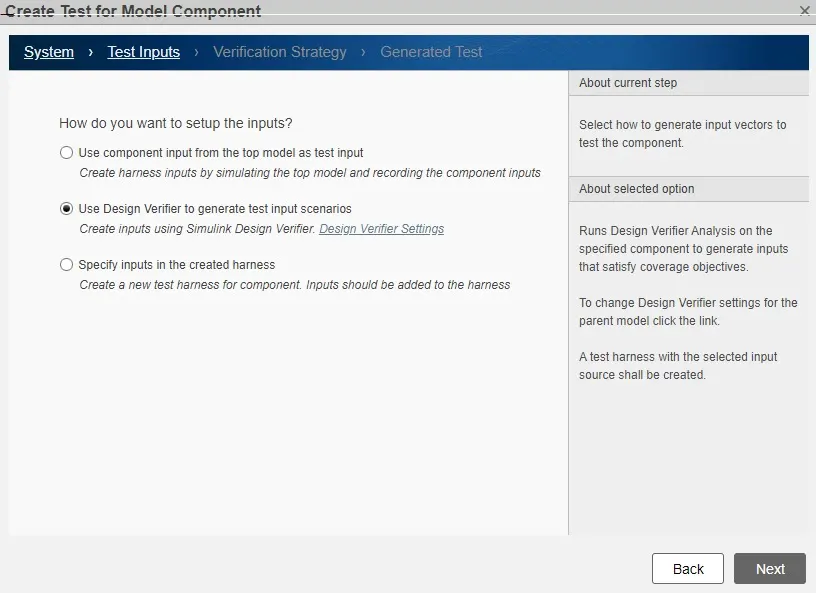
under test inputs: select use design verifier to generate test inputs scenarios. click on next.
under verification strategy: enable perform back-to- back testing simulation1:Normal simualtion2;SIL Click on next
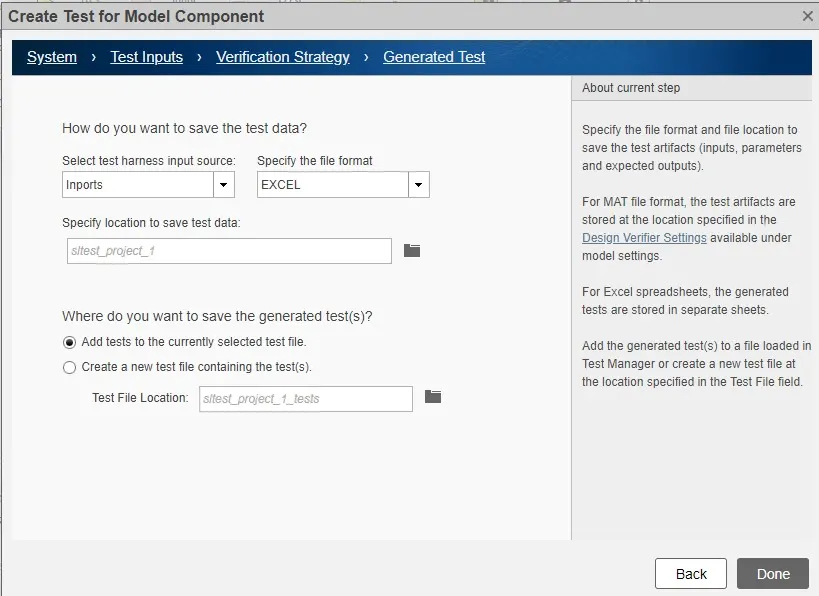
Under generated tests: select the harness input scenario: inports and format is EXecl enable -add tests to the currently selcted test file. -> click on Done.
A window will open it describes about how many objects are satisfied & unsatisfied. here20 objects are satisfied out of 20.
Go back to original model at bottom of the model symobol is shown click on that. MIL & SIL harness are present in that
MIL: harness shown below:
SIL:harness shown below:
Now we have to add the requirement click on New -> type: requirement set -use
Under the simulation: the information automatically get updated. requirements & simulation are updated like below, under coverge settinge: Enable record coverage for system under test.
under inputs: inputs are automatically get mapped,like below.
save all the tests -> click on RUN button.
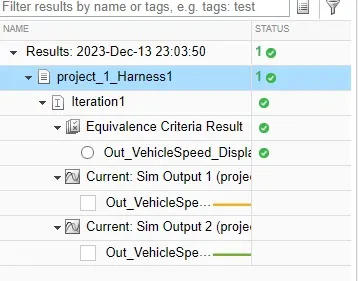
here,all test cases are passed shown below.
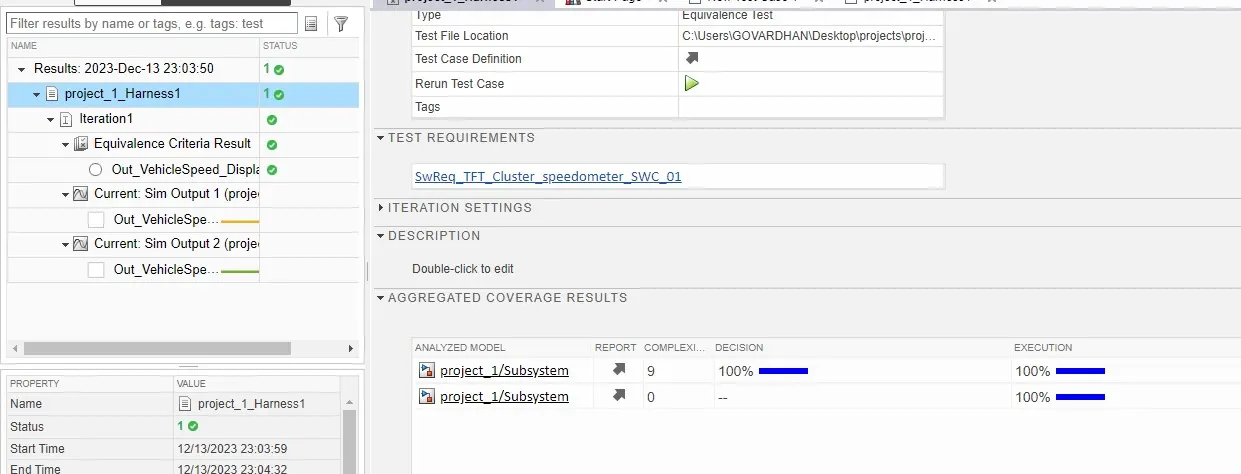
Harness 1 has 100% decision and 100% execution.
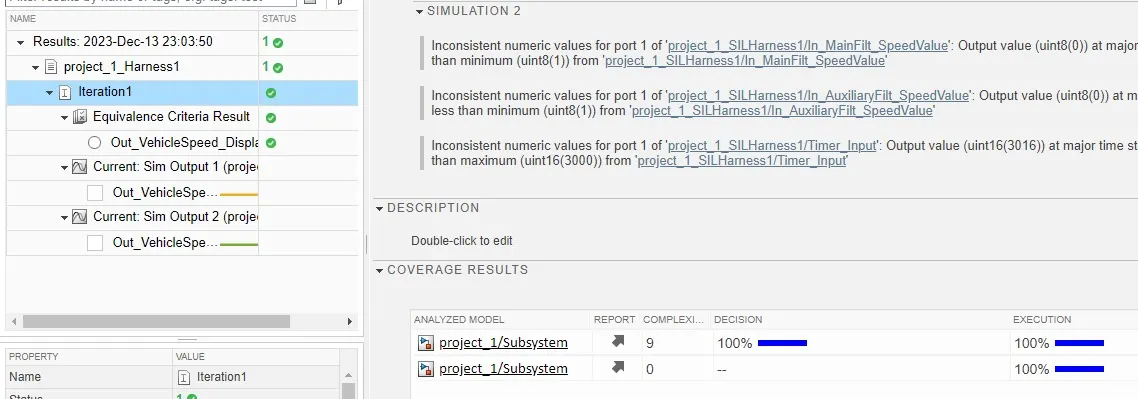
Iteration 1 has 100% decision and 100% execution.
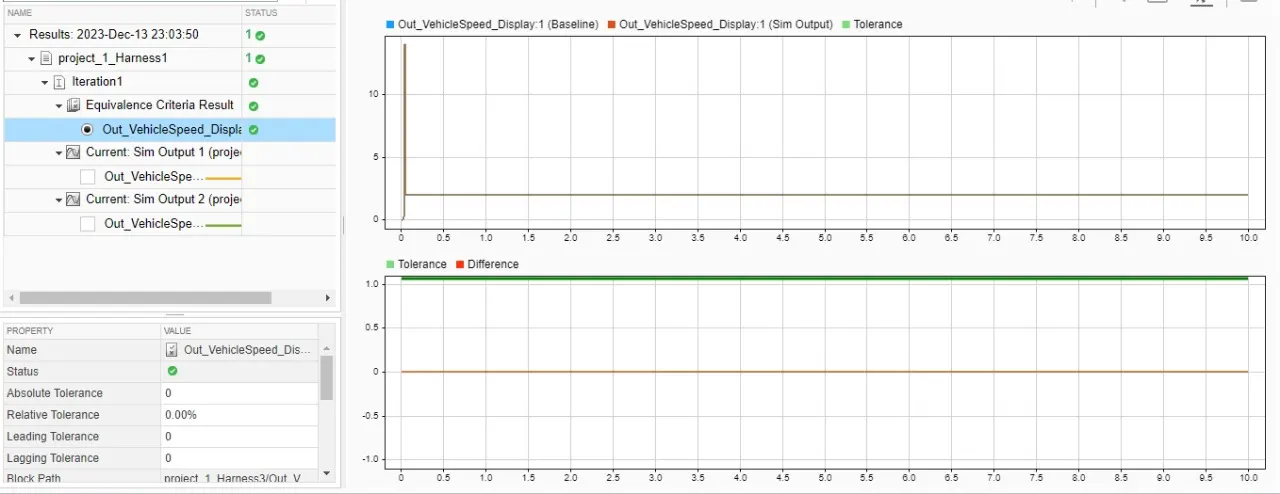
the graph shown below is output vehicle speed display.
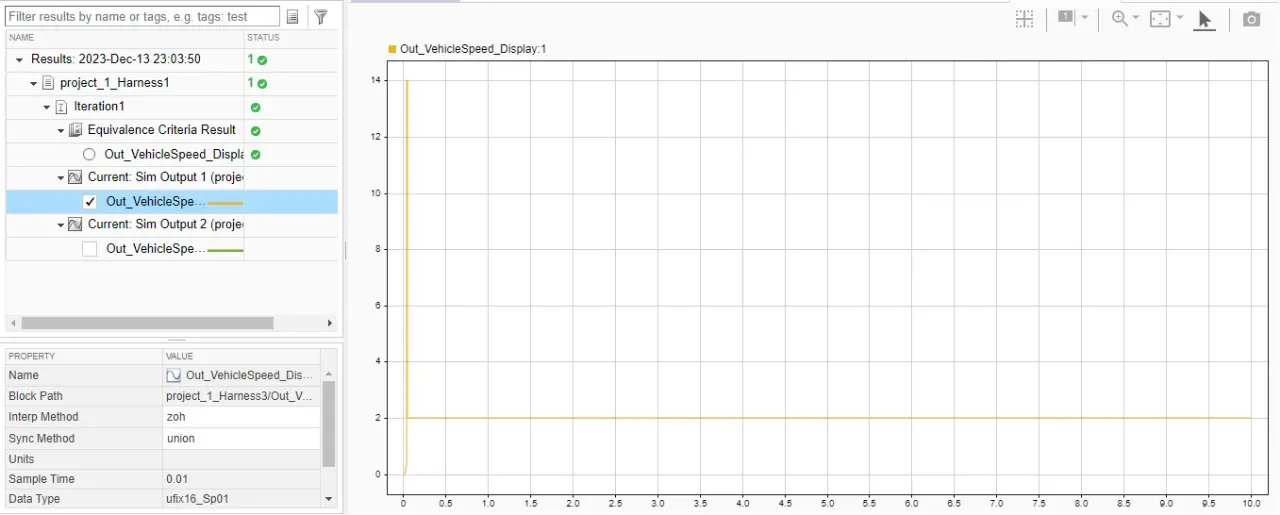
the graph shown below is output vehicle speed of sim output 1.
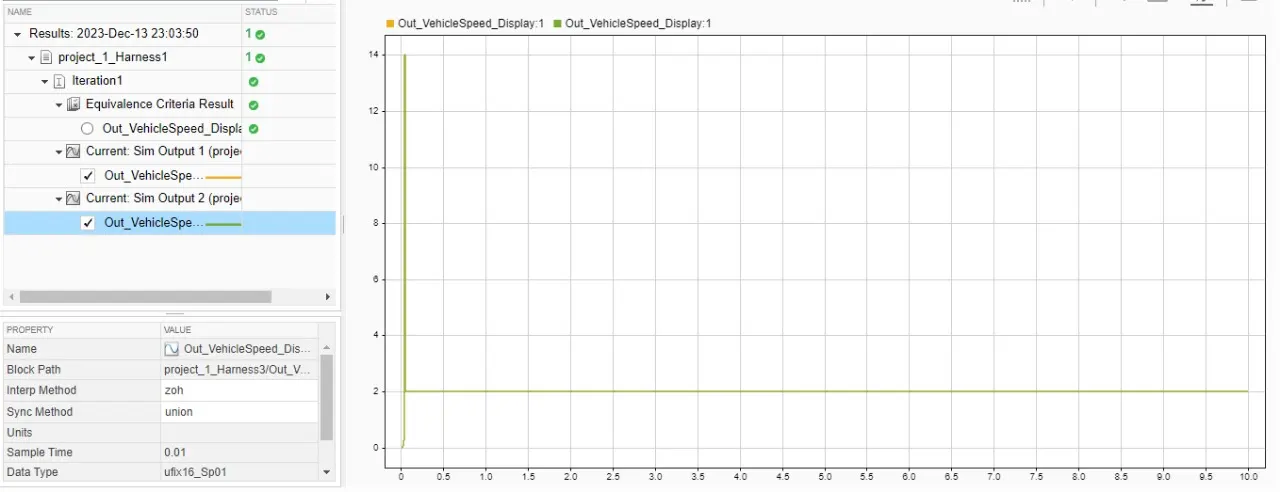
the graph shown below is output vehicle speed of sim output 2.
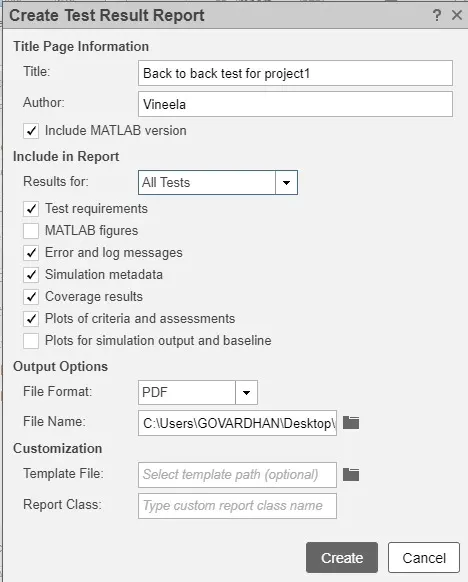
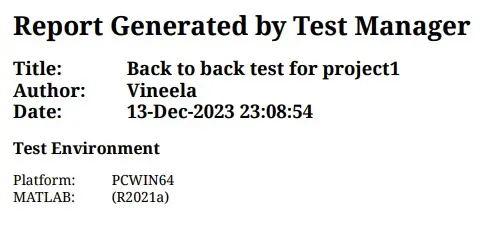
Now we have to generate report on back to back test. give right click on results -> give title name, author and results for: file format PDF ->apply -> ok -> create.
TEST GENERATION REPORT:
|
|||||||||||||||||||||||||||||