Project 2
Continution from project-1
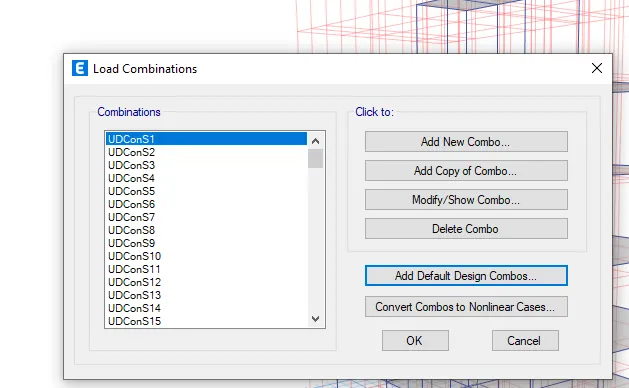
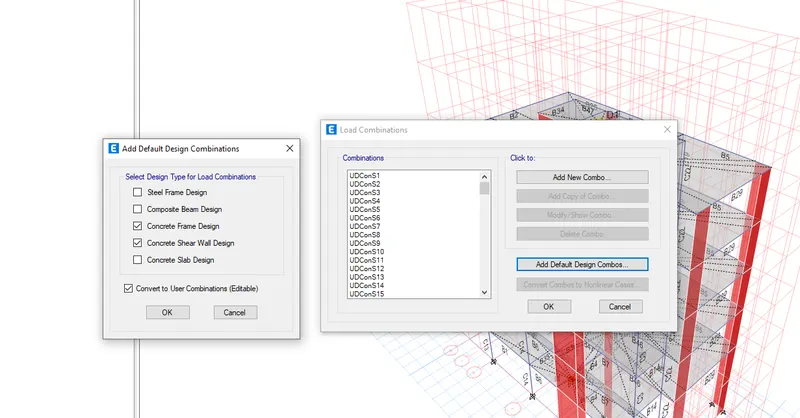
Define Load Combinations:-
Assigning the loads to the structure
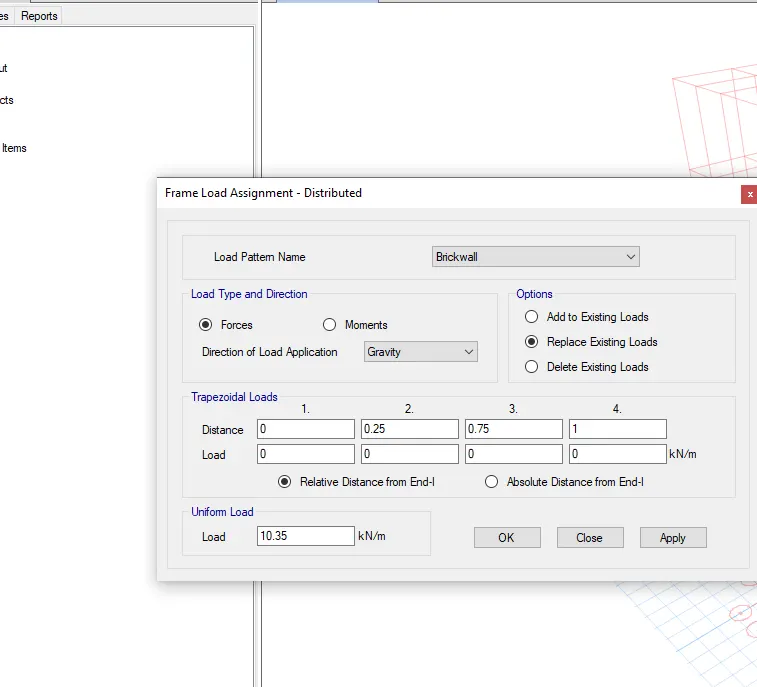
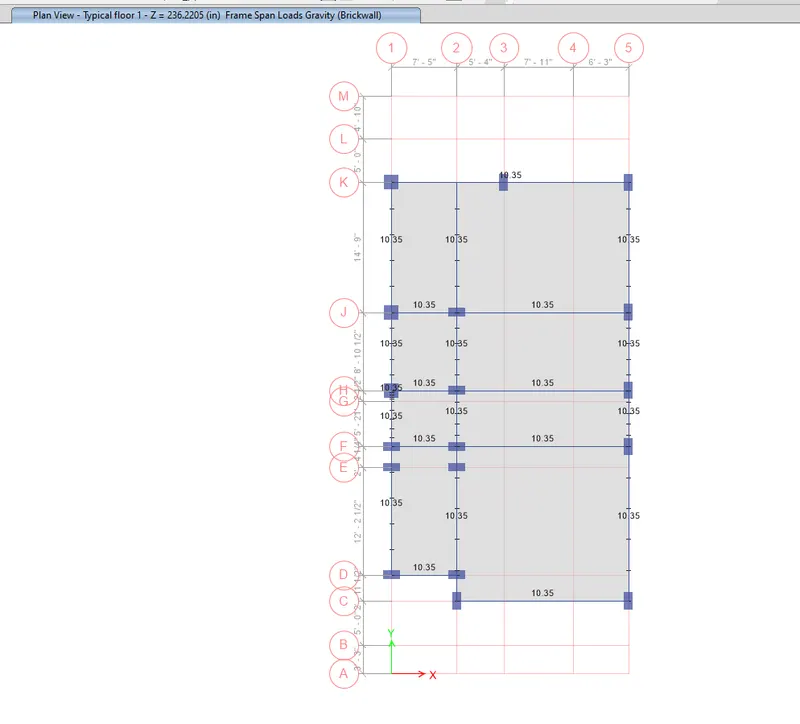
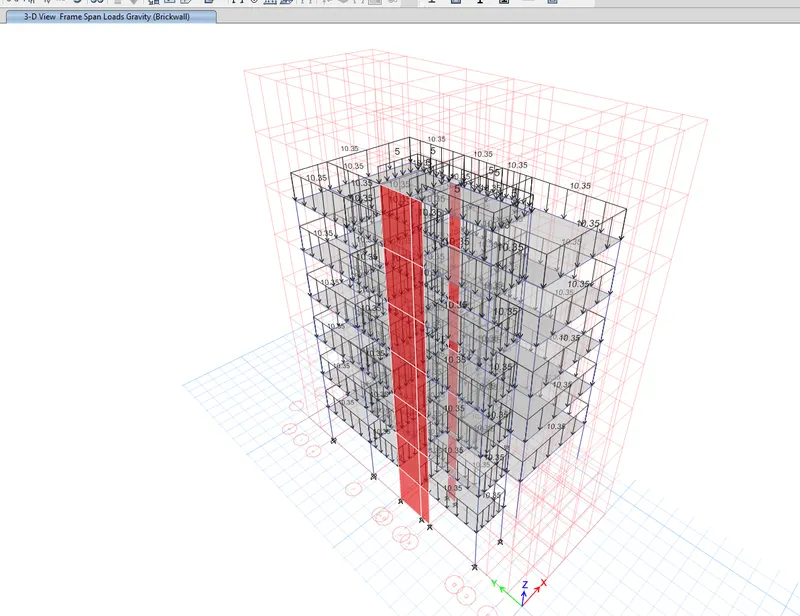
View of Brick wall load assign at all floors = 10.35 KN/m
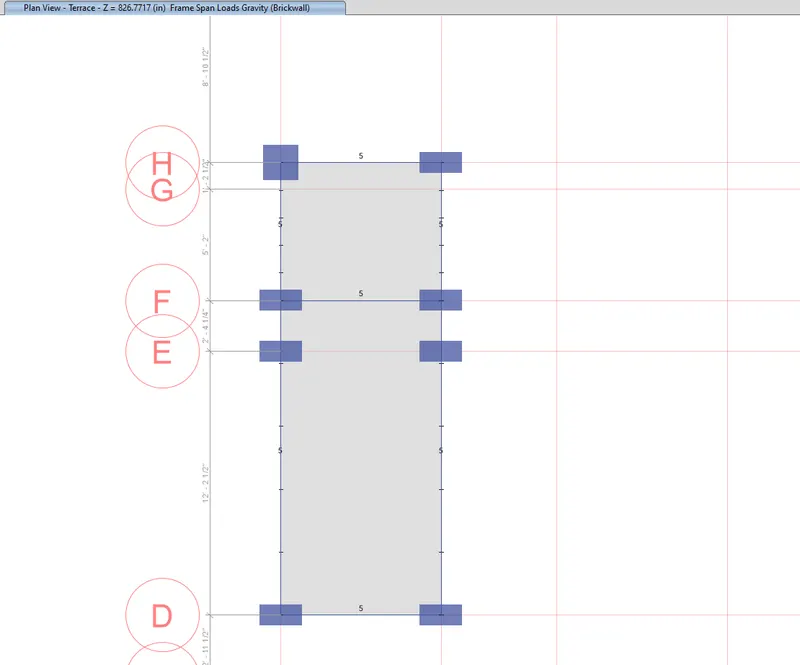
View of Brick wall load assign at Terrace floor = 5KN/m
Assign shell load to slabs = 4KN/m^2
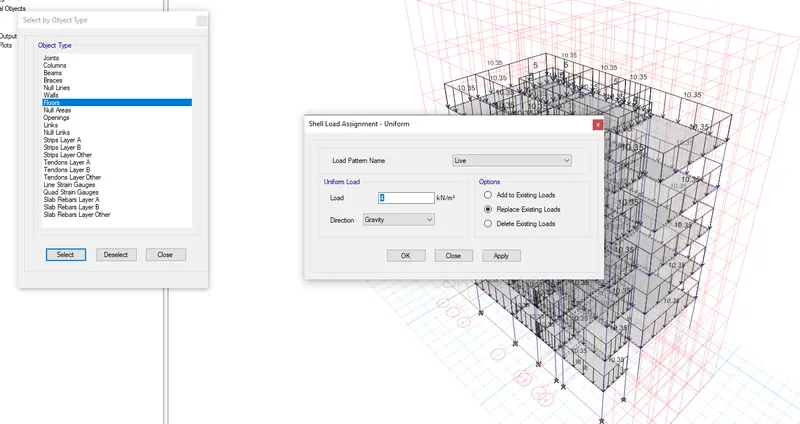
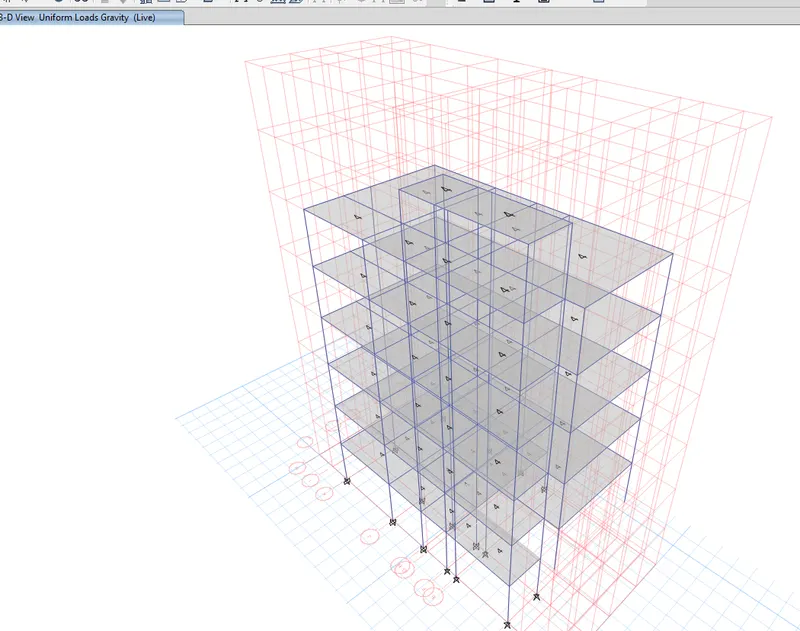
View of load applied
Shear wall palcement is identified after addressign the weak portion in the building to attain stability for modes
Create Mass source data
For Dead load multipler = 1
For Live load multipler = 0.5
as per IS 13920 for load > 3KN/m^2
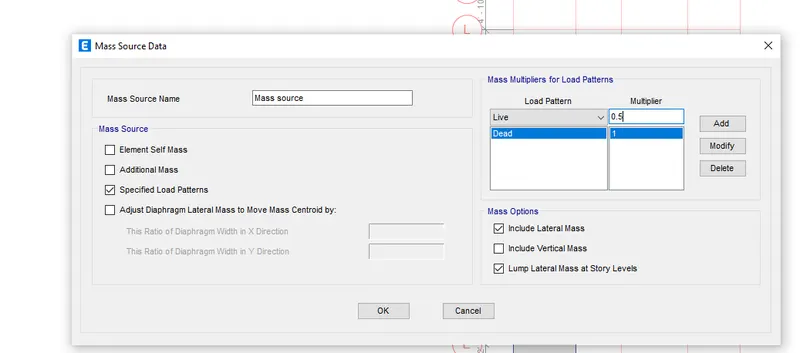
Define load patterns
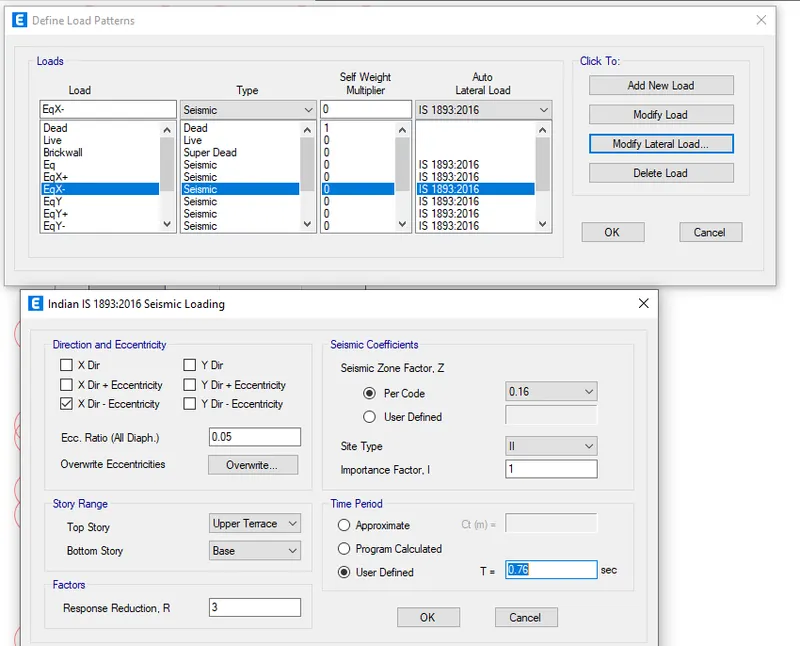
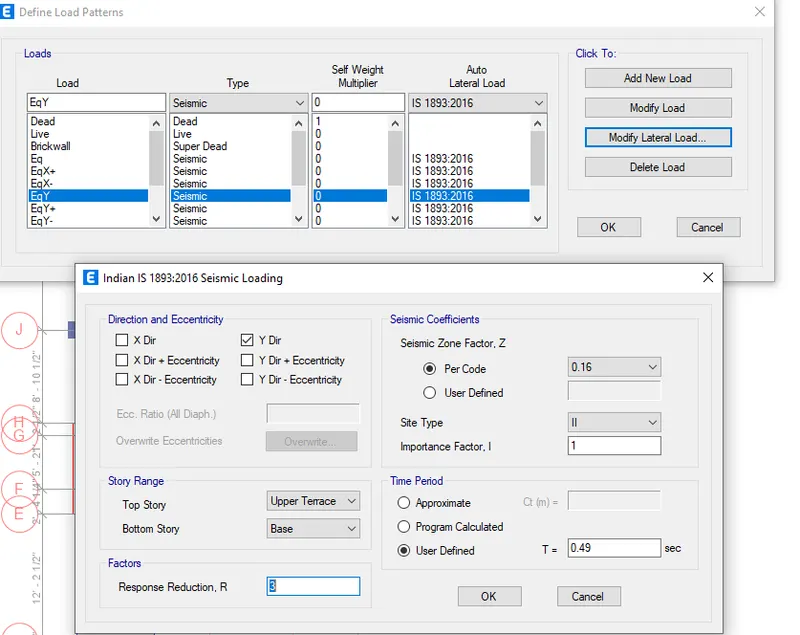
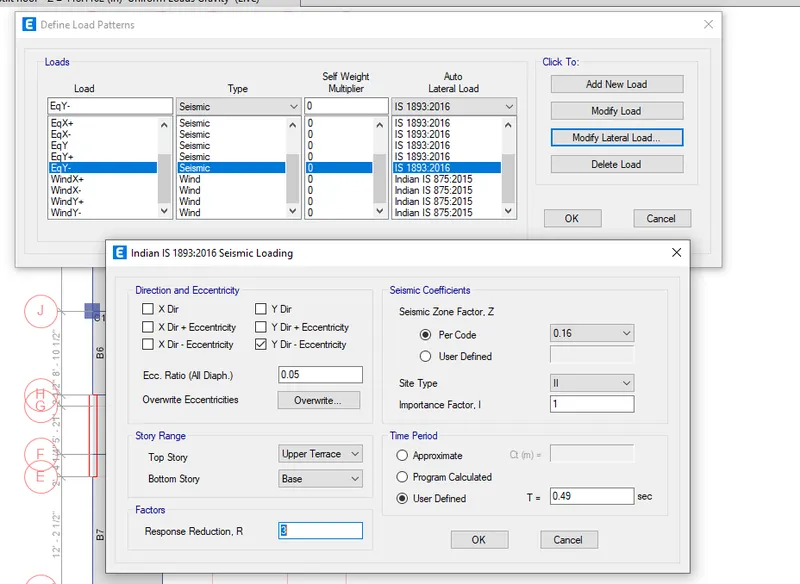
For Earthquake loads
EQX
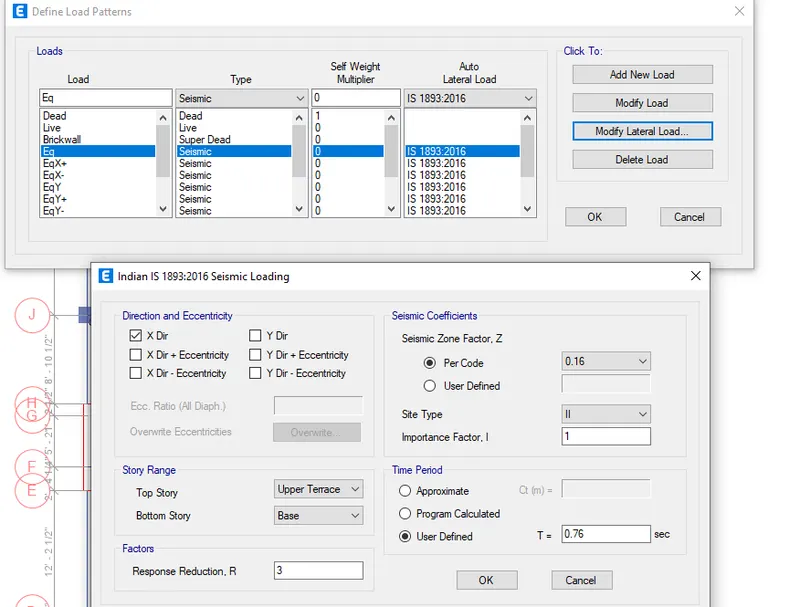
EQX+
FOR EQX-
FOR EQY
FOR EQY+
FOR EQY-
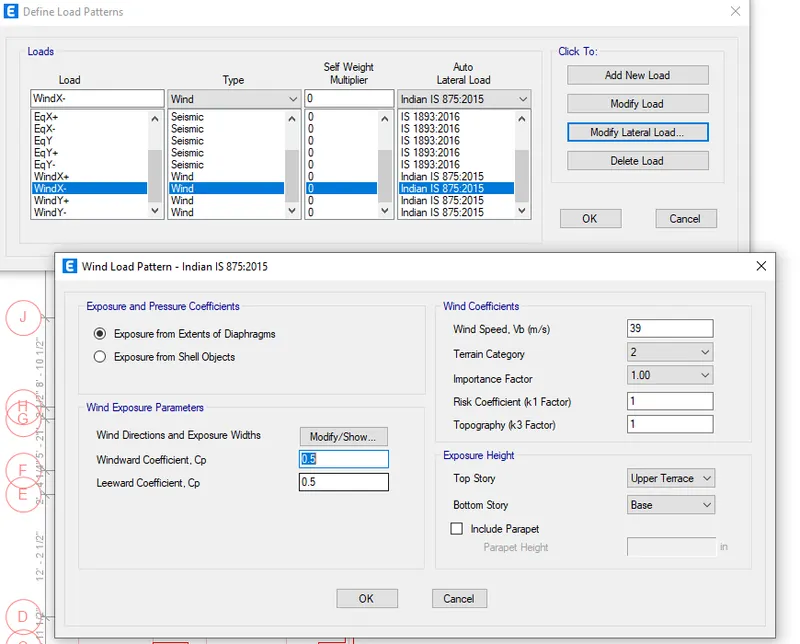
Wind load Assign in wind X+
Wind X-
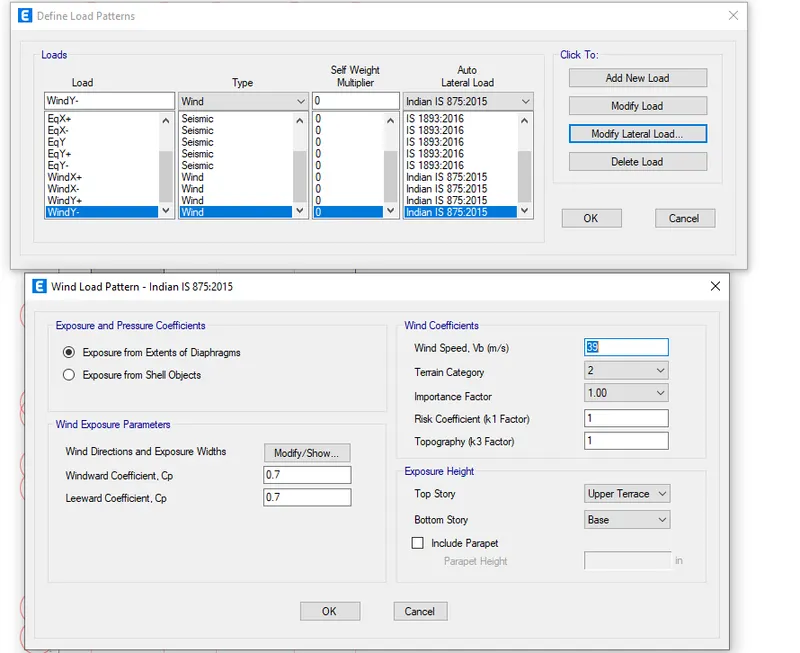
Wind Y+
Wind Y-
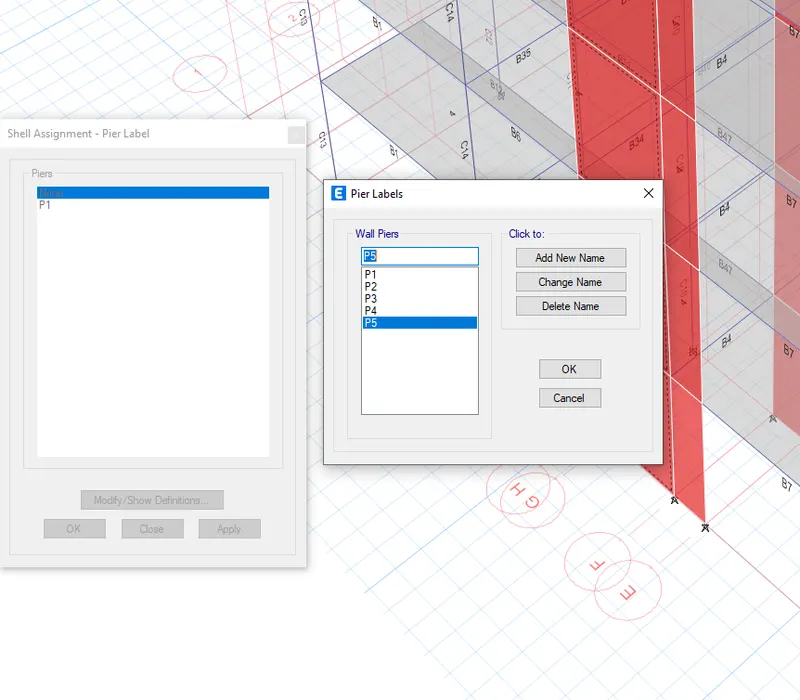
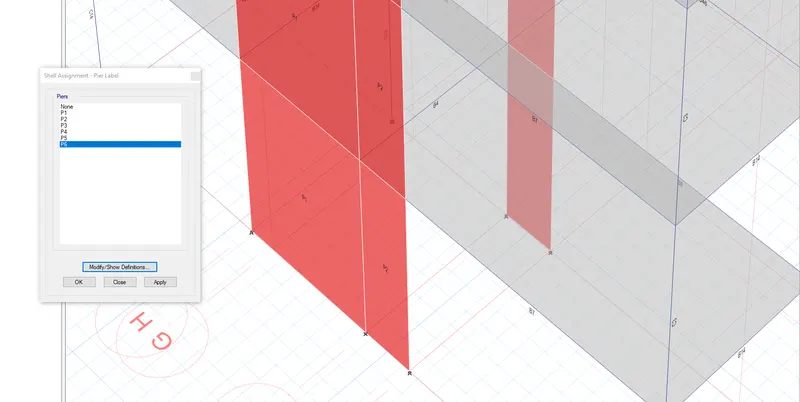
Create pier labels for the shear walls
Go to Assign > Shell assignment > Pier label
Create Pier labels and assign them
P1,P2,P3,P4,P5,P6 for 6 shear walls
Define Diaphragm
for the slab to get as combined structure with Beams and Columns
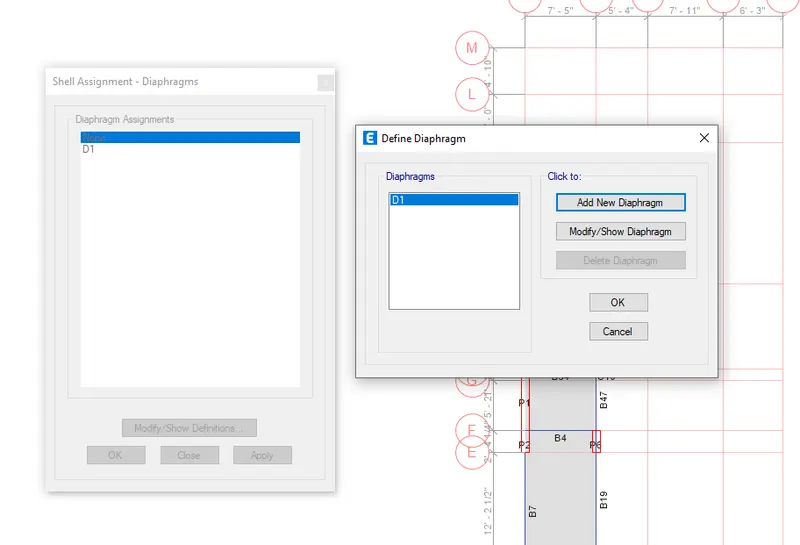
Assign Dia[hram for all the floors
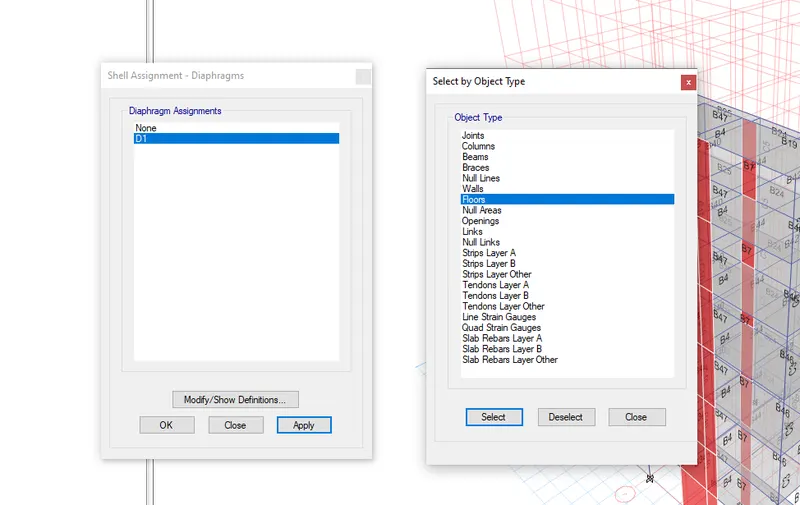
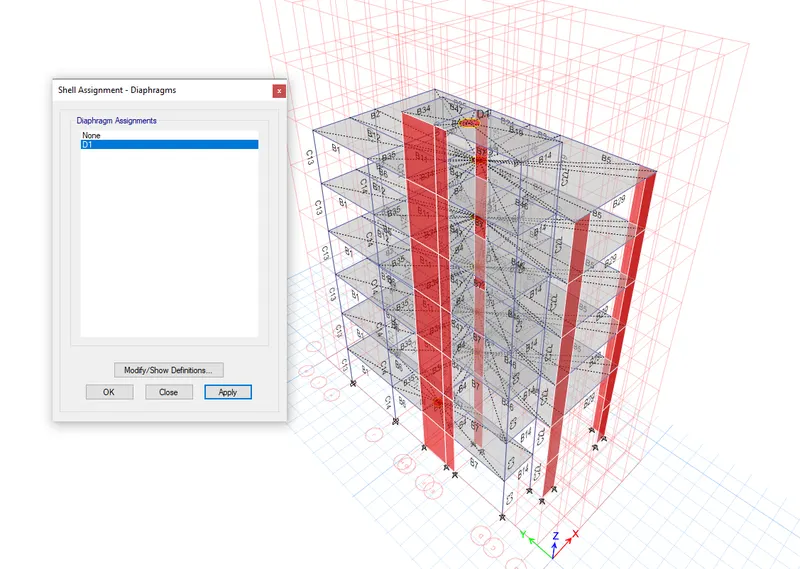
View of Diaphragm assignement
again create new load combinations
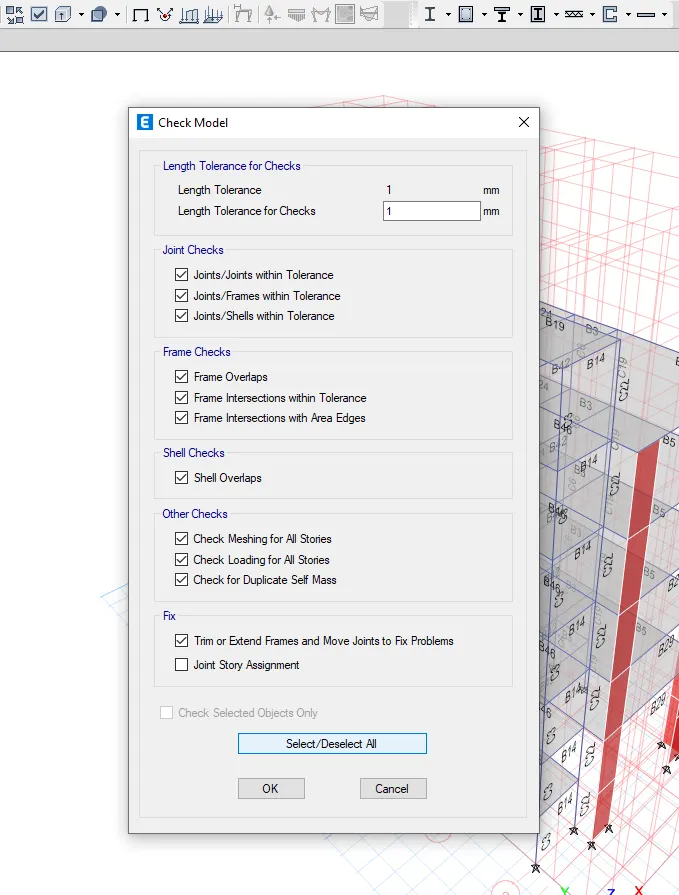
Now the model for Errors
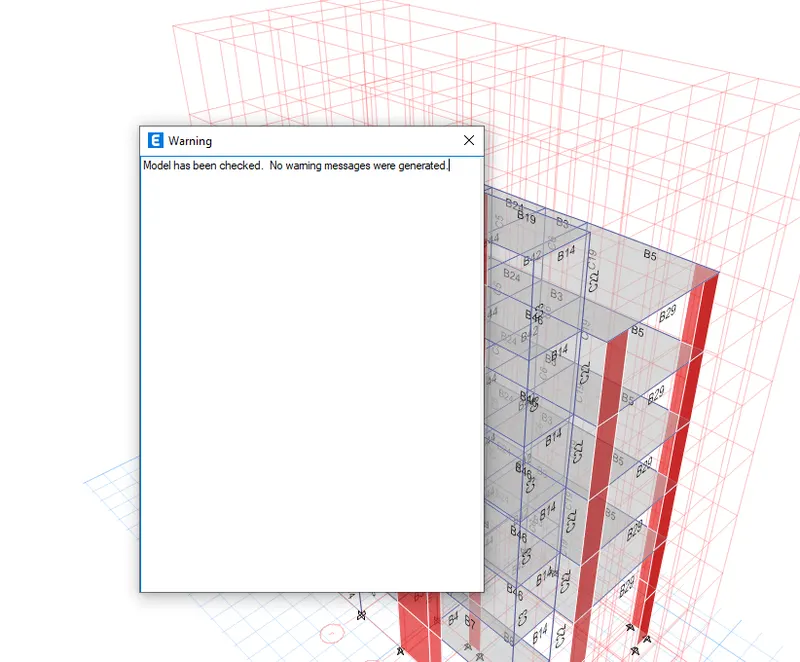
It is observed that there are no warnings and errors for the structure.
Now for the Precast structure it is obvious that all the joints of beams and columns are pinned also the floor and Walls it is necessary to make edge release for all the joints
To create joints go to Assign > Shell assign > Edge releases
Select the Floors, walls
To create joints go to Assign > Frame assign > Edge releases
Select the joints of beams and columns.
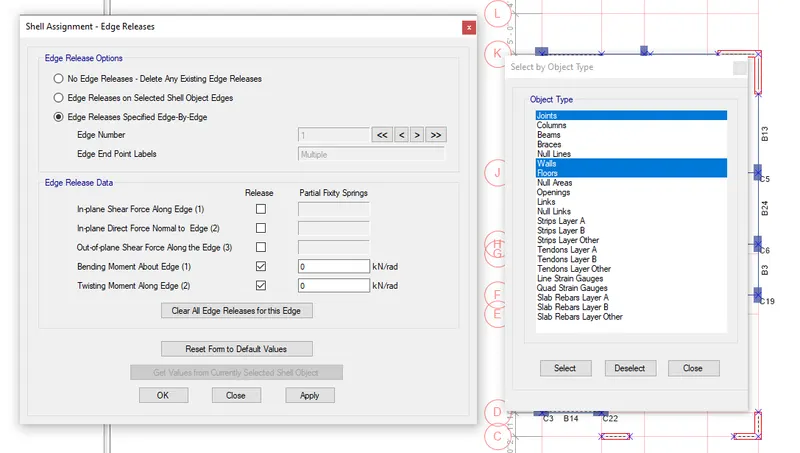
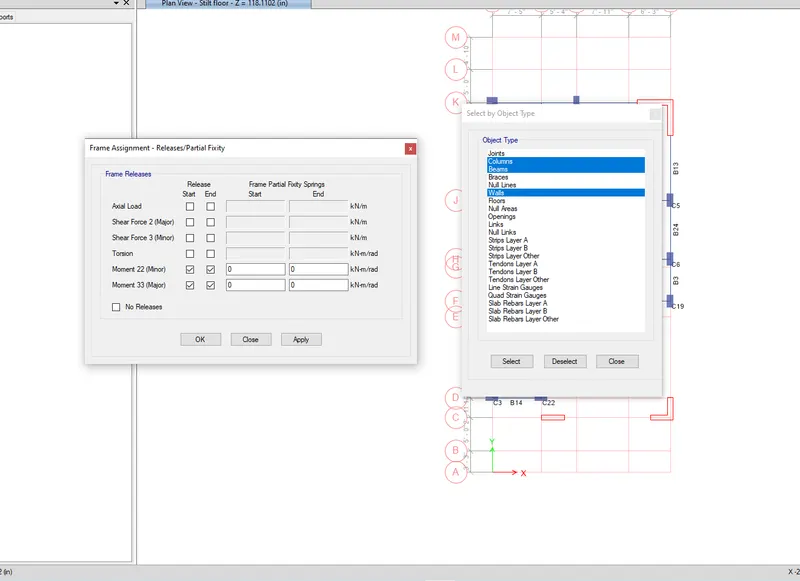
View of pinned joints at all the floors, walls, beams-column joints
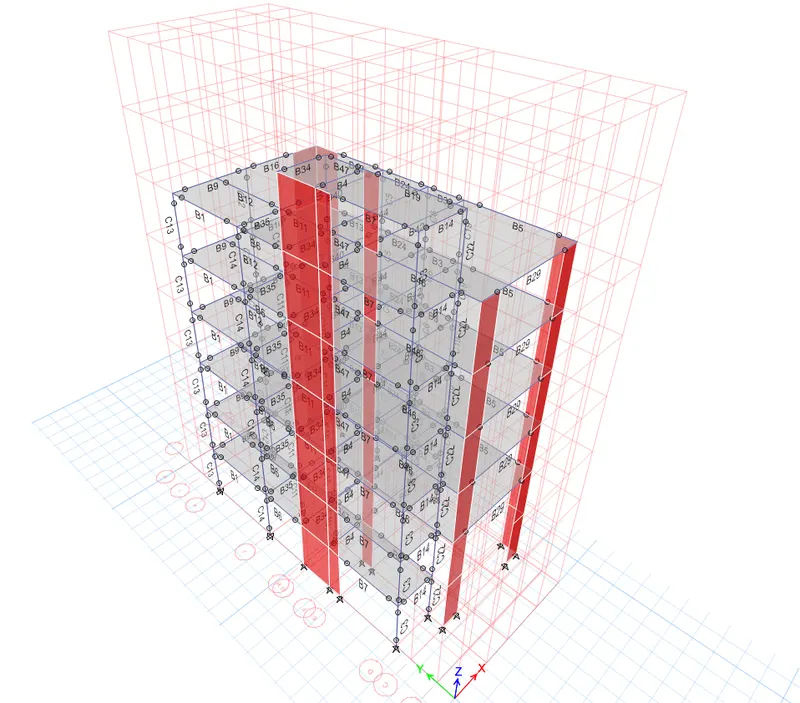
Now Analyse the structure
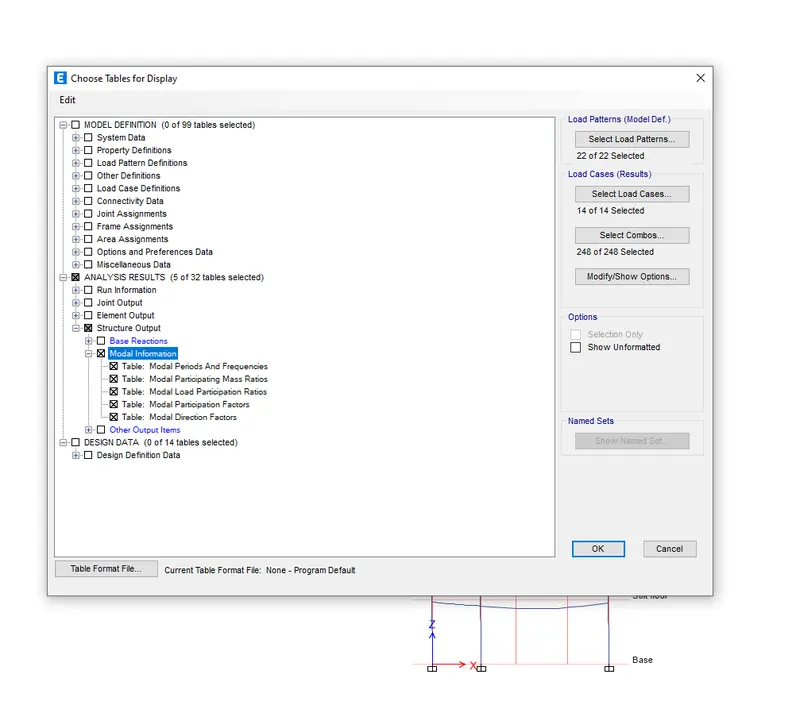
Analyse the Modal Participation factor for the analysis
Modal ParticipationMass Ratios are observed for the precast structure the first modal participation Mass Ratio has time period = 0.764 and Reaction in X direction = 0.6952 = 69%
The second Modal participation Mass Ratio has time period = 0.552 and Reaction in Y direction = 0.643 = 64%
The Third Modal Participation Mass Ratio has Time Period = 0.368 and Reaction in Z direction = 0.6689 = 66%
The participation mass ratios are observed in the certain range that is permissible with the time period for
Zone 2 Building
Also the Difference between the Modal mass ratio is also in the range with the difference of approximate 5%
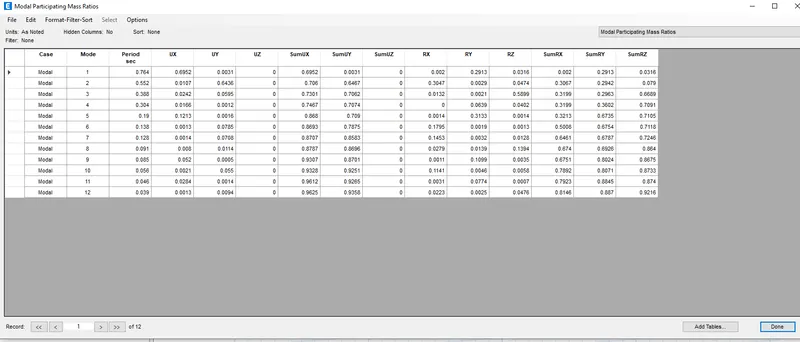
The structure is very much stable for the two modal participation ratios but the third modal ratio need to be some enhanced.
View of the Results:
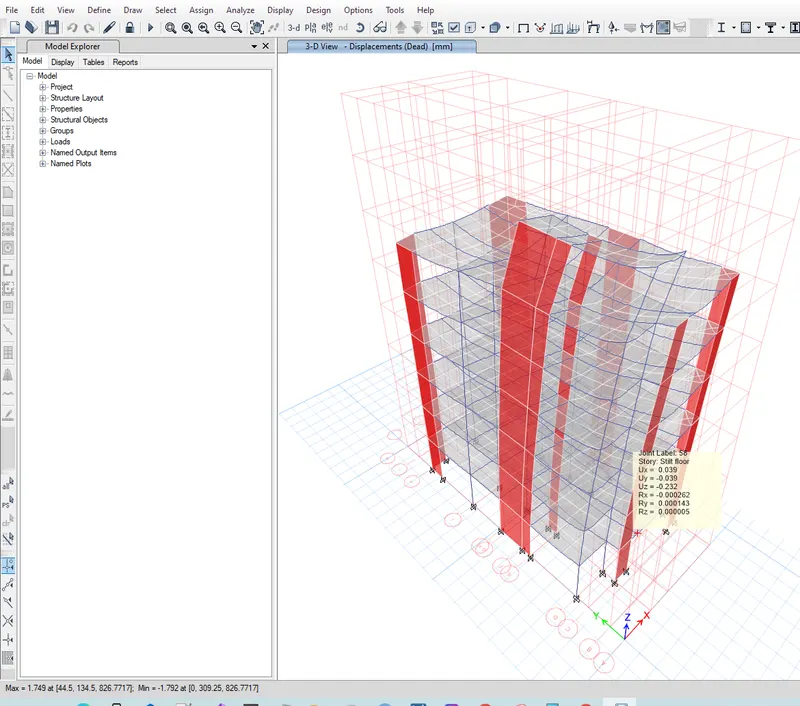
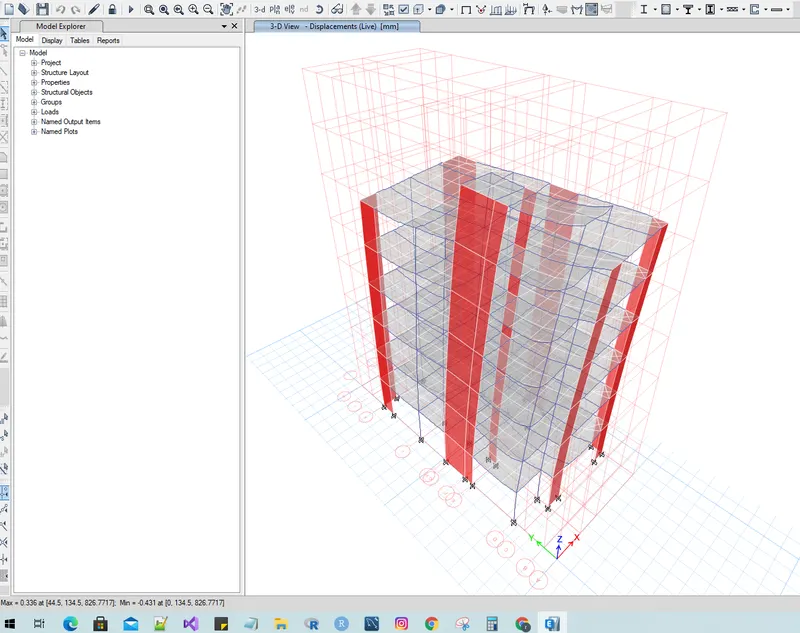
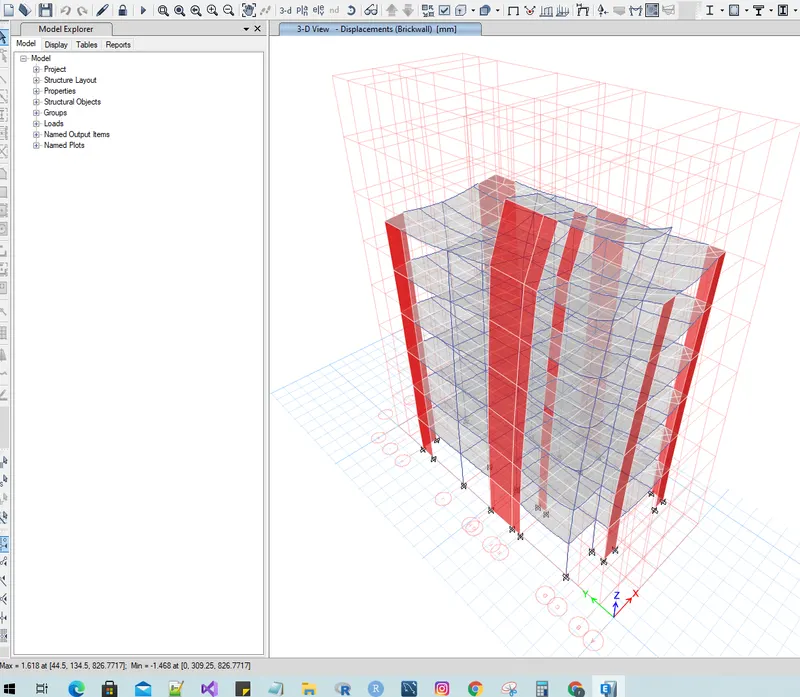
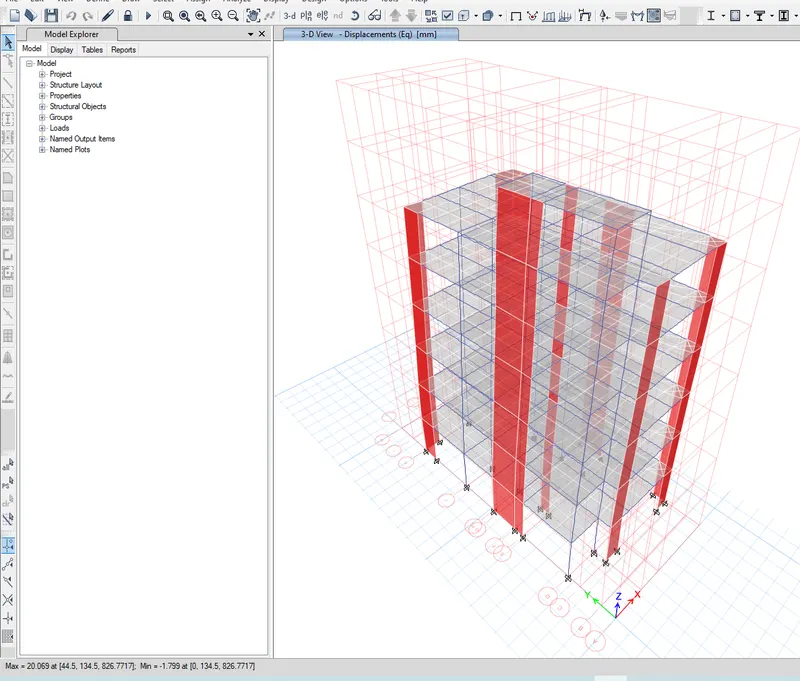
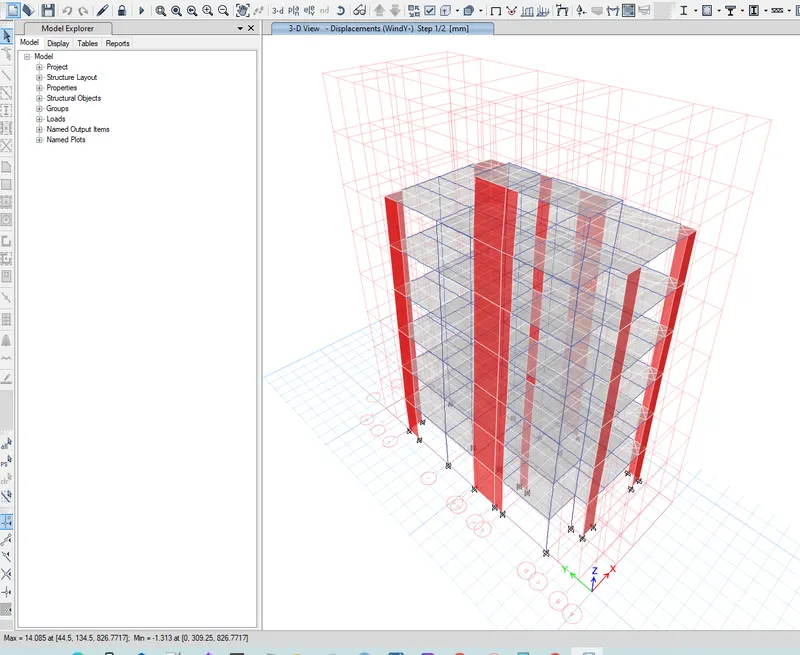
Displacement results for the Model
Dead load = 1.75 mm (Maximum and Minimum)
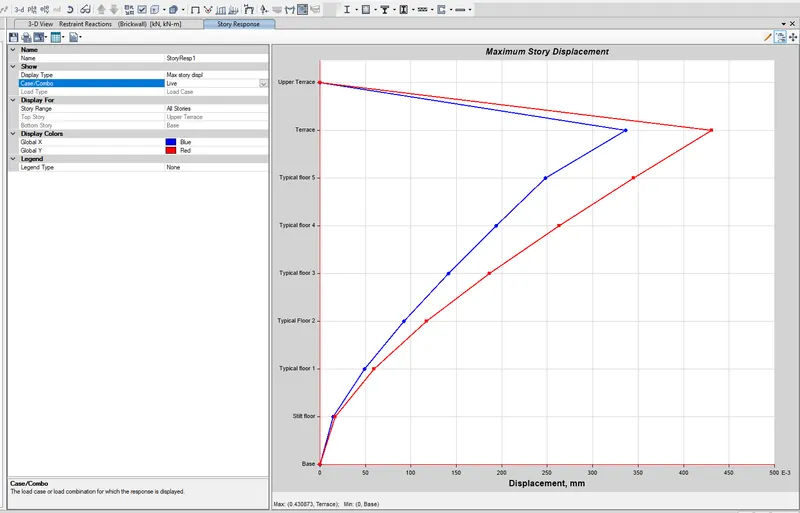
Live load = 0.4 mm (Maximum and Minimum)
Brick Wall load = 1.6 mm Maximum
= -1.5 mm Minimum
Earthquake load EQ X
= 20mm Maximum
= 1.8mm Minimum
Earthqake load EQy
=20 mm Maximum
= 1.8 mm Minimum
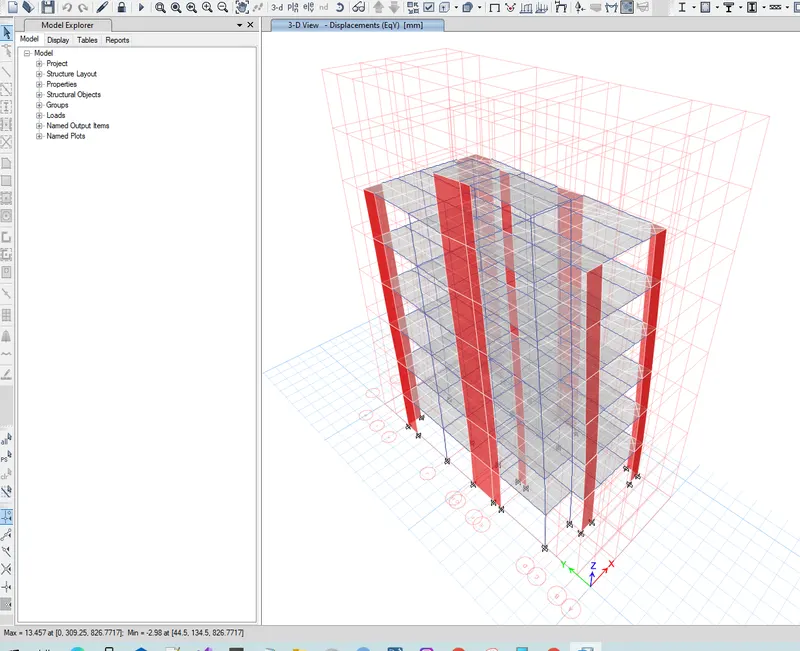
Wind load X+
=10mm Maximum
= 0.9 mm Mimum
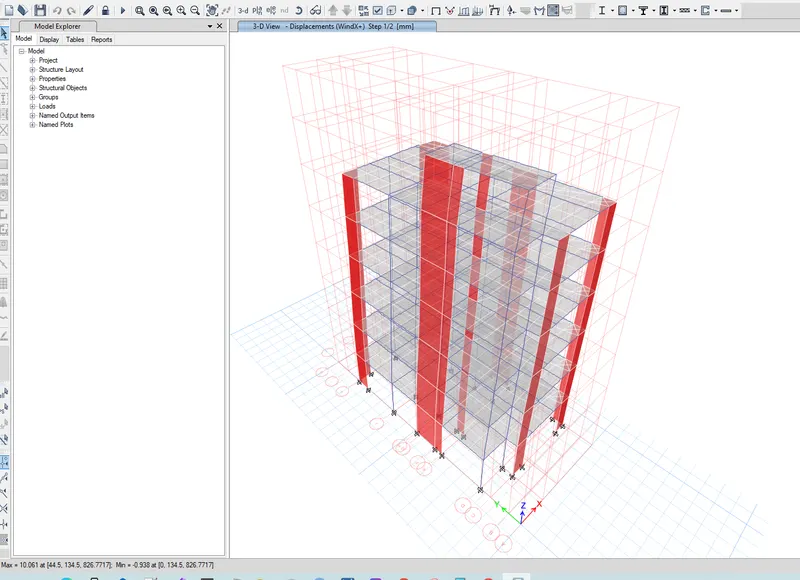
Wind load X-
= 10mm Maximum
= 0.9mm Minimum
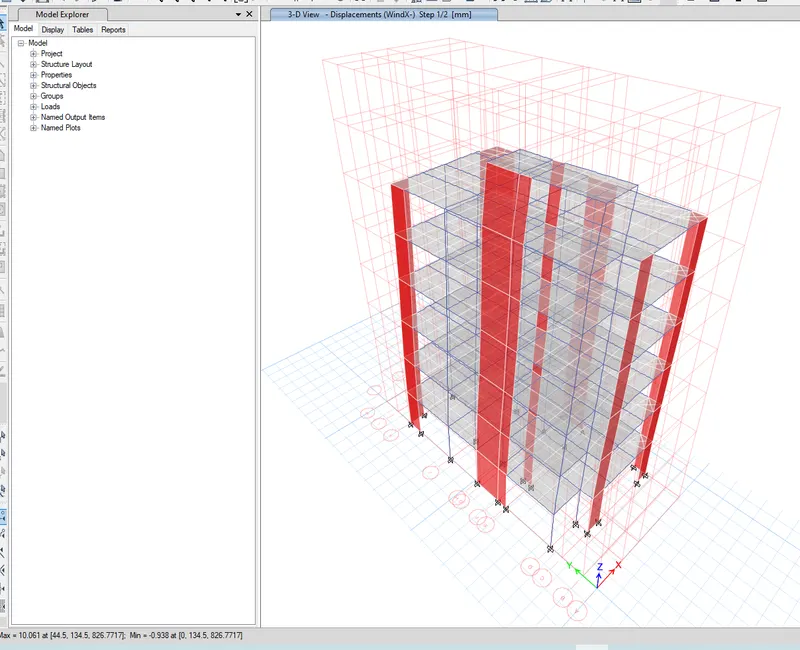
Wind load Y+
=14mm Maximum
= 1.3 Minimum
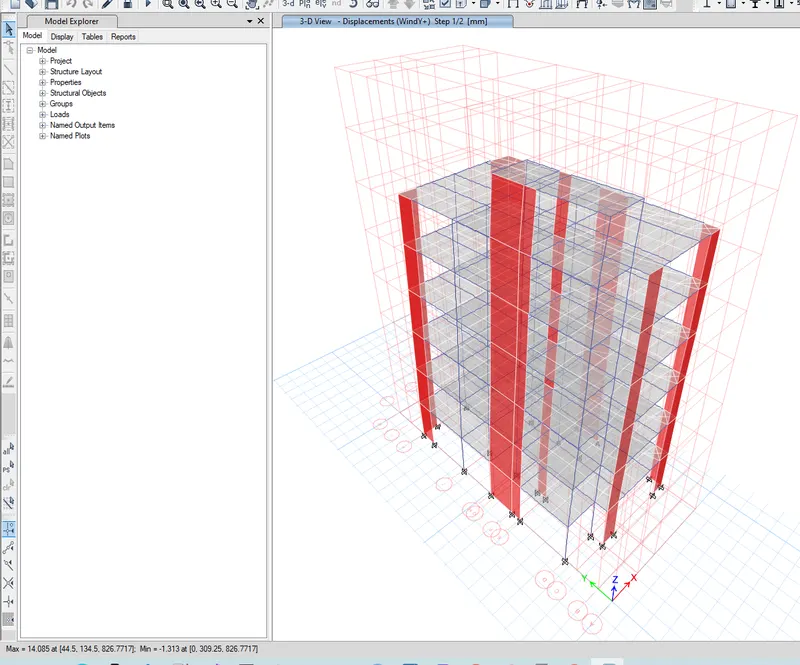
Wind load Y-
= 14mm Maximum
=1.3mm Minimum
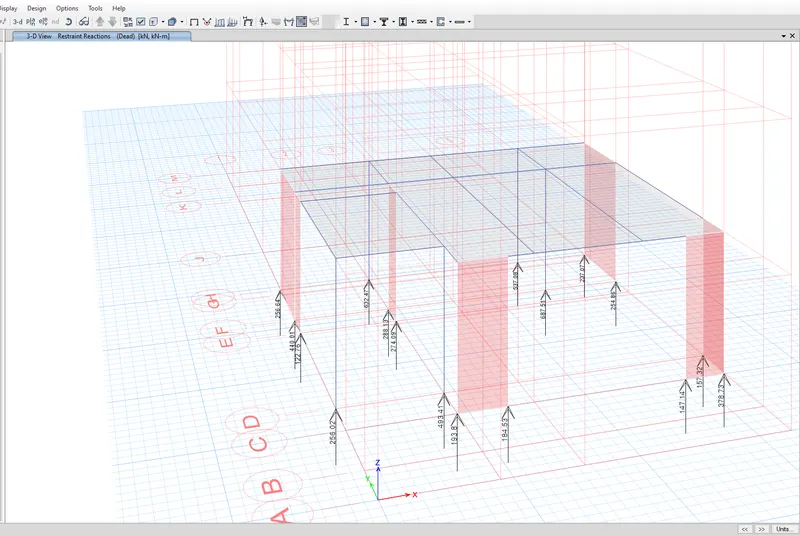
BASE REACTIONS
Base reactions for Dead load are observed with in the near ranges of 145 KN to 680 KN
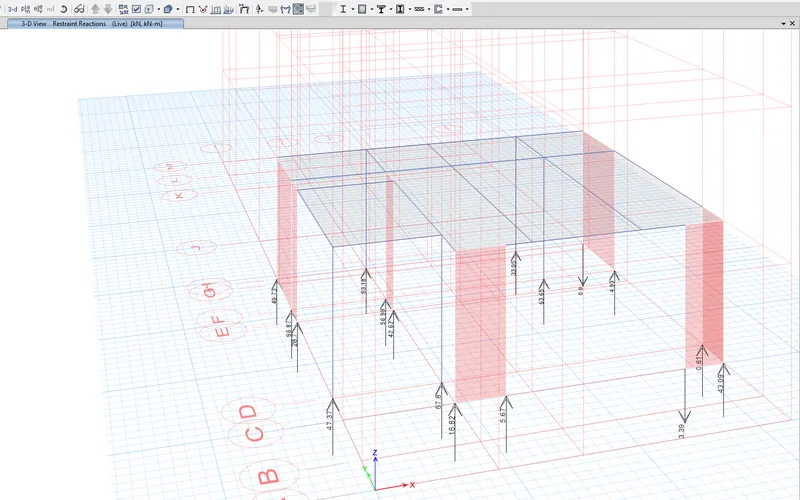
Base Reations for live load are observed with in the near ranges of 15 KN to 96KN
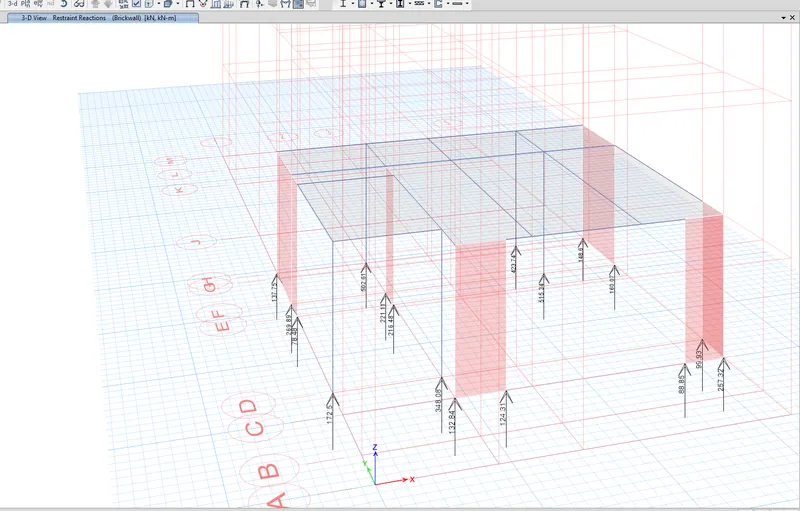
Base Reactions for Brick wall load are observed with in the near ranges of 78 KN to 515 KN
Base Reactions for Earthquake load are observed with in the near ranges of 11 Kn to 87 KN Eqx
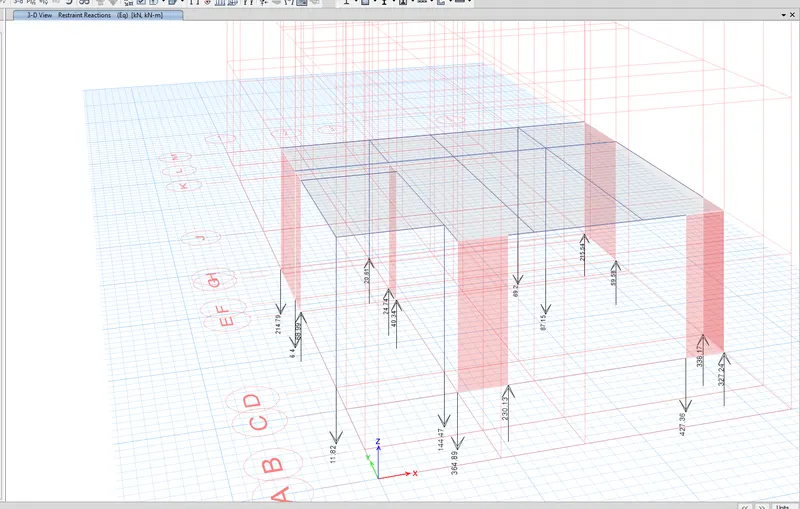
Base Reations for Earthquake load are observed with in the near ranges of 20 KN to 390 KN EQX+
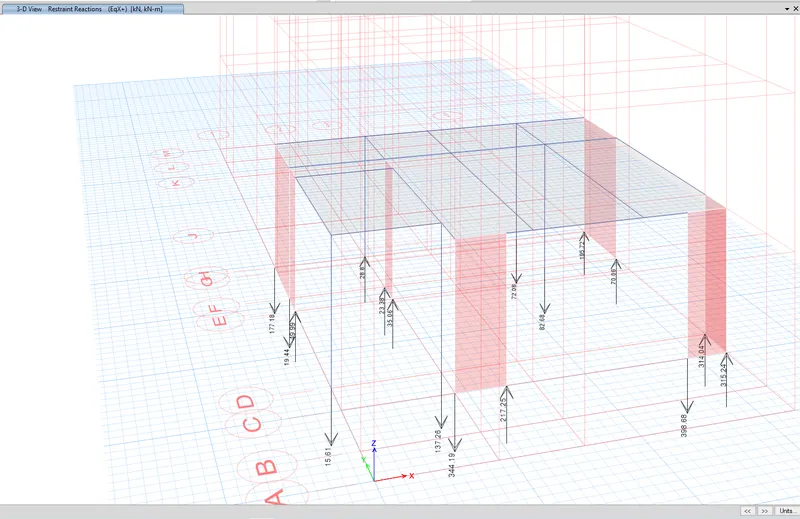
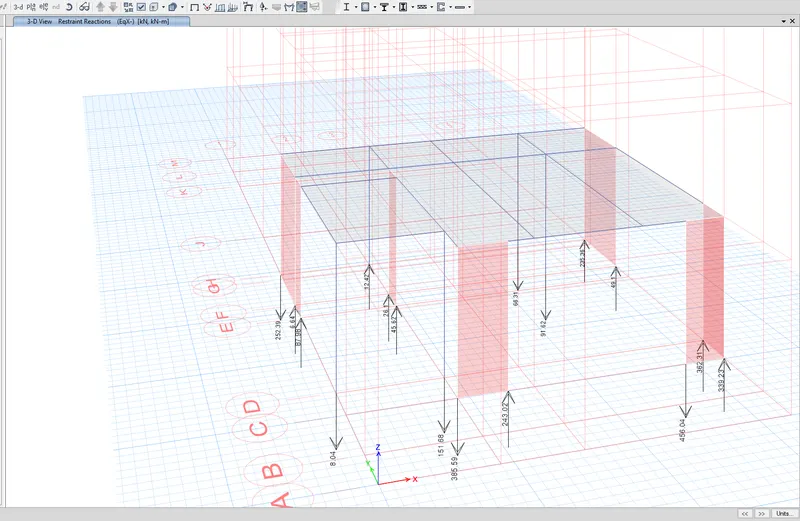
Base Reactions for Earthquake are observed with in the near ranges of 8 KN to 380 KN EQX-
Maximum Story Drifit
Maximum story displcement for Dead load 1.8mm
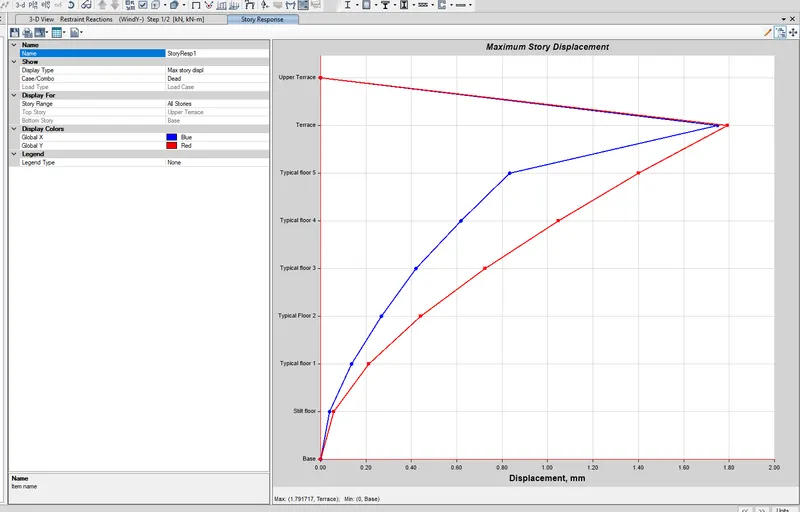
Maximum story Displacement for Brick wall load 1.6 mm
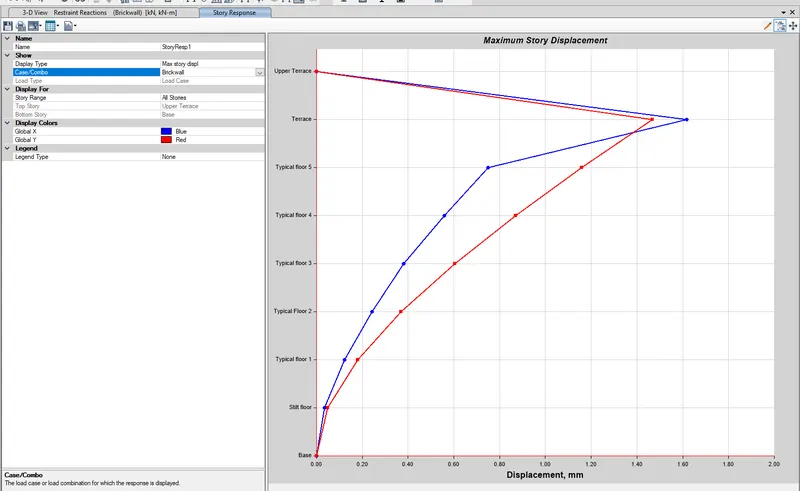
Maxium story Displacement for Eqx+ load 19 mm
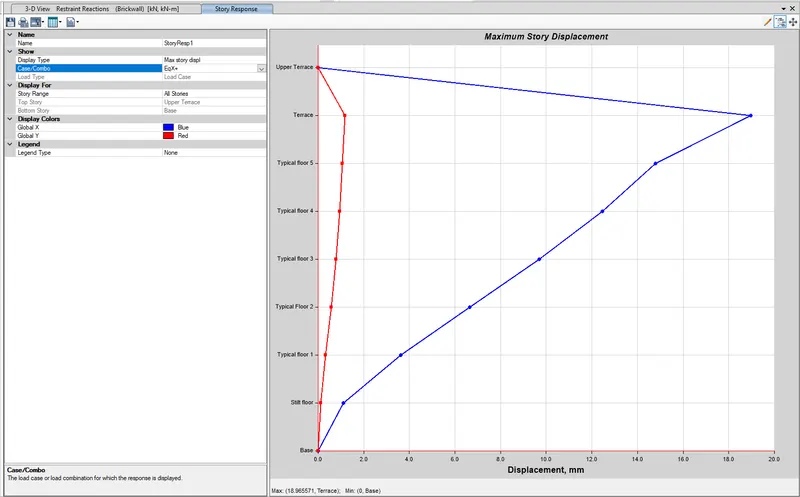
Maximum story Displacement for Eqx- load 21 mm
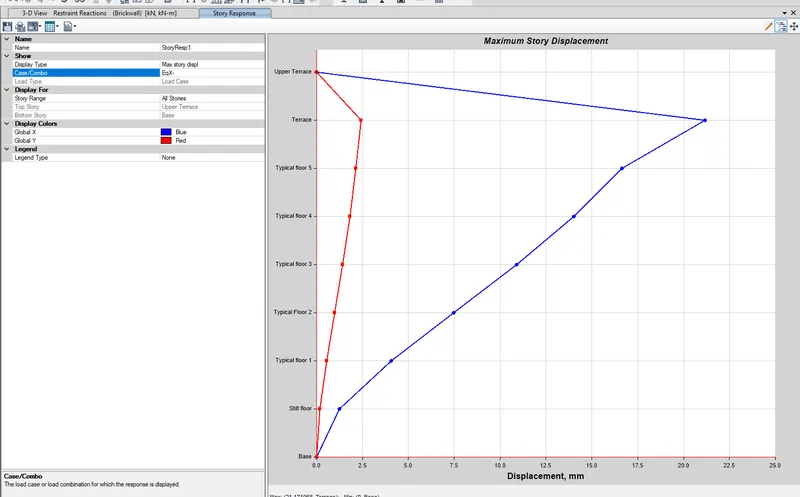
Maximum story Displacement for Eqx load 13.5 mm
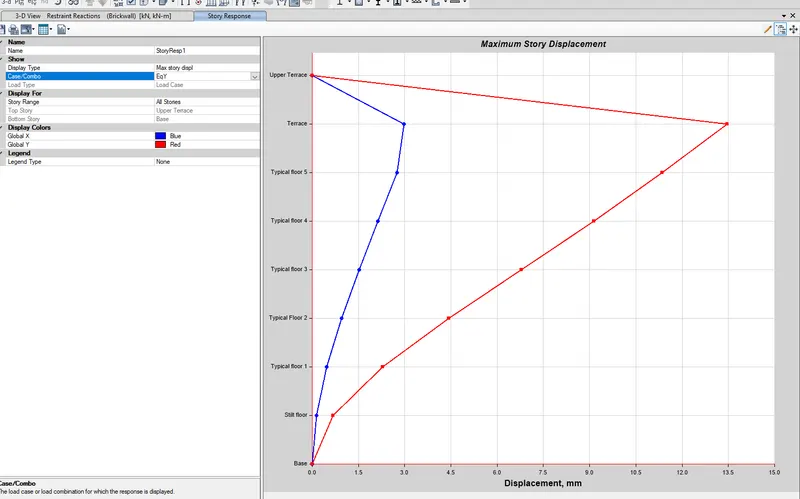
Maximum story dispalcement for EQY+ load 19mm
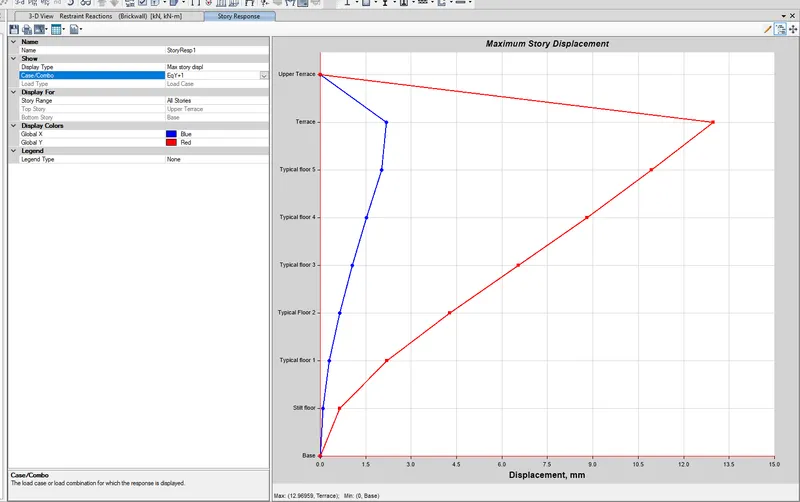
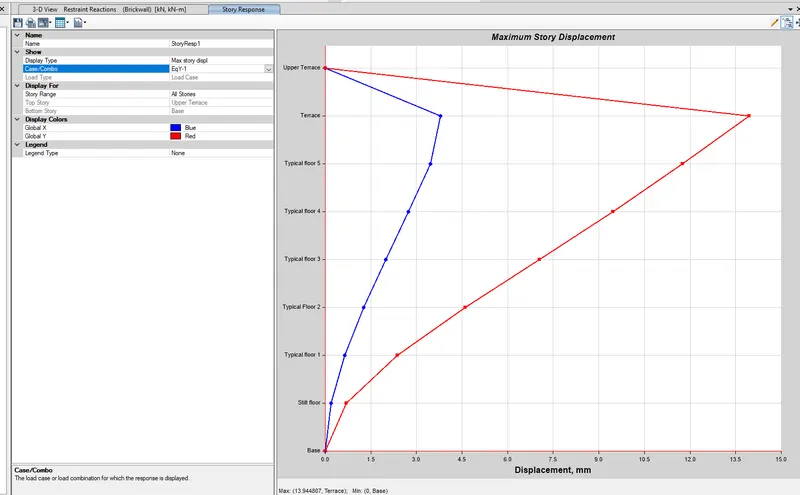
Maximum story Displacement for EQY- load 14 mm
Maximum story Displacement for Brickwall load 430 mm
STORY SHEAR:
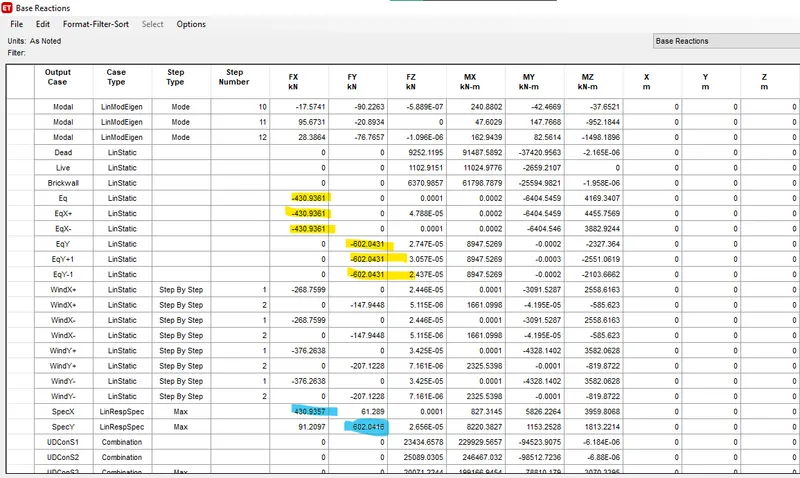
Maximum story shear for Brick wall in EQ X+ = -430 KN
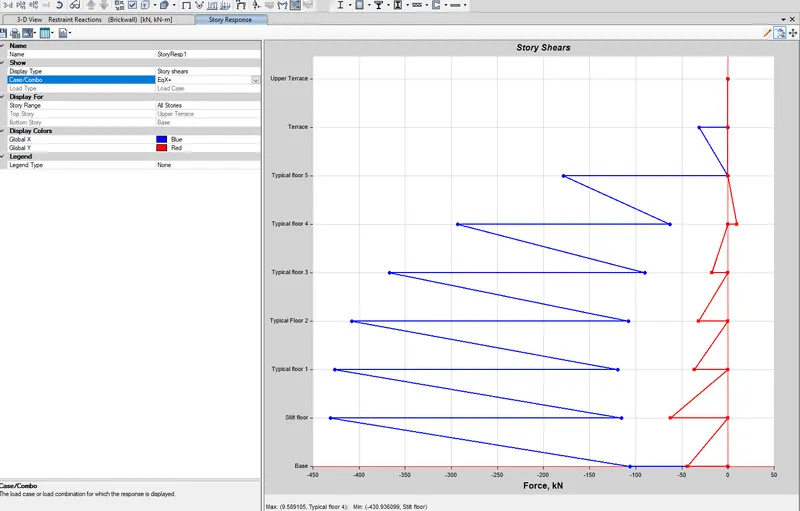
Maximum story shear for Brick wall in EQ X = -430 KN
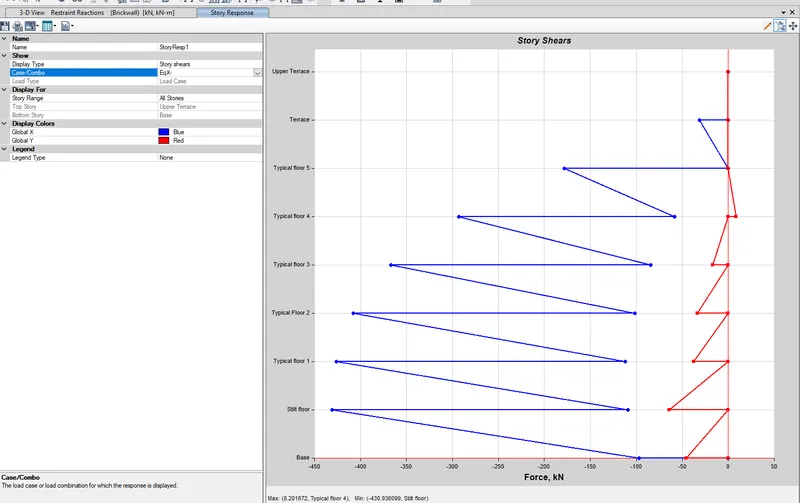
Maximum story Shear for Brick wall in EQ Y+ = -600 KN
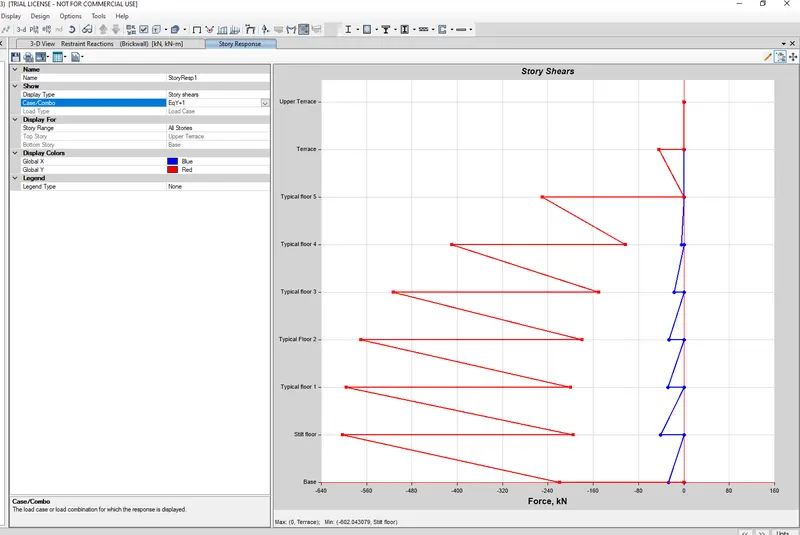
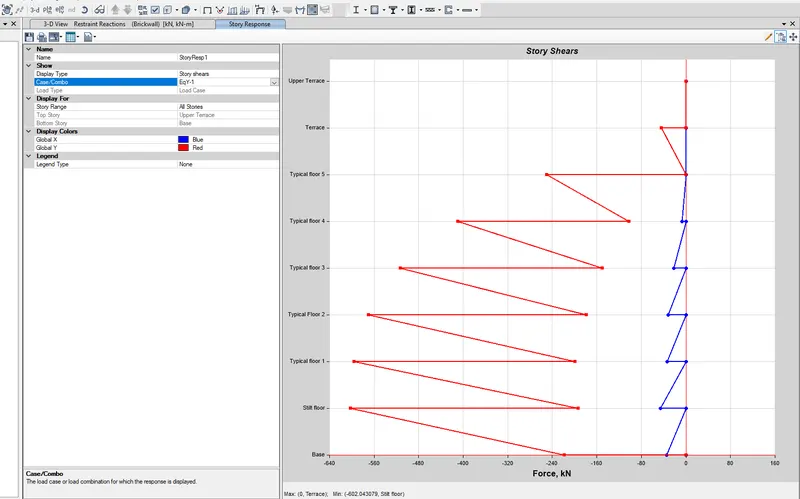
Maximum story SHear for Brick wall in EQ Y- = -600 KN
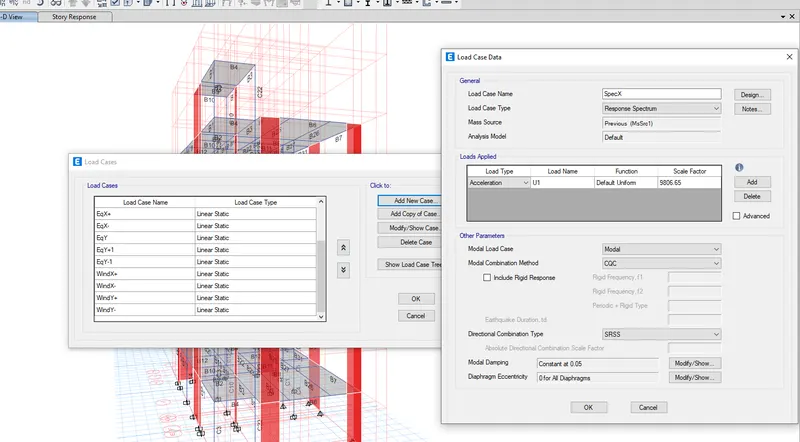
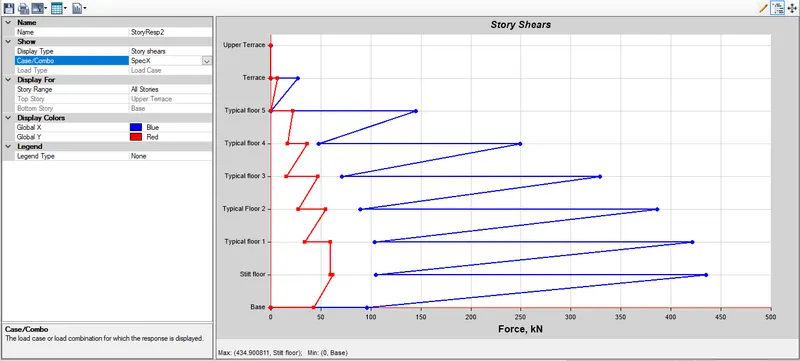
Maximum Story response SPEC-X
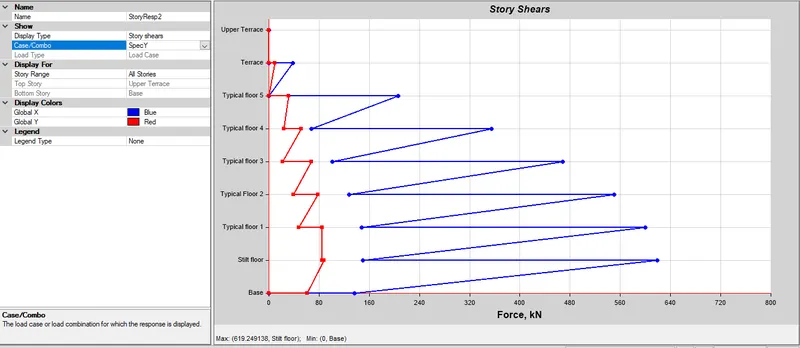
Maximum story response SPEC-Y
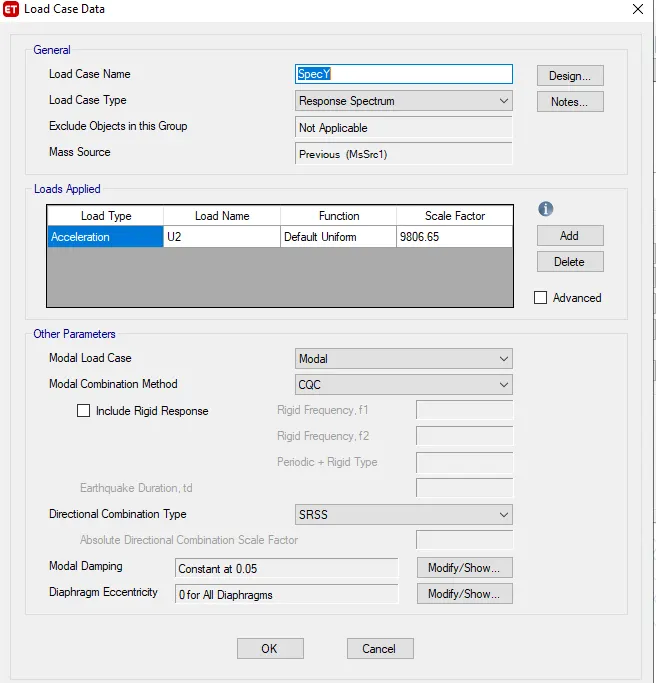
Scaling of base shear for coversation of Equivalet Lateral Force method to modal Response Spectrum Analysis Method (MRSA)
Standard scale factor in ETABS = 9806.65
The scale factor purpose is to much the values of ELF method and MRSA method.
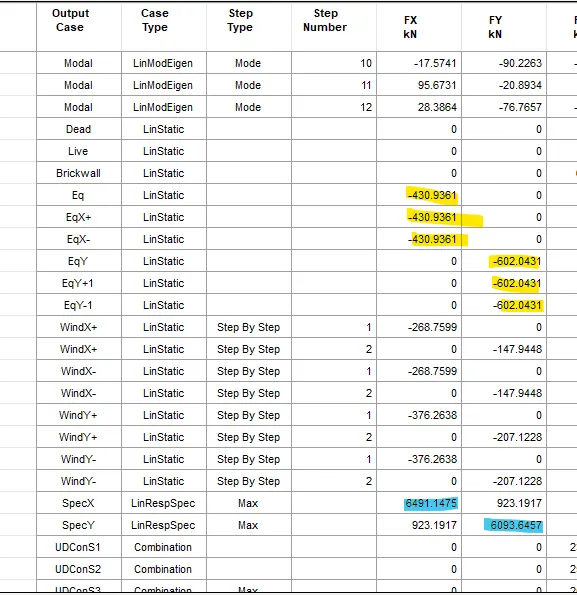
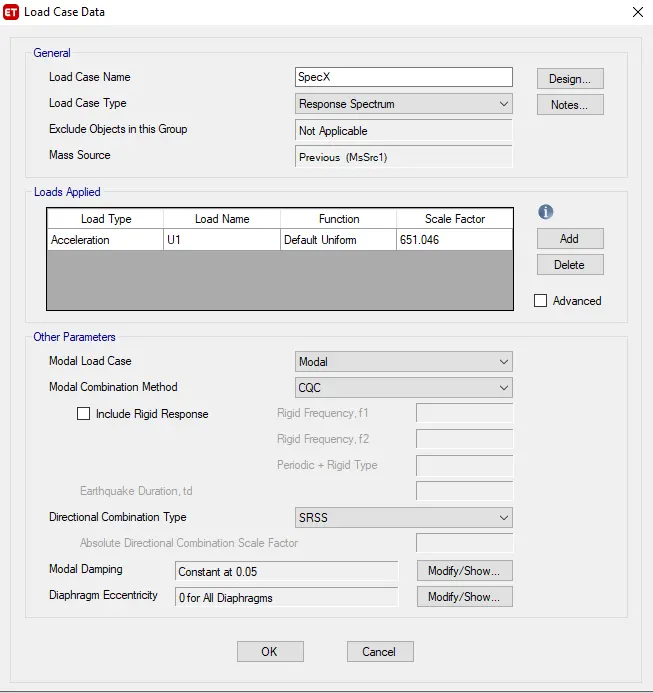
Scale Factor for SPEC X = ( 430.9361/ 6491.1475) * 9806.65 = 651.046
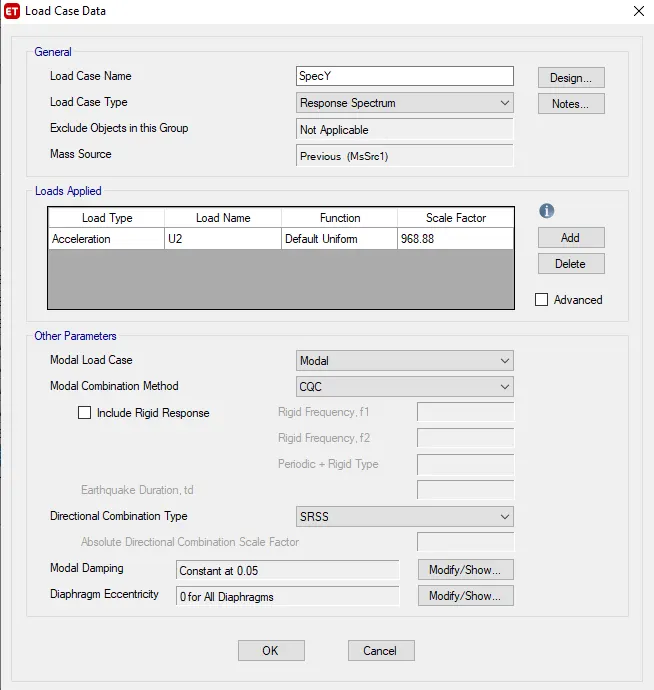
Scale Factor for SPEC Y = (602.0431/6093.6457) * 9806.65 = 968.88
Scale factor multiplier for SPEC X = 651.046
Scale factor Multipler for SPEC Y = 968.88
It is observed the Final scale of this MRSA method match with the ELF method
i.e. EQX, Eqy values of base shear which are highlighted below are matched with the SPEC X and SPECY values.
Story Shear archieved after calculation with scale factor SPEC x = 440 KN
Story Shear archived after calculation with factor SPEC Y = 620 KN
DESIGN OF ELEMENTS from values obtained in ETABS:
Concrete design and Check
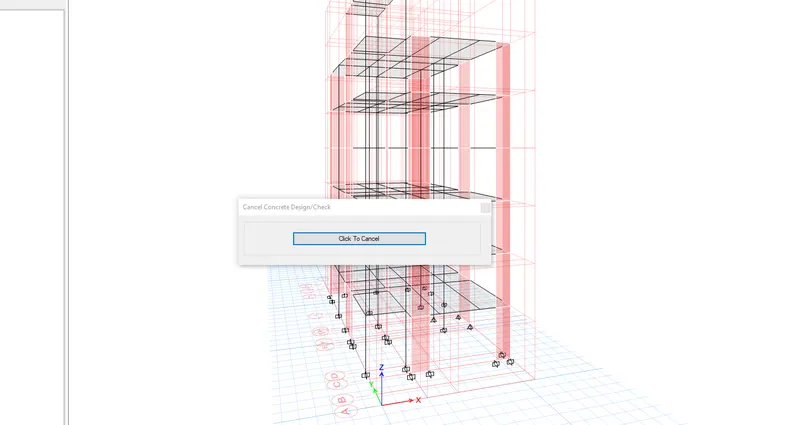
Design Values of Beam elements:
Beam B16 Size 230 * 600 mm
Reinforcement required
Longitudinal Reinforcement Ast = 366+366= 732 mm^2
Shear Reinforcement = 471 mm^2
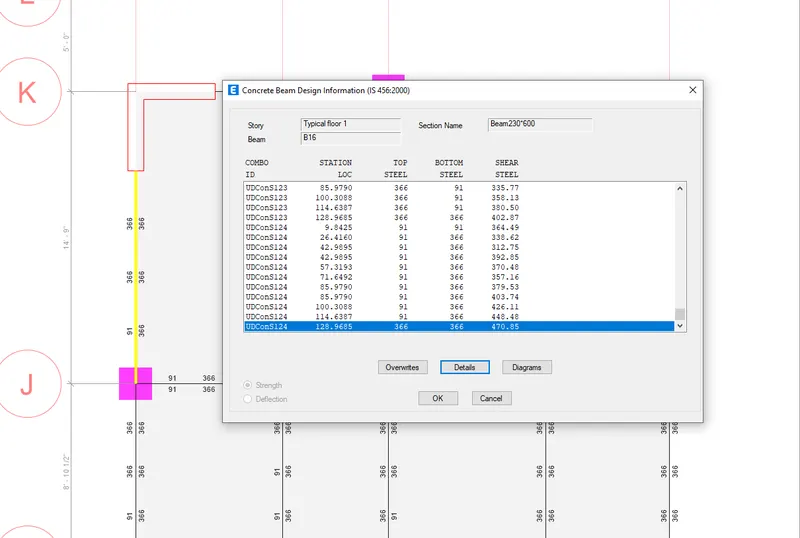
Design Values of Column elements:
Beam C11 size 500 * 500 mm
Reinforcement required
Longitudinal Reinforcement Ast = 2000 mm^2
Shear Reinforcement = 554 mm^2
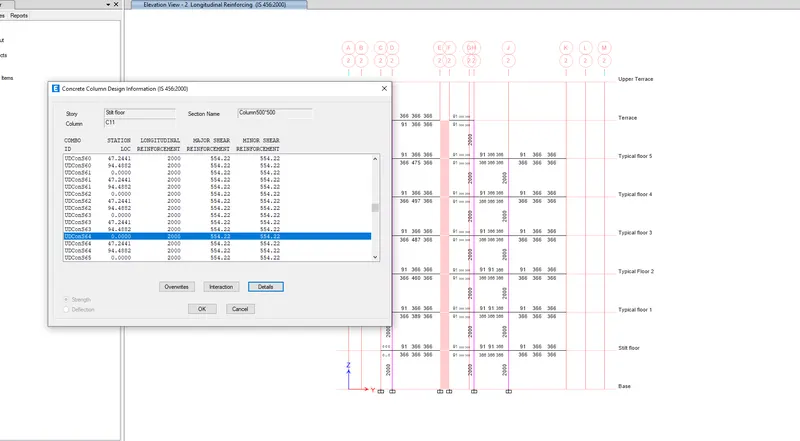
View of column reinforcement
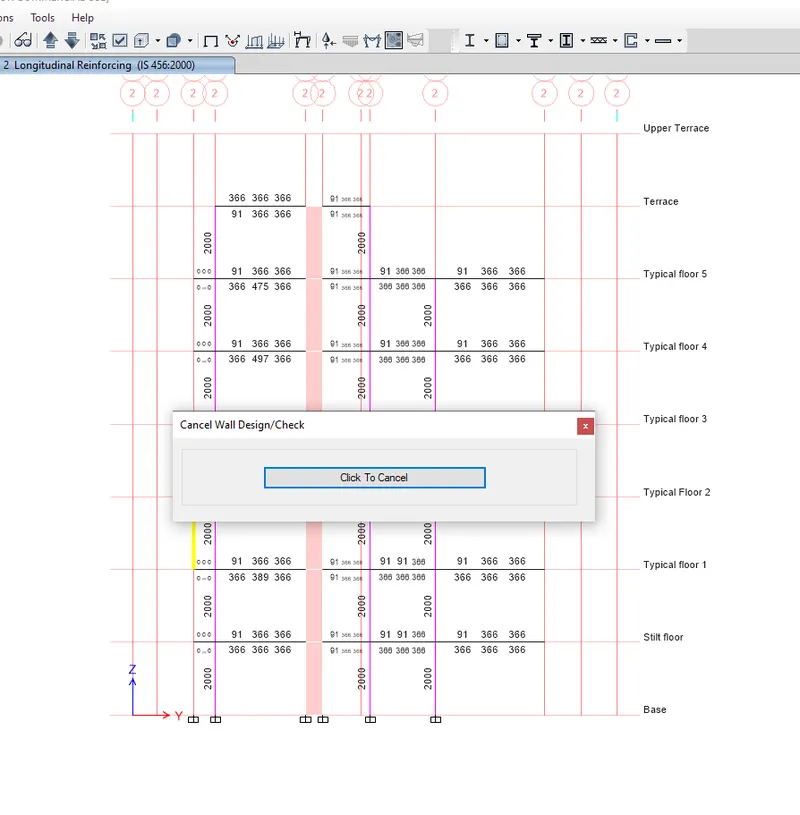
Design Values of Wall elements :
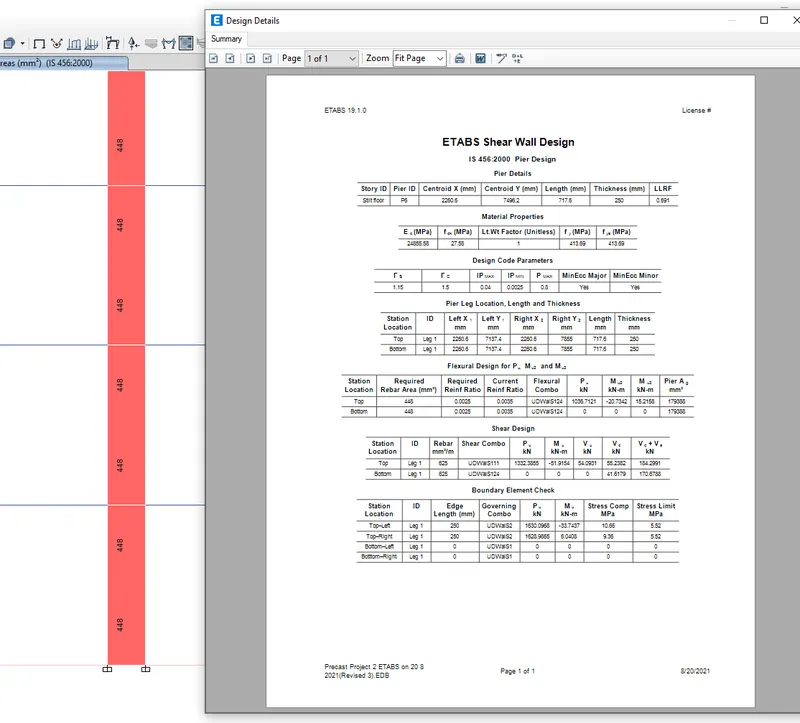
Shear Wall P6 (Pier Lable )
Length = 720 mm
Thickness = 250m
Reinforcement required details are mentioned from the ETABS Model here.