Project 2
The development of a forward energy-based fuel consumption model of a P1 hybrid vehicle.
The task of this project is to quantify the improvement in fuel economy numbers for the hybrid vehicle (kmpl), compared to the conventional vehicle, on the urban cycle (UDDS) and highway cycle (HWFET). Also, to analyze and understand the vehicle operating points in terms of engine and motor speed, torque, transmission speeds, pedal positions, gear, distance traveled, battery voltage, current, SoC etc.
All the Data's related to the forward modelling is been loaded into the workspace and also the drive cycles selections are fed in the command.
%% Skill-Lync -> Hybrid Drives Development
% Project 1 - Conventional Vehicle Model
% By - Nilesh Prajapati
% Description:
%% Initialization File
% Initialization file for loading the variables for the Conventional vehicle simulation model
%% Vehicle Parameters
M = 1500; % Vehicle weight [kg]
Cr = 0.015; % Rolling resistance coefficient
Rw = 0.35; % Rolling radius [m]
Cd = 0.33; % Drag coefficient
Af = 2; % Frontal area [m2]
rhoa = 1.225; % Air density [kg/m3]
Vwind = 0; % Wind velocity [kmph]
g = 9.81; % Gravitational acceleration [m/s2]
theta = 0; % Slope [deg]
myu_road_tire = 1; % Coefficient of friction between tire - road interface
%% Powertrain Parameters
FDR = 3.73; % Final Drive Ratio / Diff Ratio
DiffEff = 0.99; % Differential efficiency (assumed independent of operating conditions)
NumGear = 4; % Number of gears in transmission
TransGear = [1:NumGear]; % Transmission Gears
TransRatio = [3.06, 1.62, 1, 0.7]; % Corresponding Transmission ratios
TransEff = 0.90; % Transmission efficiency (assumed independent of operating conditions)
TC_SR = [0, .5, .6, .7, .8, .87, .92, .94, .96, .97, 1]; % Torque Converter Speed Ratio (Matlab default) -> TurbSpd/PumpSpd
TC_TR = [2.232, 1.5462, 1.4058, 1.2746, 1.1528, 1.0732, 1.0192, 1, 1, 1, 1]; % Torque Converter Torque Ratio (Matlab default) -> TurbTrq/PumpTrq
TC_Cf = 1e-4 * [.72558, .66322, .63463, .59042, .51331, .4144, .29287, .22444, .12186, .04386, 0]; % Torque Converter Capacity Factor (Matlab default) -> PumpTrq/PumpSpd^2 [Nm/rpm^2]
load Engine_data_1_9L_Saturn_95kW
load Trans_Shift_map
load ESS_NiMH6
load EM_Honda_Insight_10kW
ESS_init_soc = 0.8;
SOC_max = 0.9;
SOC_min = 0.6;
%% Driver Parameters
Kp = 10; % P gain for driver PI model
Ki = 1; % I gain for driver PI model
Drive_Cycle_Select = 1; % Drive cycle selection
% Drive cycle values in m/s
if Drive_Cycle_Select == 1
load UDDS;
elseif Drive_Cycle_Select == 2
load HWFET;
elseif Drive_Cycle_Select == 3
load FTP;
elseif Drive_Cycle_Select == 4
load US06;
elseif Drive_Cycle_Select == 5
load NEDC;
elseif Drive_Cycle_Select == 6
load WLTP;
end
time_end = cyc_time(end);
vel_end = cyc_vel(end);
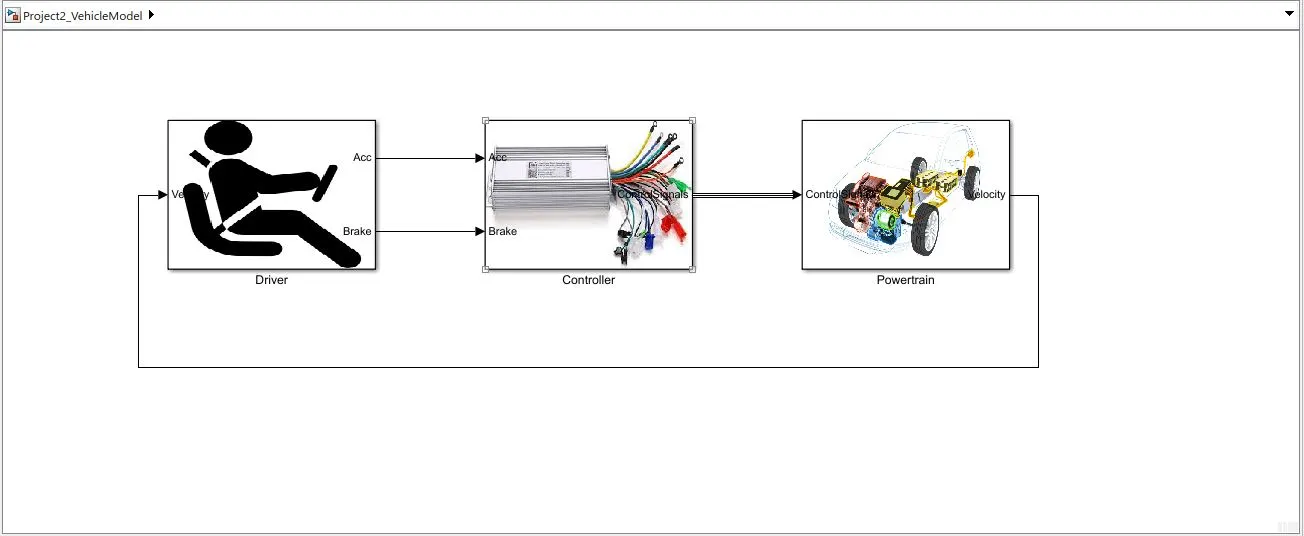
The simulink model for forward approach consists of major three blocks :
1) Driver 2) controller 3) powertrain
In Driver block the velocity of the vehicle is taken as input and in output accelerator and brakes are there.
whereas in controller acc and brakes are input and control signal is output.
In powertrain the control signals are input and the velocity is output which is again then fed to the driver as input in this way a cycle repeatedly works.
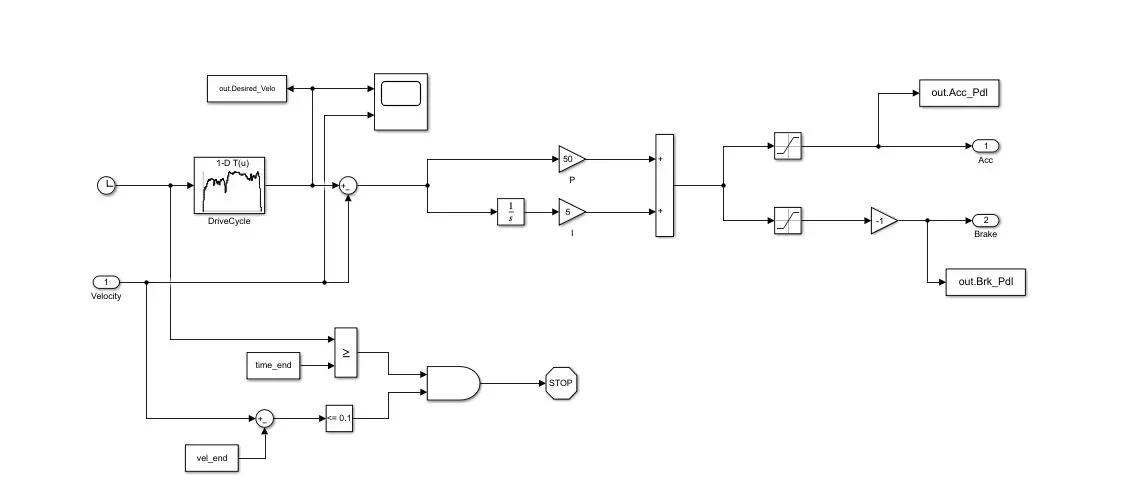
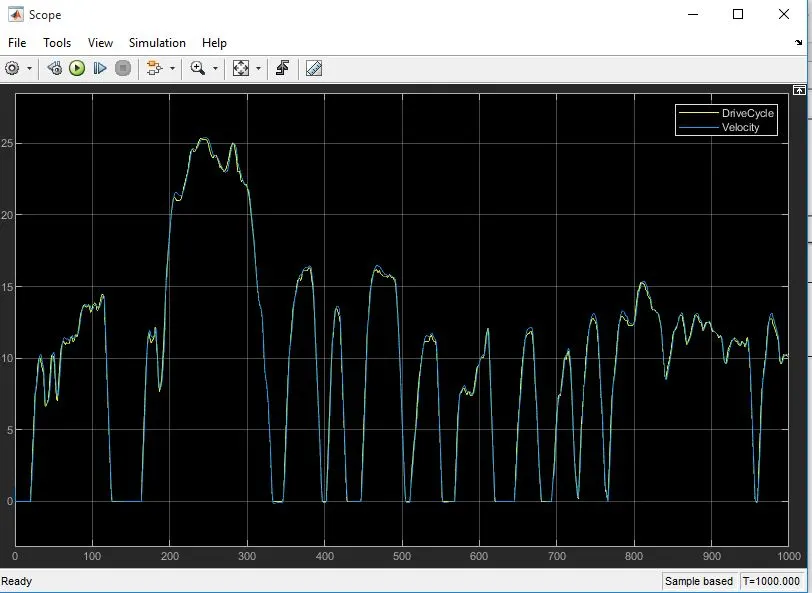
In Driver block a Drive Cycle look table is there from which drive cycle data are inserted in the simulink and also there are PI controller with time cycles.
In Controller block a Supervisory control Chart is been made in which acc, brake , Velocity, engine speed, soc are in input form and Eng throttle, Electric Motor throttle , Engine on are in output forms.
Controller block consists of Engine Control Unit, Transmission Control unit, Electric motor contrrol unit, Brake control unit.
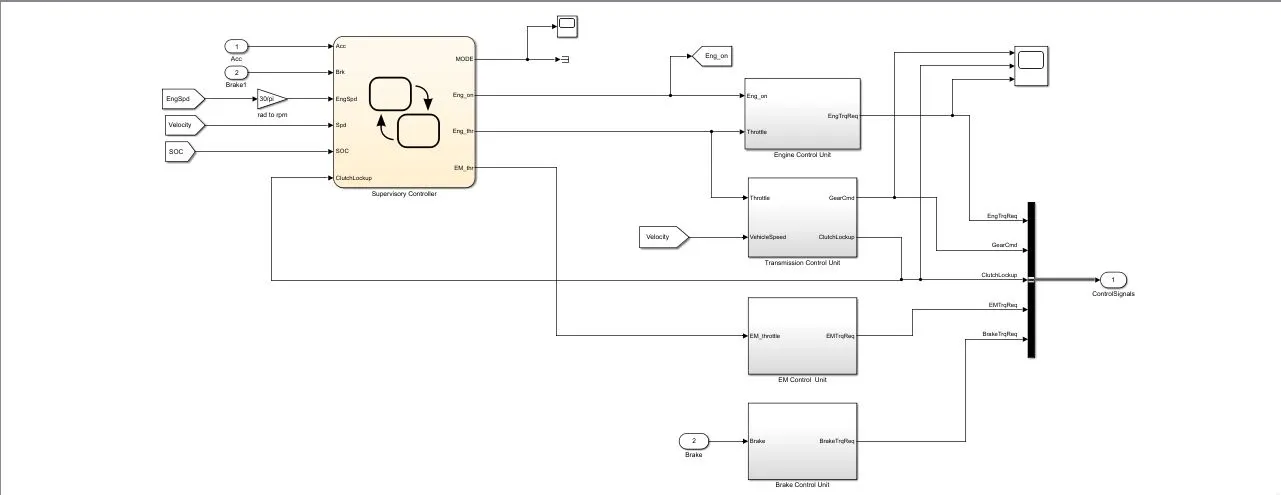
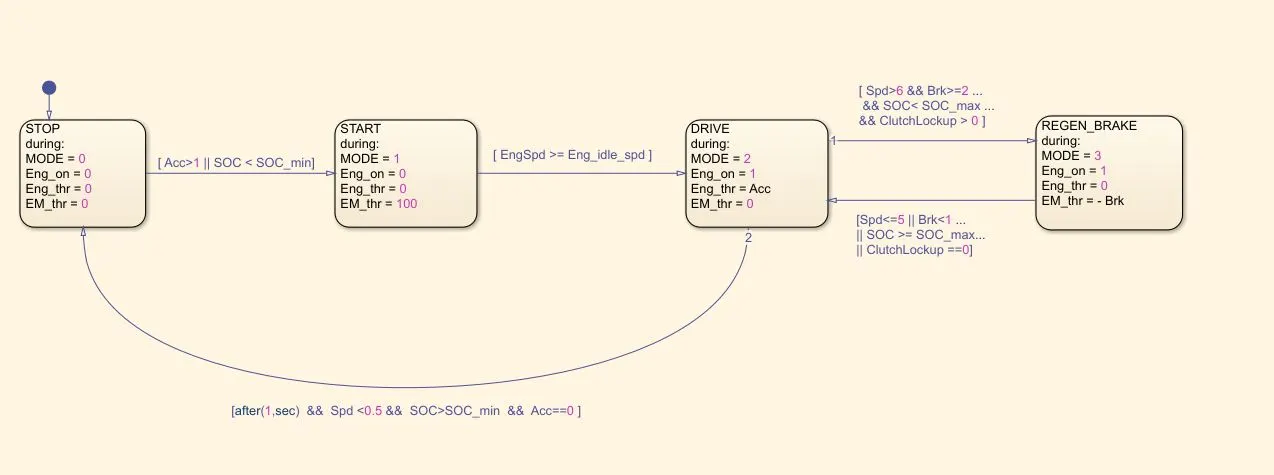
The supervisory control unit, which selects the operation modes (start/stop, cruise, or
regeneration braking mode. The engine drive and the motor drive are adjusted for
each mode.
Engine Control Unit:
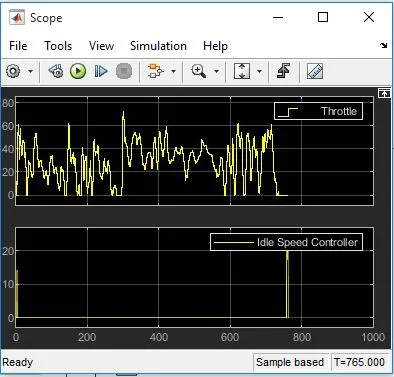
In Engine control unit a max and min torque look up table is there to control the torque with a saturation limit.
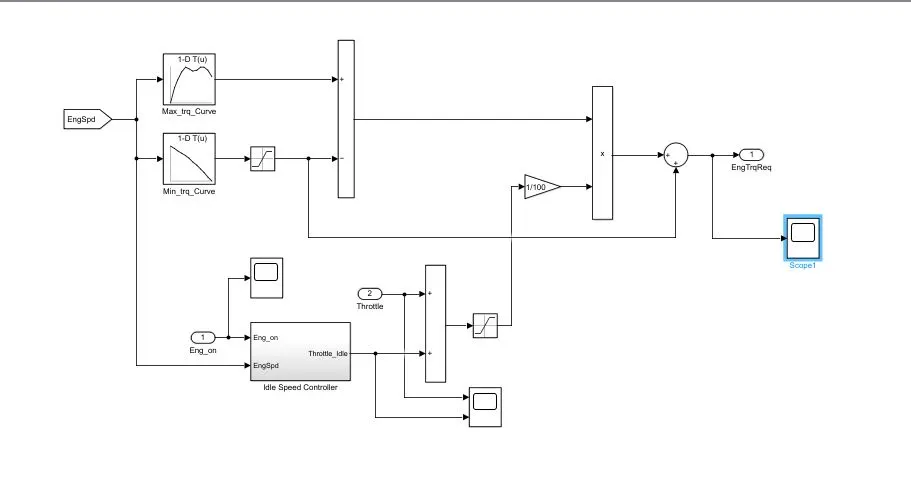
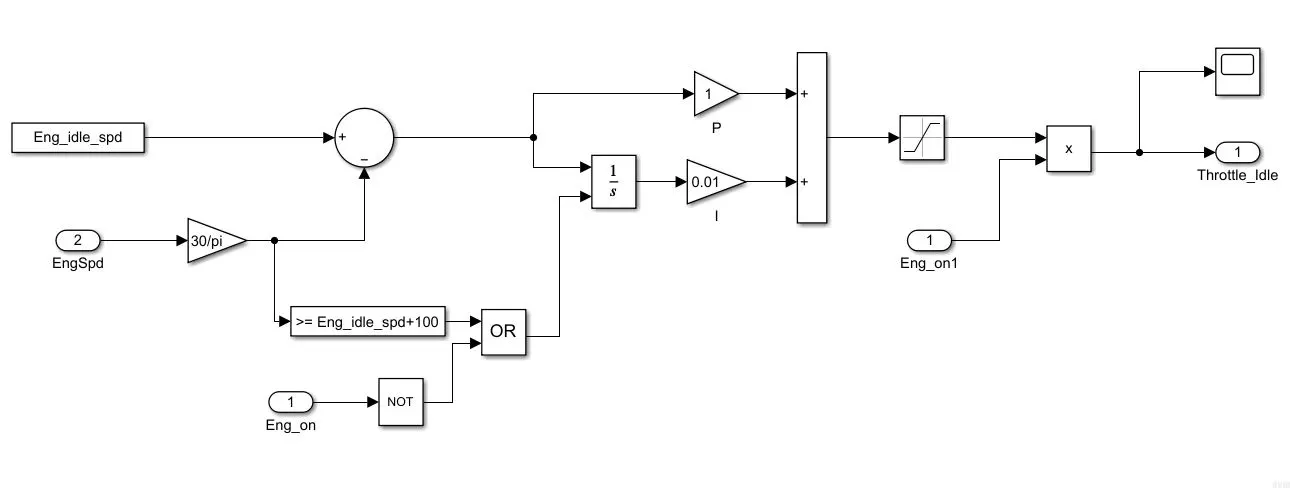
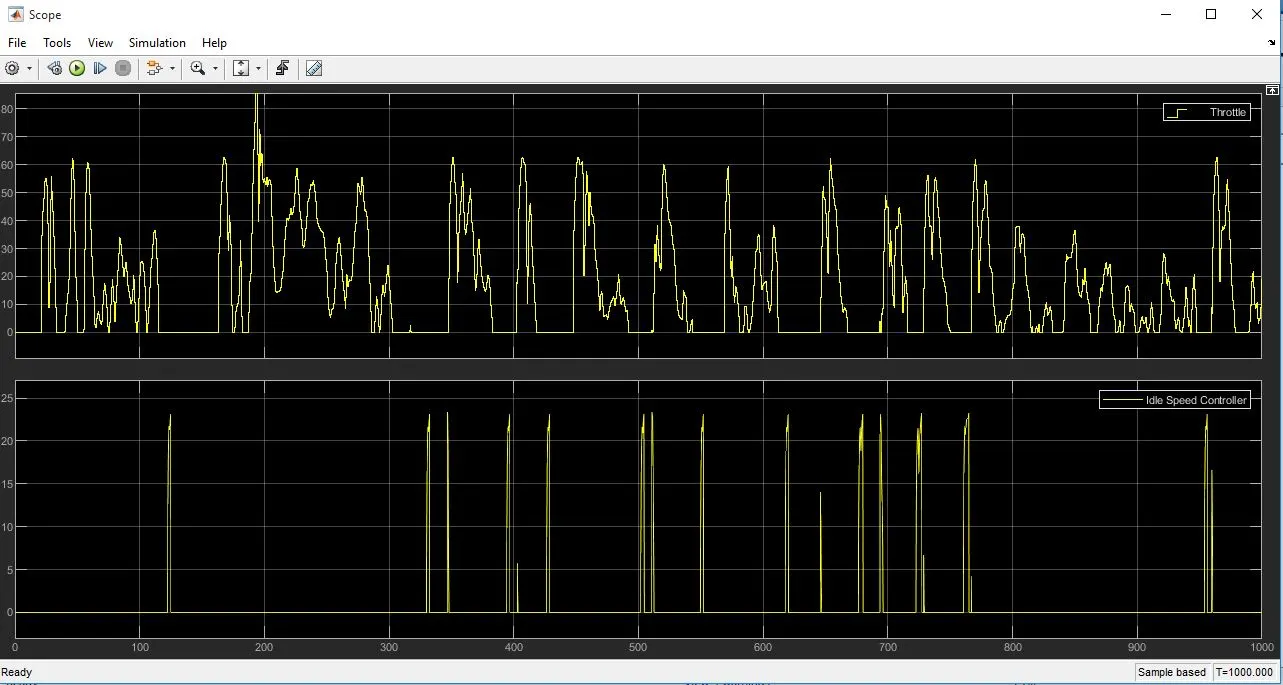
Idle Speed Controller block is there to control the engine speed and engine throttle as per the driving cycles and requirements.
Transmission Control Block:
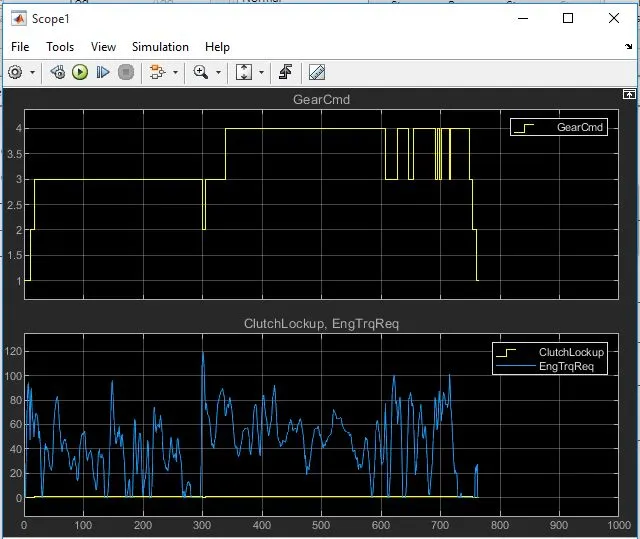
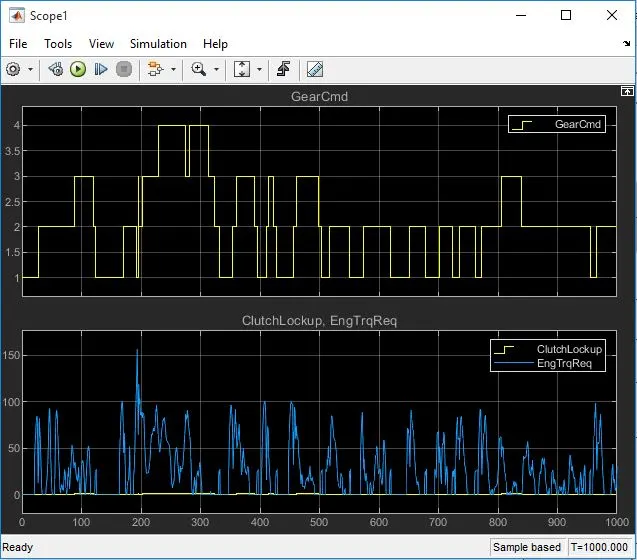
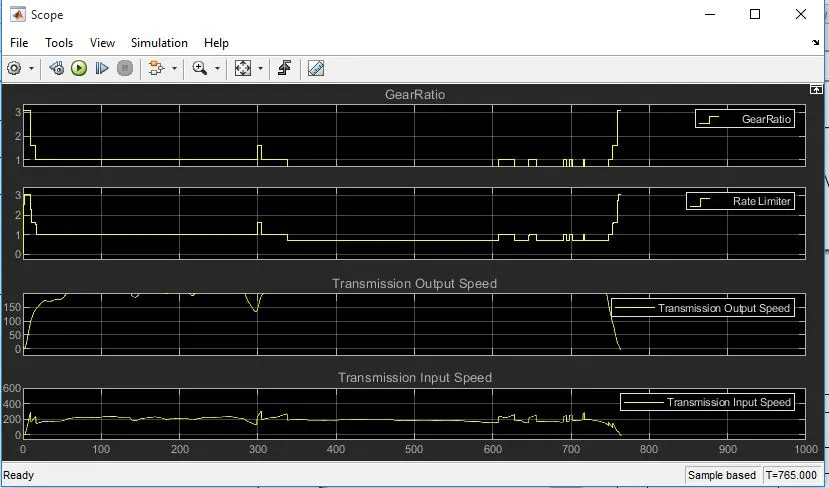
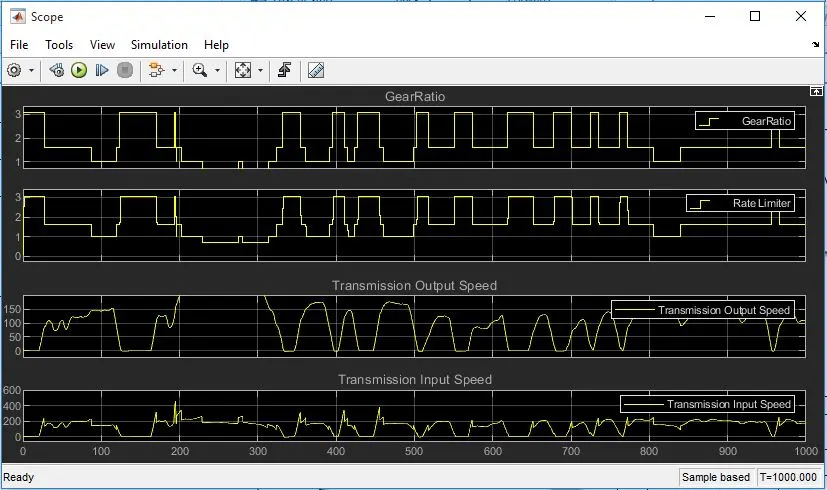
Throttle and vehicle speed are fed into the chart for the gear selection using gear command.
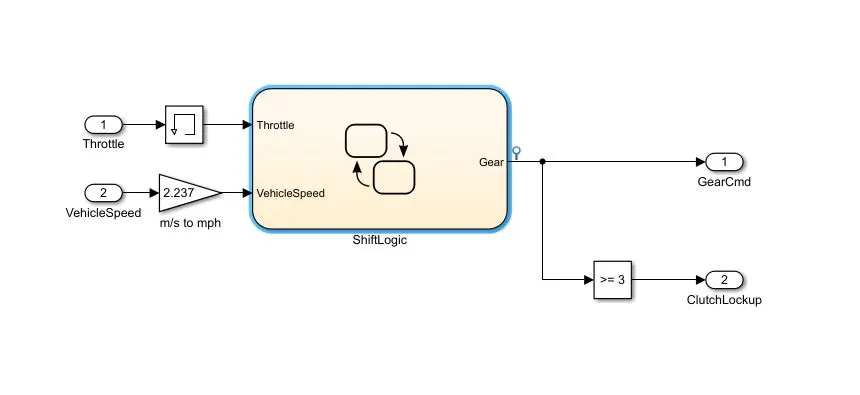
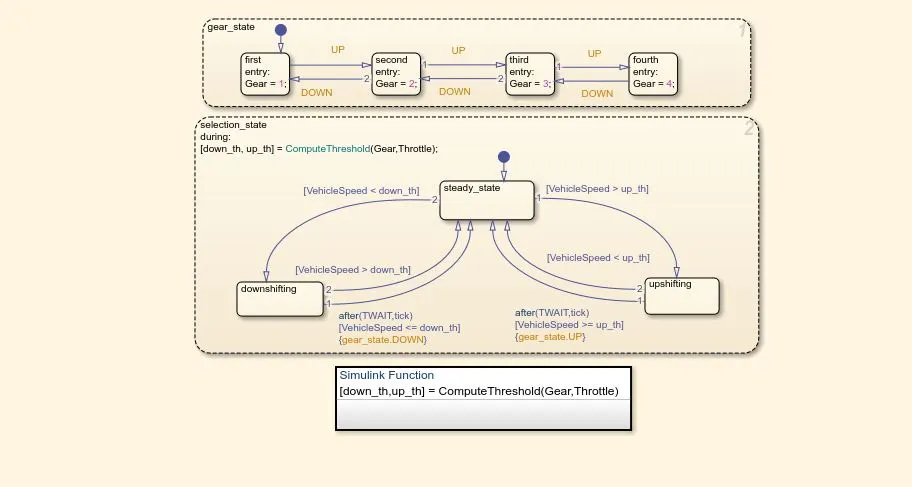
The study flow variable chart is used by the transmission control block to regulate gear
shifting.
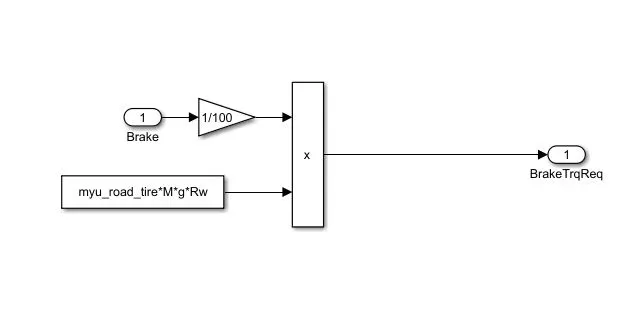
Brake Control unit
Brake controller controls the necessary brake torque in accordance with the input from
the Driver using brake pedal, then transmit that torque to the wheel block in the transmission model.
POWERTRAIN MODEL
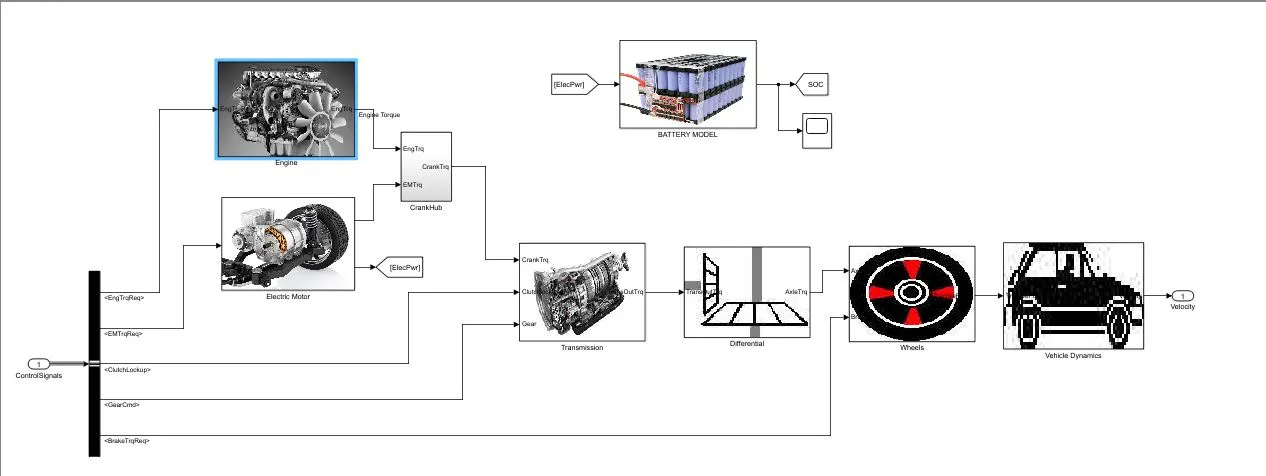
This Block consists of an engine and electric motor for power and torque as its a hybrid model. The battery model provides energy to the motor which is regenerative braking energy.
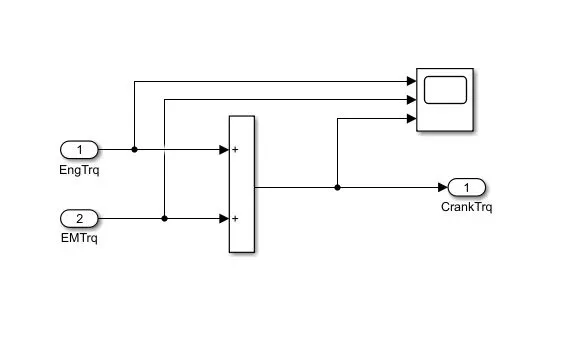
A Crankhub block is fed so that the power of both engine and motor transferred to the transmission via crankshaft and from transmission its been delivered to the differential then to the wheels .
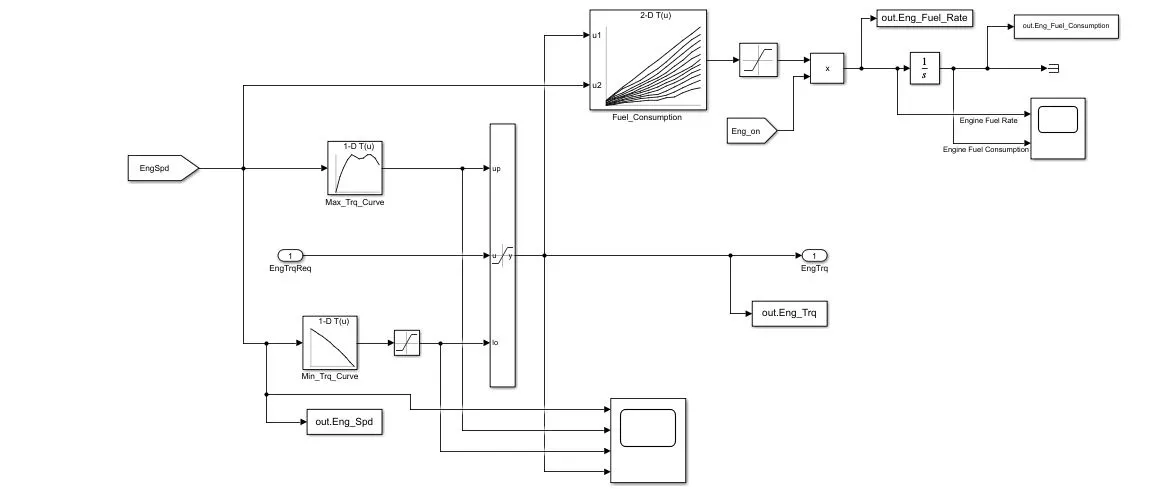
Engine
Engine max and min torque is saturated as per the engine speed
Based on engine speed and torque, the fuel flow rate is calculated using a 2D lookup
table. The fuel consumption is then calculated using an integration of the fuel flow
rate.
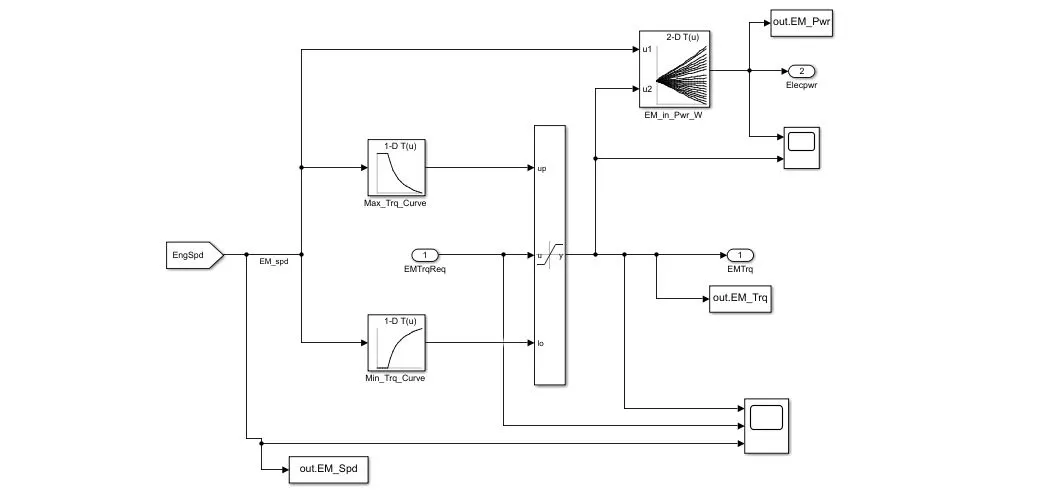
Electric Motor
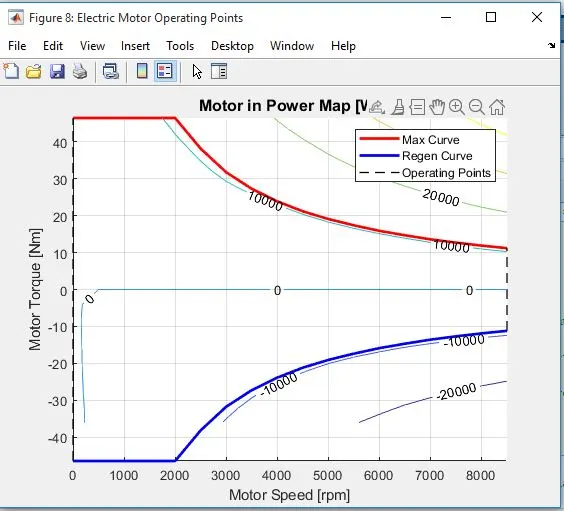
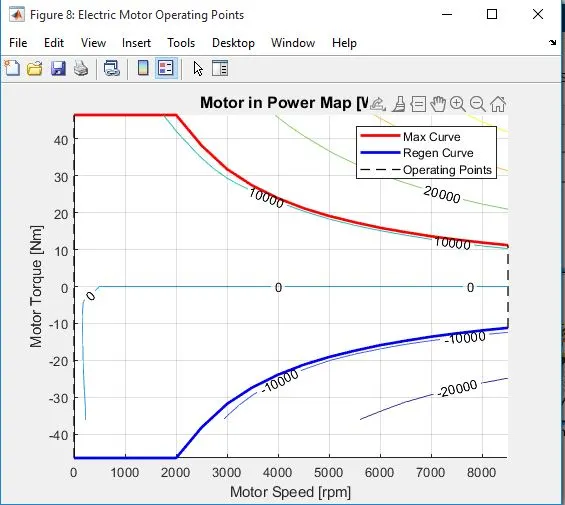
Based on the Engine speed The required EM torque from the controller is saturated between Max EM torque curve and max EM torque Generation curve and passes the EM torque to the Crank Hub.
 CrankHub
The transmission block receives the crank torque from the crank hub after adding the EM
torque and engine torque.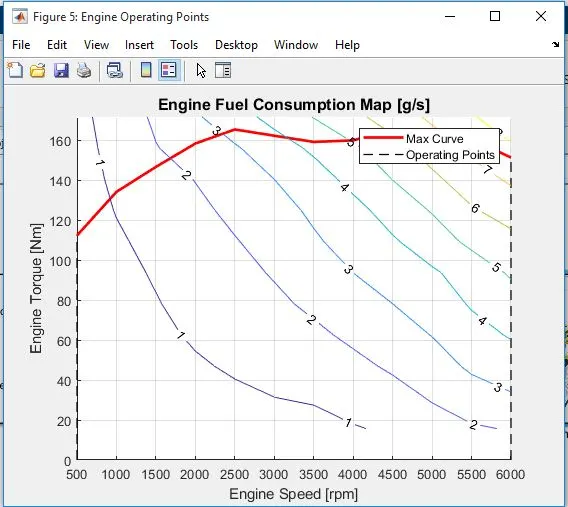
Transmission Model
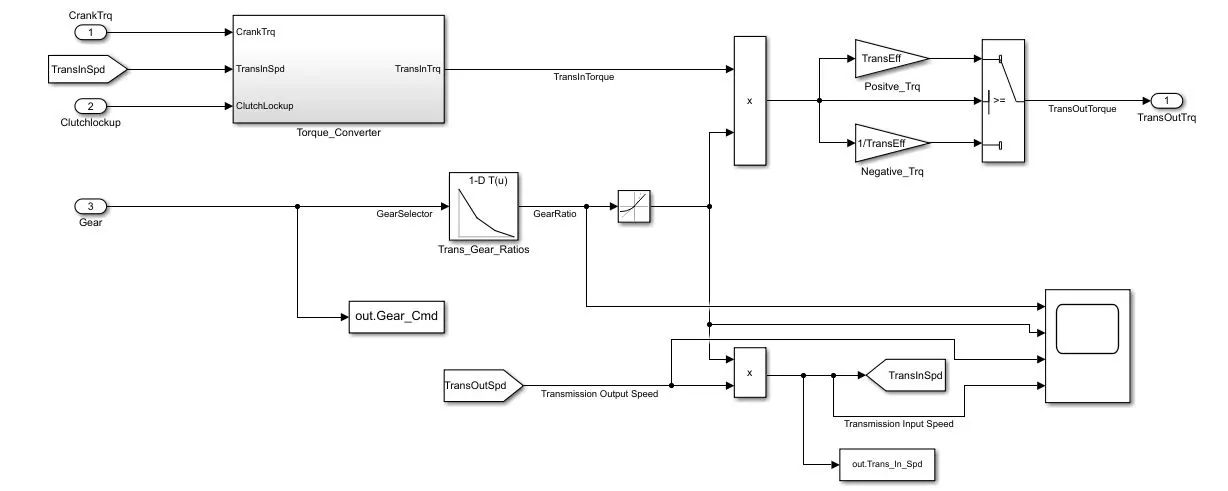 The Crank is connected to the automatic transmission via a torque converter. The output of the transmission is connected to the differential. New Clutch Lockup feature is adding to this Hybrid version.
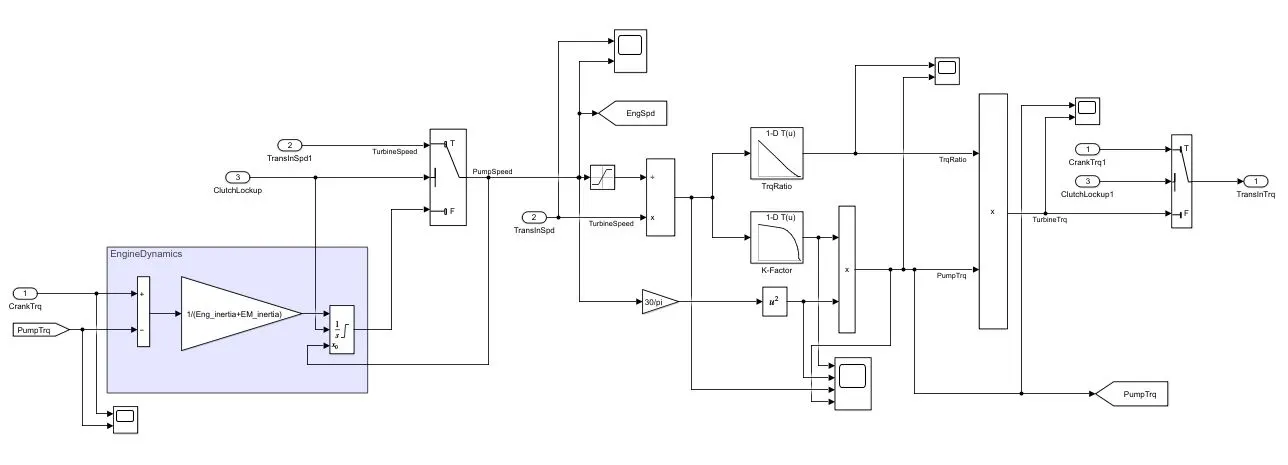
Torque Converter
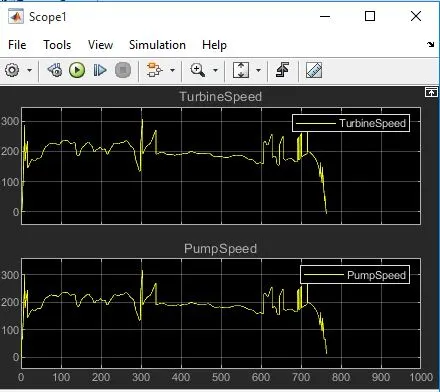
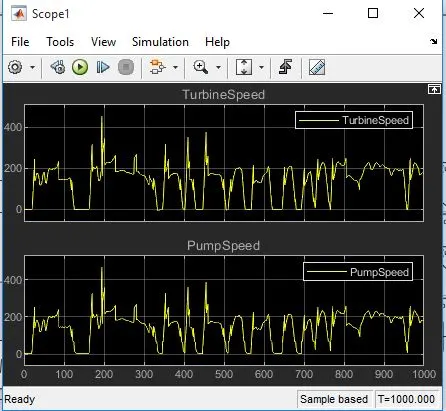
Torque converter works according to the turbine speed and pump speed by the clutch lockup and gives us the required transmission torque.
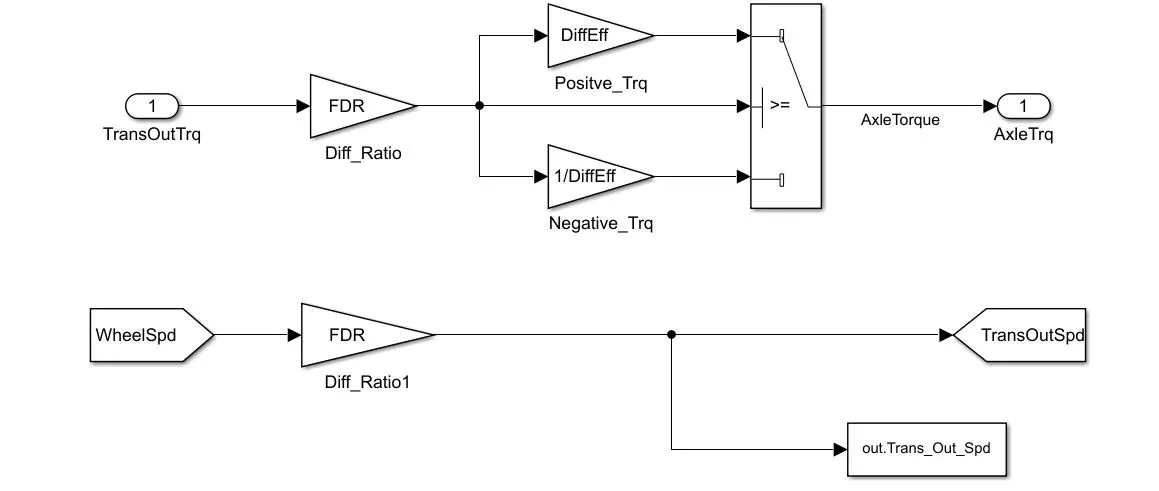
Differential Model
In this block, the differential ratio and differential efficiency are multiplied with the
transmission output torque to produce the axle torque, which is then sent to the wheel.
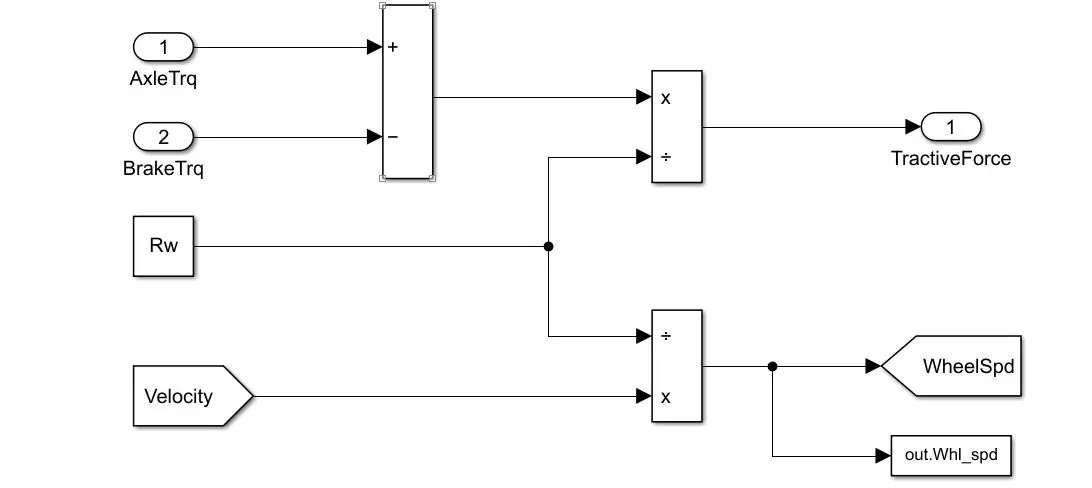
Wheels
Vehicle Dynamics
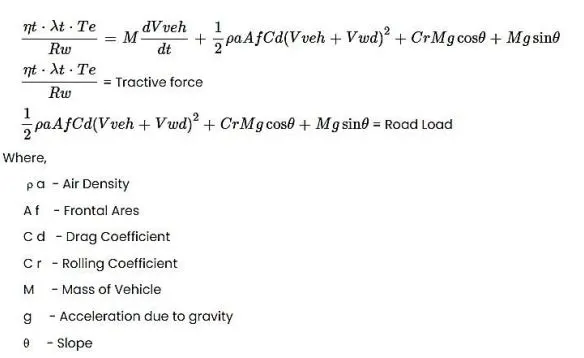
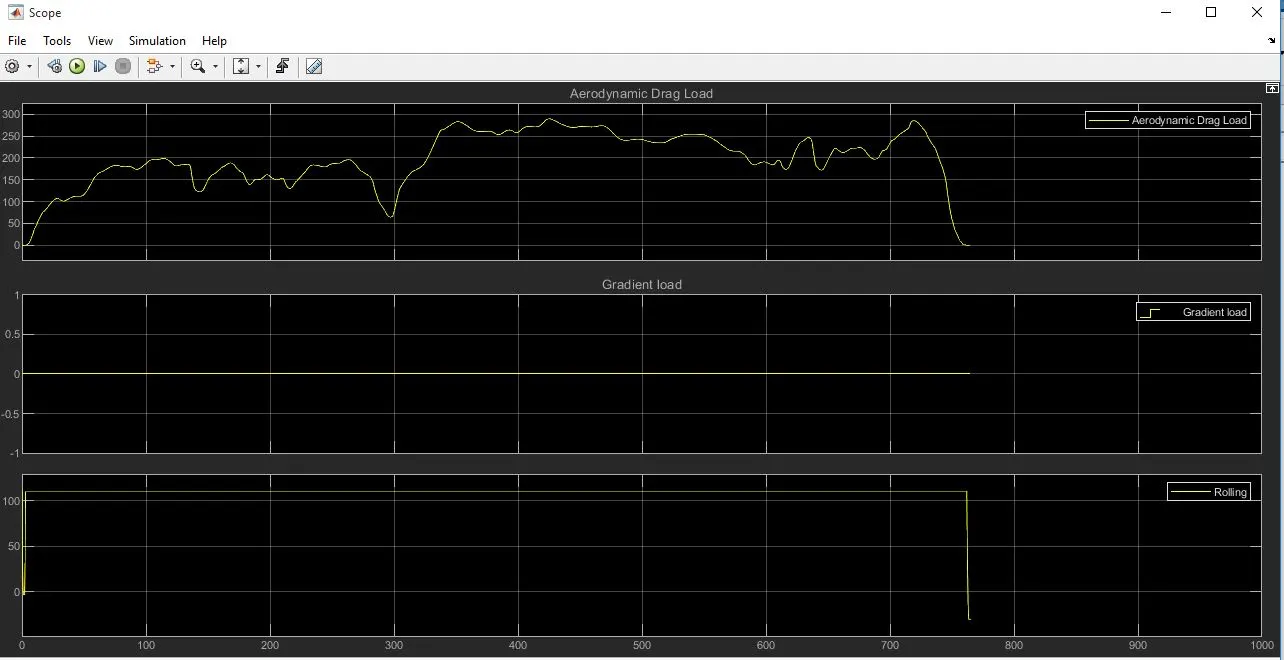
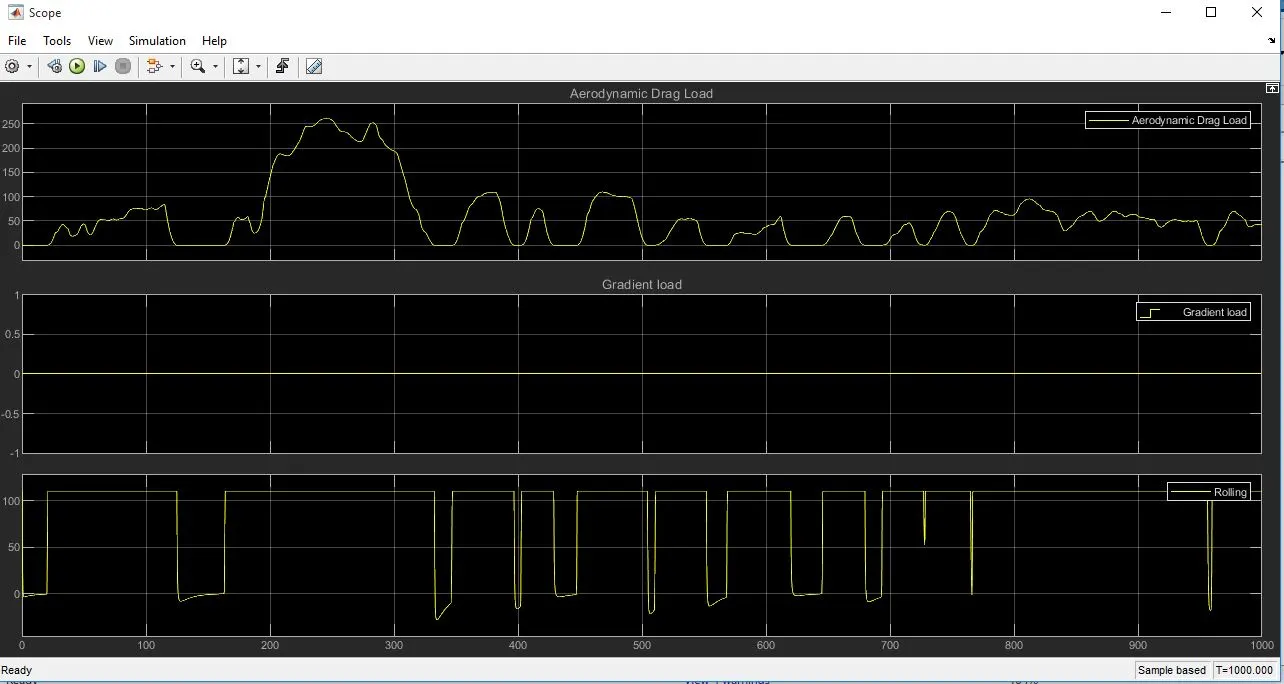
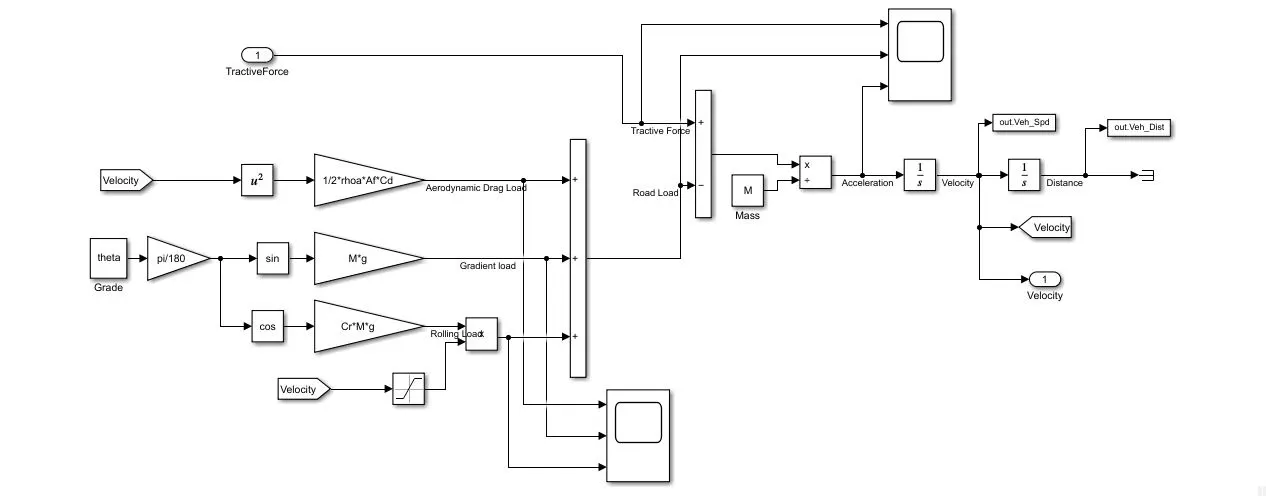 The vehicle dynamics blocks shows the Aerodynamic load + Gradient load + Rolling Load.
vehicle speed can be calculated using dynamic loads as well as Tractive force.
Battery Model
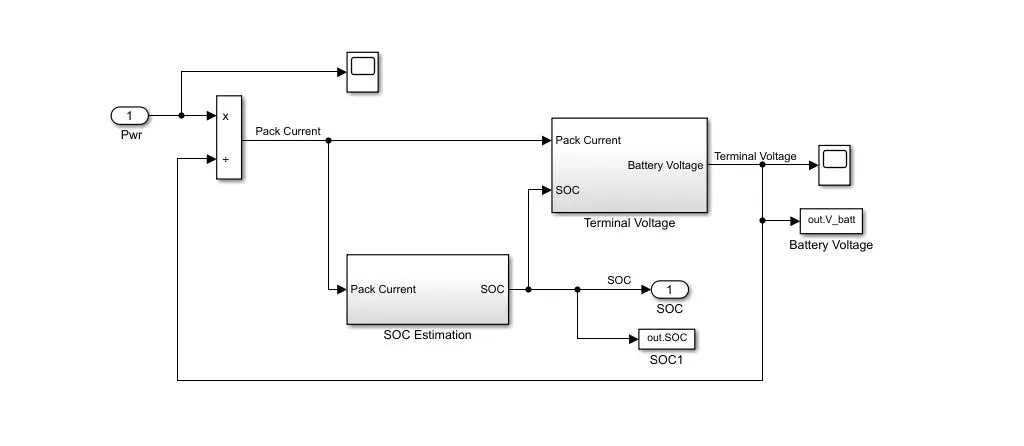
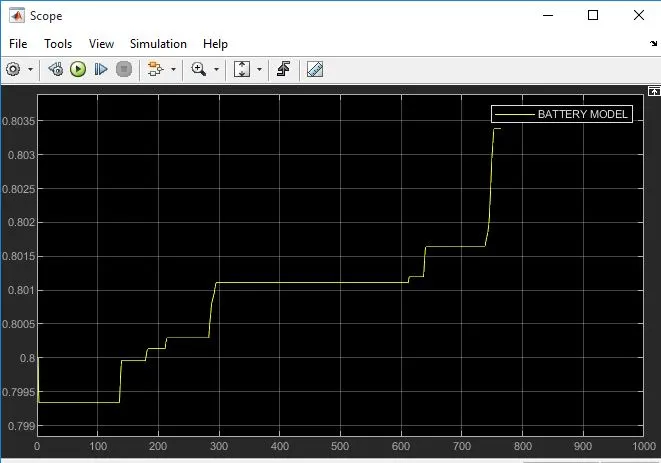
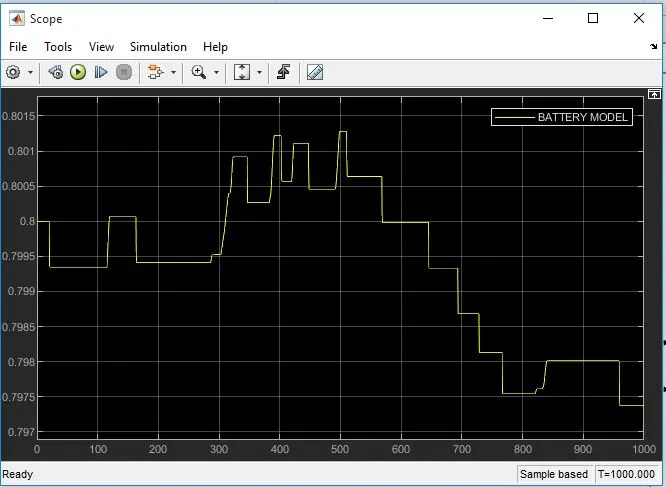
In battery model Power is taken as input and SOC as output by creating two subsystem blocks such as SOC estimation and Terminal voltage.
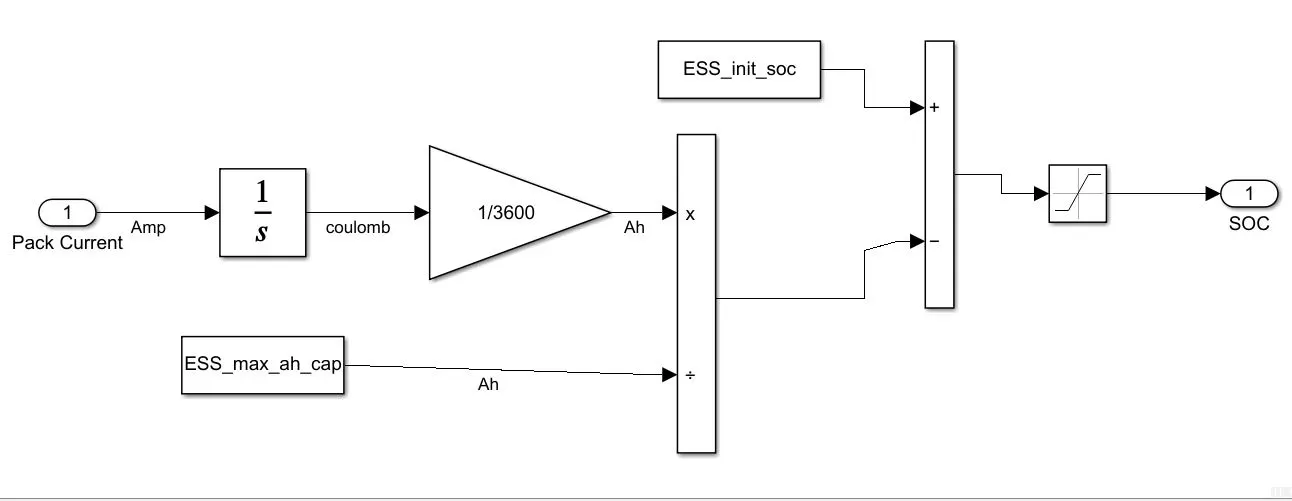
In SOC estimation block the max ampere hour and initial state of charge are saturated for the SOC.
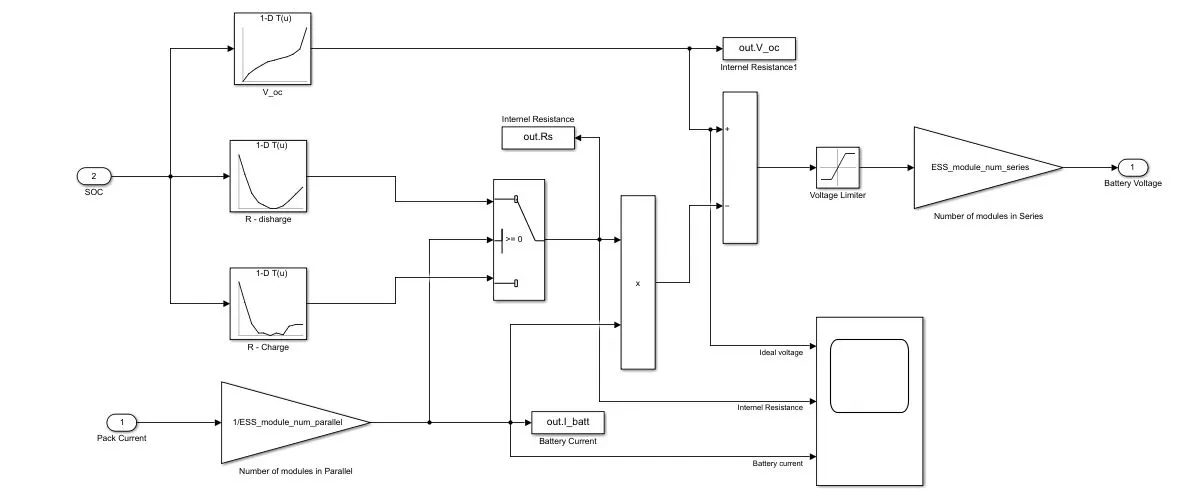
1D lookup tables are used to establish ideal voltage and internal resistance, and the
model is used to determine battery voltage.
To analyze data and create charts, a MATLAB script is written. Here, we rename the
model-loaded variables, perform some elementary post-processing computations, and
provide results and visualizations.
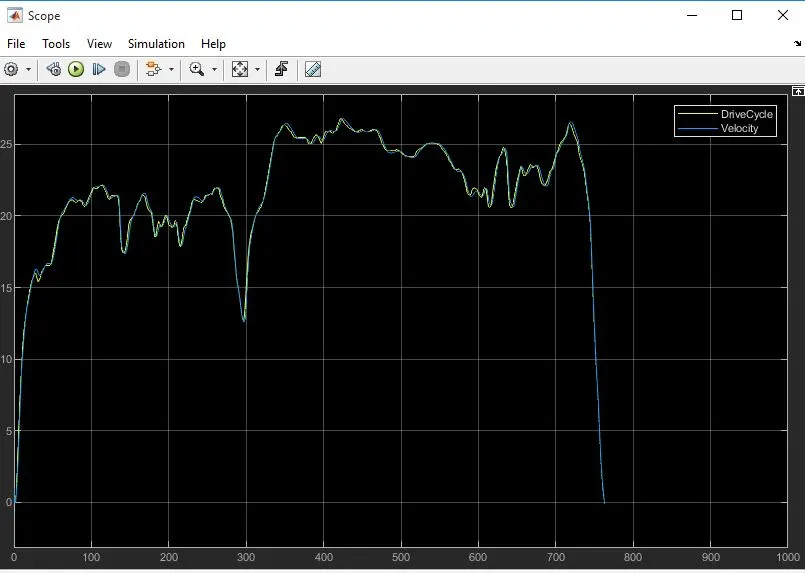
SCOPE RESULTS for HWFET and UDDS
Drive Cycle
Controller scope
Gear command , Clutch Lockup , Engine Torque required
Engine control unit
Engine Throttle and Idle speed controller
Transmission Control unit
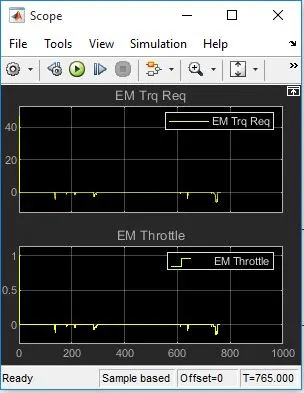
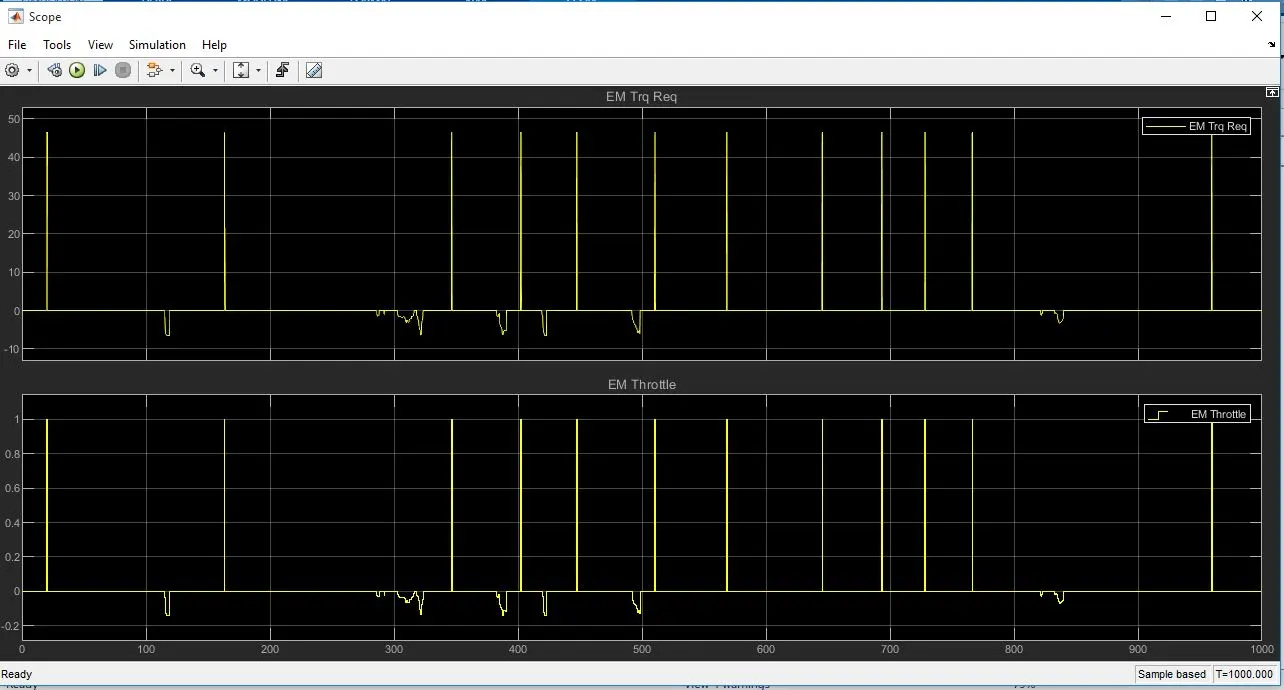
Electric motor
Electric motor torque required as well as electric motor throttle generation.
Engine model
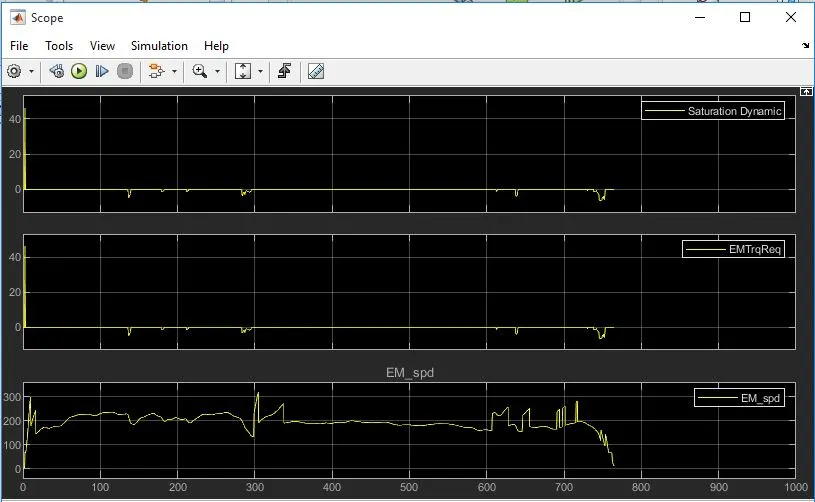
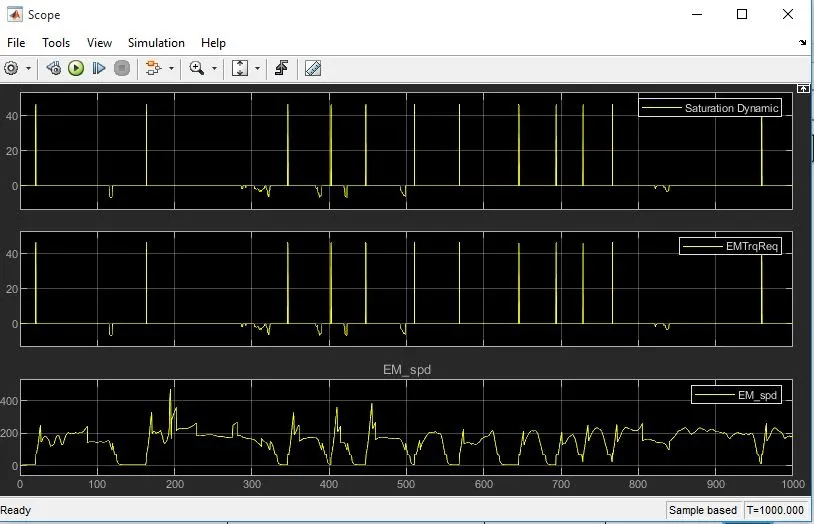
Electric Motor
Torque Converter
Turbine and Pump speed
Battery modelling
Vehicle Dynamics
Dynamic loads
%% Post-Processing File
% File for post-processing the P1 Hybrid vehicle simulation model data
%% Renaming variables
Time = out.tout;
Acc_Pdl = out.Acc_Pdl; % Accelerator pedal [%]
Brk_Pdl = out.Brk_Pdl; % Brake pedal [%]
Gear_Cmd = out.Gear_Cmd; % Transmission gear
Trans_In_Spd = out.Trans_In_Spd*30/pi; % Transmission input speed [rpm]
Trans_Out_Spd = out.Trans_Out_Spd*30/pi;% Transmission output speed [rpm]
Eng_Trq = out.Eng_Trq; % Engine brake torque [Nm]
Eng_Spd = out.Eng_Spd*30/pi; % Engine speed [rpm]
Eng_Fuel_rate = out.Eng_Fuel_Rate; % Engine Fuel Rate [g\kW]
Eng_Fuel_Consump = out.Eng_Fuel_Consumption; % Engine fuel consumption [g]
Veh_Dist = out.Veh_Dist/1000; % Distance traveled by vehicle [km]
Veh_Spd = out.Veh_Spd*18/5; % Vehicle speed [kmph]
Whl_Spd = out.Whl_spd*30/pi; % Wheel speed [rpm]
Desired_spd = out.Desired_Velo*18/5; % Desired Speed [Kmph]
EM_Spd = out.EM_Spd*30/pi; % E Motor Speed [rpm]
EM_Trq = out.EM_Trq; % E Motor Torque [Nm]
EM_Pwr = out.EM_Pwr; % Motor Input Power [W]
V_batt = out.V_batt; % Battery Pack Voltage [v]
I_batt = out.I_batt; % Battery Pack Current [A]
SOC = out.SOC; % SOC [%]
%% Data Analysis
Eng_Pwr = Eng_Spd*pi/30.*Eng_Trq/1000; % Engine brake power [kW]
rho_petrol = 0.7197; % Density of petrol [kg/L]
kmpl = Veh_Dist(end)/(Eng_Fuel_Consump(end)/1000/rho_petrol); % Fuel economy [kmpl]
% Display Fuel Economy of the Cycle
fprintf('\nFuel Economy = %2.2fKmpl\n\n',kmpl);
%% Plotting vehicle characteristics time trace
% Plotting transmission input, transmission output and wheel speed
figure(1)
hold on
grid on
plot(Time, Trans_In_Spd, 'linewidth', 1, 'Color', 'black');
plot(Time, Trans_Out_Spd, 'linewidth', 1, 'Color', 'red');
plot(Time, Whl_Spd, 'linewidth', 1, 'Color', 'blue');
xlabel('Time [s]')
ylabel('Speed [rpm]')
xlim([0, Time(end)]);
legend('Trans Input','Trans Output','Wheel Speed');
title('Transmission Input \ Output and Wheel Speeds')
%% Plotting engine torque, engine power, fuel rate and fuel consumption
figure(2)
subplot(4,1,1)
hold on
grid on
plot(Time, Eng_Trq, 'linewidth', 1, 'Color', 'black');
ylabel('Torque [Nm]')
xlim([0, Time(end)]);
title('Engine Torque')
subplot(4,1,2)
hold on
grid on
plot(Time, Eng_Pwr, 'linewidth', 1, 'Color', 'black');
ylabel('Power [KW]')
xlim([0, Time(end)]);
title('Engine Power')
subplot(4,1,3)
hold on
grid on
plot(Time, Eng_Fuel_rate, 'linewidth', 1, 'Color', 'black');
xlim([0, Time(end)]);
xlabel('Time [s]');
ylabel('Fuel rate');
title('Engine Fuel Rate')
subplot(4,1,4)
hold on
grid on
plot(Time, Eng_Fuel_Consump, 'linewidth', 1, 'Color', 'black');
xlim([0, Time(end)]);
xlabel('Time [s]');
ylabel('Fuel Consumption [g]');
title('Fuel Consumption')
%% Plotting accelerator and brake pedal gear command, vehicle desired and actual speed, vehicle distance
figure(3)
subplot(4,1,1)
hold on
grid on
plot(Time, Acc_Pdl, 'linewidth', 1, 'Color', 'black');
plot(Time, Brk_Pdl, 'linewidth', 1, 'Color', 'red');
ylabel('Pedal [%]')
xlim([0, Time(end)]);
legend('Accel','Brake');
title('Acceleration and Brake pedal Inputs')
subplot(4,1,2)
hold on
grid on
plot(Time, Gear_Cmd, 'linewidth', 1, 'Color', 'black');
xlim([0, Time(end)]);
xlabel('Time [s]');
ylabel('Gear');
title('Gear Command')
subplot(4,1,3)
hold on
grid on
plot(Time, Veh_Spd, 'linewidth', 1, 'Color', 'red');
plot(Time, Desired_spd, 'linewidth', 1, 'Color', 'black');
ylabel('Speed [Kmph]')
xlim([0, Time(end)]);
legend('Actual speed','Desired speed');
title('Vehicle Actual and Desired Speeds')
subplot(4,1,4)
hold on
grid on
plot(Time, Veh_Dist, 'linewidth', 1, 'Color', 'black');
xlim([0, Time(end)]);
xlabel('Time [s]');
ylabel('Distance [Km]');
title('Vehicle Distance')
%% Plotting Drive Cycle
figure(4)
hold on
grid on
plot(cyc_time, cyc_vel, 'linewidth', 1, 'Color', 'black');
xlabel('Time [s]')
ylabel('Velocity [Mph]')
title('Drive Cycle')
%% Test Results
Avg_speed = sum(Veh_Spd)/length(Veh_Spd);
Max_Speed = maxk(Veh_Spd,1);
table(Avg_speed,Max_Speed,kmpl,'VariableNames',{'Average Speed [kmph]','Maximum Speed [kmph]','Fuel Economy [kmpl]'})
%% Plotting engine operating points on engine fuel map
figure('Name','Engine Operating Points');
hold on
grid on
title('Engine Operating Points','fontsize',12);
plot(Eng_map_spd*30/pi,Eng_max_trq,'linewidth',2,'color','r');
p2=line([Eng_map_spd(end)*30/pi Eng_map_spd(end)*30/pi],[0 Eng_max_trq(end)]);
set(p2,'linewidth',1,'linestyle','--','color','k');
p3=line([Eng_map_spd(1)*30/pi Eng_map_spd(1)*30/pi],[0 Eng_max_trq(1)]);
set(p3,'linewidth',1,'linestyle','--','color','k');
[c,h] = contour(Eng_map_spd'*30/pi,Eng_map_trq,Eng_fuel_map');
clabel(c,h);
xlabel('Engine Speed [rpm]');
ylabel('Engine Torque [Nm]');
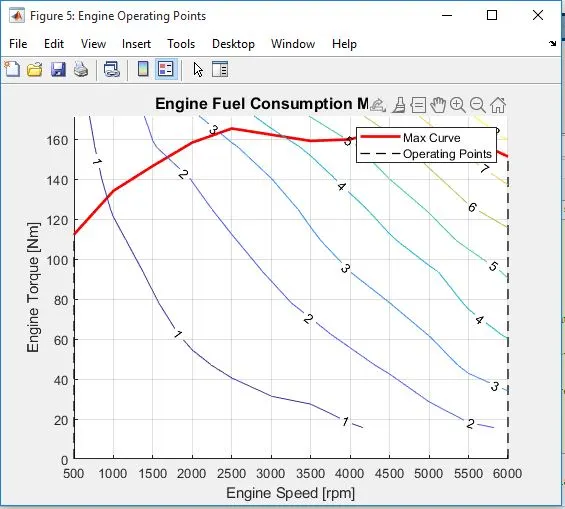
title('Engine Fuel Consumption Map [g/s]');
legend({'Max Curve','Operating Points'});
axis([Eng_map_spd(1)*30/pi Eng_map_spd(end)*30/pi 0 Eng_map_trq(end)]);
%% EM
% Plotting Motor Speed, Motor torque and Motor Input power
figure(6)
subplot(3,1,1)
hold on
grid on
plot(Time, EM_Spd, 'linewidth', 1, 'Color', 'black');
ylabel('Speed [rpm]')
xlim([0, Time(end)]);
title('Motor Speed')
subplot(3,1,2)
hold on
grid on
plot(Time, EM_Trq, 'linewidth', 1, 'Color', 'black');
ylabel('Torque [Nm]')
xlim([0, Time(end)]);
title('Motor Torque')
subplot(3,1,3)
hold on
grid on
plot(Time, EM_Pwr, 'linewidth', 1, 'Color', 'black');
xlim([0, Time(end)]);
xlabel('Time [s]');
ylabel('Power [W]');
title('Motor Input Power')
%% BATTERY
% Plotting Pack Current, Voltage and SOC
figure(7)
subplot(3,1,1)
plot(Time,V_batt,'LineWidth',1)
xlabel('Time [s]');
ylabel('Voltage [v]');
title('Pack Voltage')
xlim([0, Time(end)]);
grid on
subplot(3,1,2)
plot(Time,I_batt,'LineWidth',1)
xlabel('Time [s]');
ylabel('Current [A]');
title('Battery Current')
xlim([0, Time(end)]);
grid on
subplot(3,1,3)
plot(Time,SOC,'LineWidth',1)
xlabel('Time [s]');
ylabel('SOC [%]');
title('State of Charge - SOC')
xlim([0, Time(end)]);
grid on
%% Plotting engine operating points on engine fuel map
figure('Name','Electric Motor Operating Points');
hold on
grid on
title('Electric Motor Operating Points','fontsize',12);
p1=plot(EM_map_spd*30/pi,EM_max_trq,'linewidth',2,'color','r');
p4 =plot(EM_map_spd*30/pi,EM_max_gen_trq,'linewidth',2,'color','b');
p2=line([EM_map_spd(end)*30/pi EM_map_spd(end)*30/pi],[EM_max_gen_trq(end) EM_max_trq(end)]);
set(p2,'linewidth',1,'linestyle','--','color','k');
p3=line([EM_map_spd(1)*30/pi EM_map_spd(1)*30/pi],[EM_max_gen_trq(1) EM_max_trq(1)]);
set(p3,'linewidth',1,'linestyle','--','color','k');
[c,h] = contour(EM_map_spd'*30/pi,EM_map_trq,EM_inpwr_map');
clabel(c,h);
xlabel('Motor Speed [rpm]');
ylabel('Motor Torque [Nm]');
title('Motor in Power Map [W]');
legend([p1 p4 p3],{'Max Curve','Regen Curve','Operating Points'});
xlim([EM_map_spd(1)*30/pi EM_map_spd(end)*30/pi]);
ylim([EM_max_gen_trq(1) EM_max_trq(1)]);
Fuel Average result for HWFET and UDDS


Plotting results for HWFET and UDDS
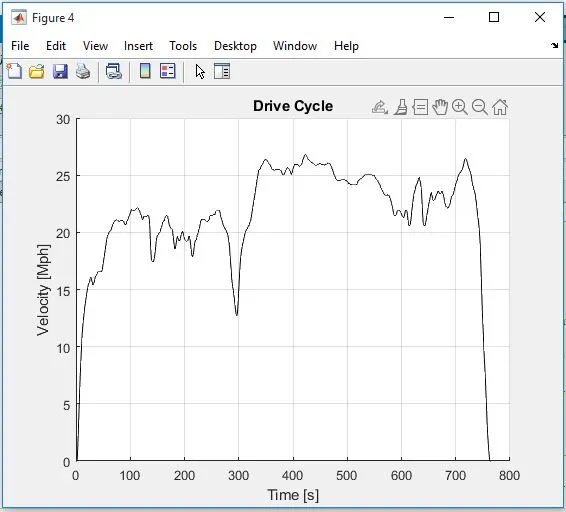
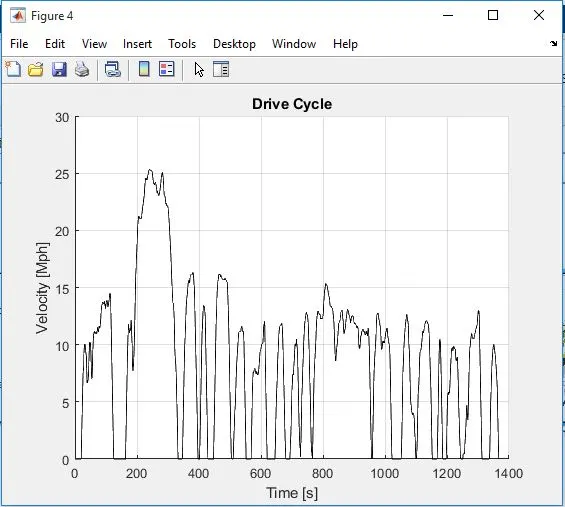
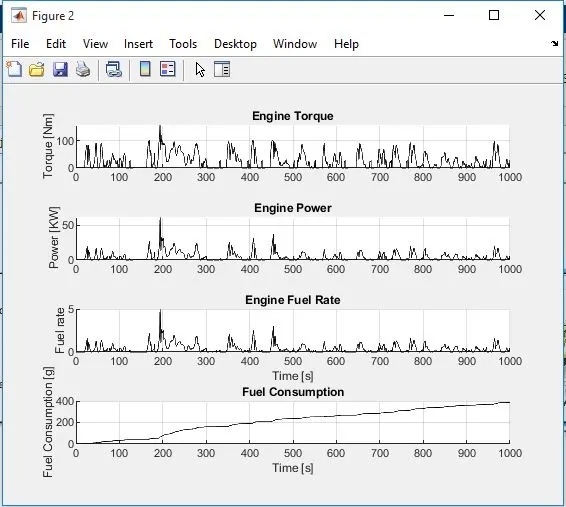
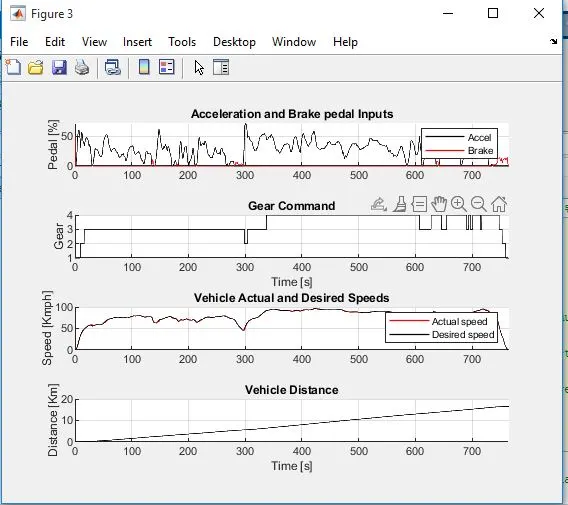
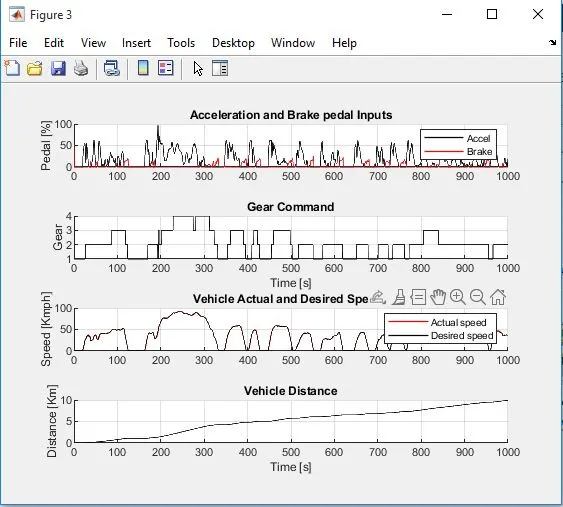
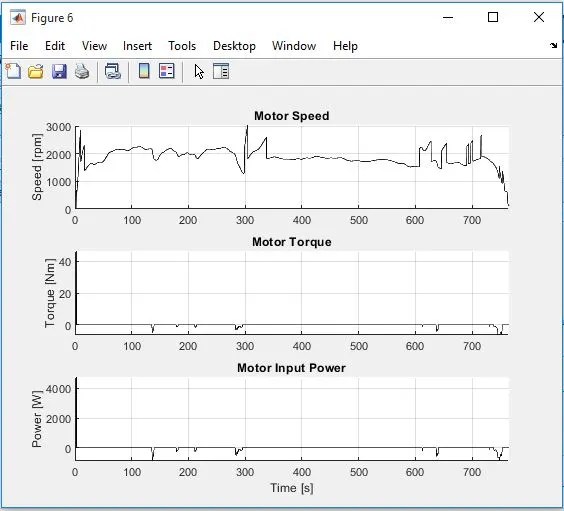
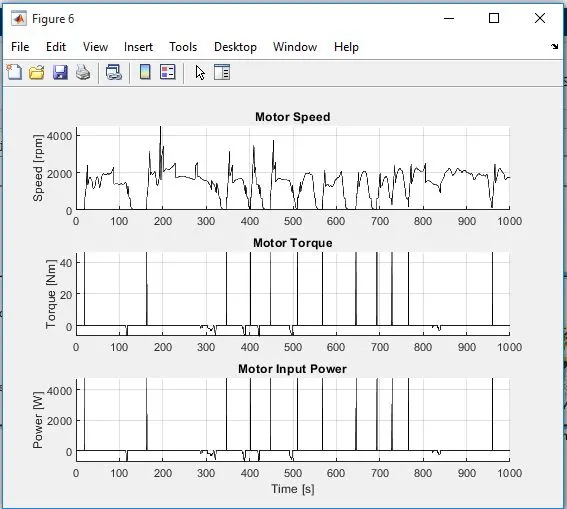
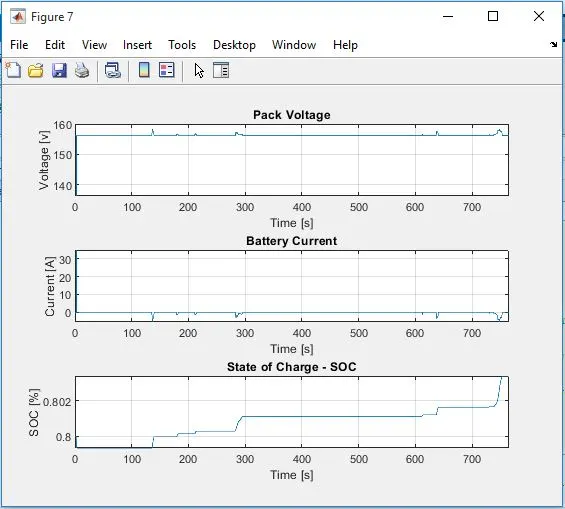
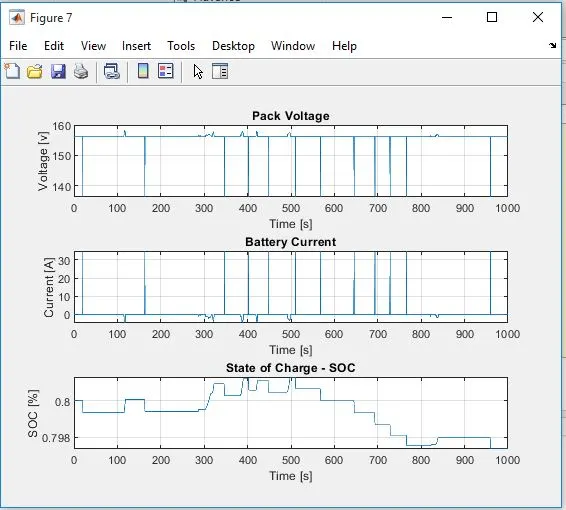
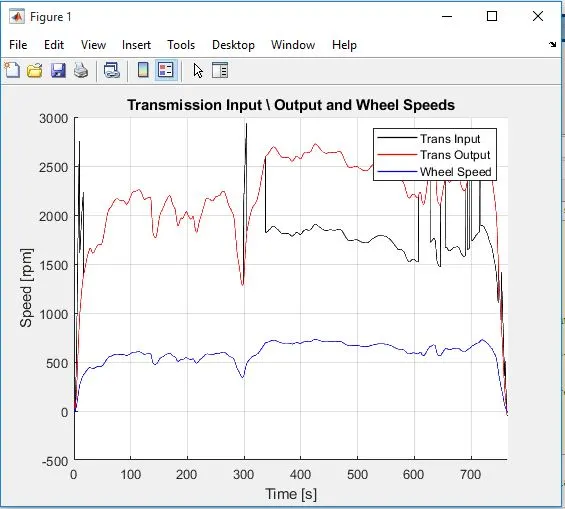
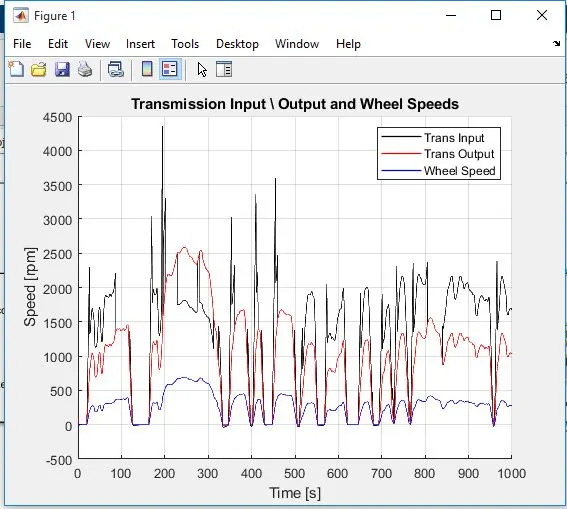
1st Figure is for HWFET and 2nd figure is for UDDS
Drive Cycle
Engine Torque, Engine Power, Engine Fuel Rate, Fuel Consumption
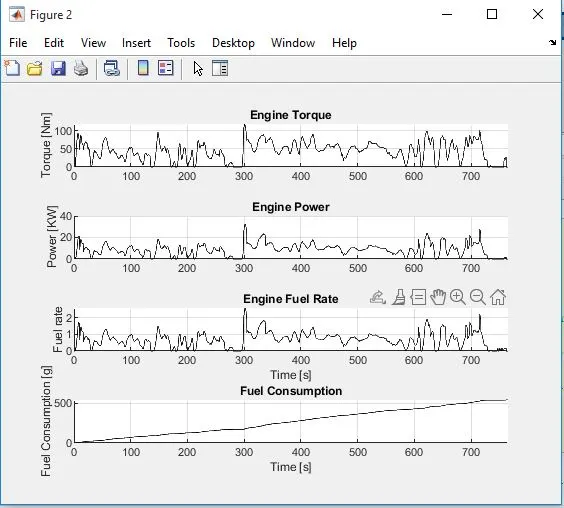
Engine Fuel Consumption
Accelerator and Brake Pedal inputs, Vehicle actual and Desired Speeds
Motor Power
Motor Speed
State of Charge Estimation, Battery Voltage, Pack Current
Transmission Input , Transmission output and Wheel speed
The above model is run with a fixed step size of 0.01 for 1000sec with solver ode4(Runge Kutta) for both drive cycles separately.
Conclusions:
The UDDS and HWFET cycle charts have been made for the forward energy-based fuel consumption model of a hybrid electric vehicle and the fuel economy number for each driving cycle was compared with the a conventional vehicle subjected to the same driving conditions.
The main observations were as follows:
* from the above scope and plot results it can be clearly said that the mileage of highways HWFET are far better than the city i.e UDDS drive cycle due to less idling and braking.
* HWFET are showing better results due to less braking and constant speed which helps in transmission for less shifting of gears meanwhile UDDS have also shown decent results due to regenerative braking as the city drive requires maximum braking due to traffic and other reasons.
* In UDDS EM works efficiently as there's braking more the vehicle can run on motor or can assist engine for better fuel economy using regenerative braking.
* Different Drive cycles affect Torque of both Engine as well as motor .
* Electric motor torque request is lower in HWFET drive cycle compared to UDDS, as the vehicle is moving at higher speeds, and there is less idling.
* Battery SOC is responding to the motor's request for torque and the brake application
by the regenerator