Project 2
Ans File :
https://docs.google.com/document/d/1CJcE1vbWgFilfa5WXkteQd7dXI4ysDCR/edit?usp=sharing&ouid=112031055003736671606&rtpof=true&sd=true
***********************************************************************************************************
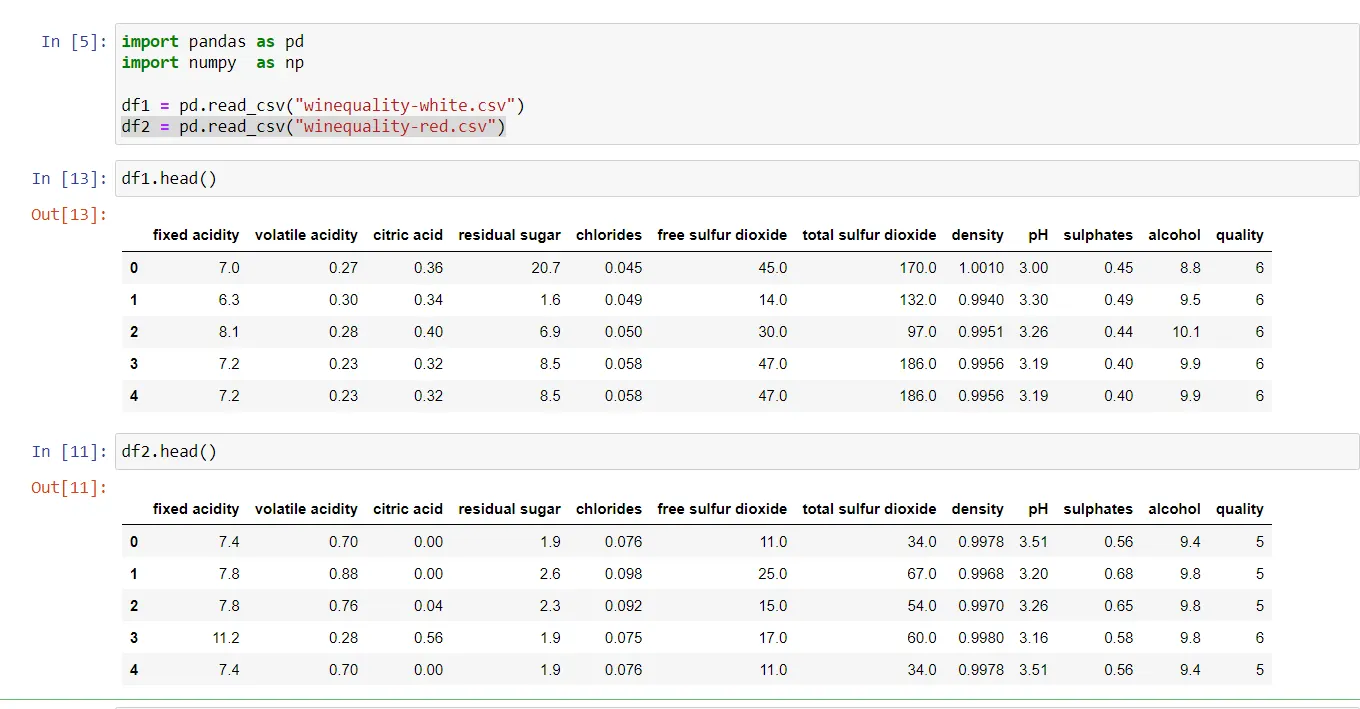
1. Display the data of white wine and red wine
***********************************************************************************************************
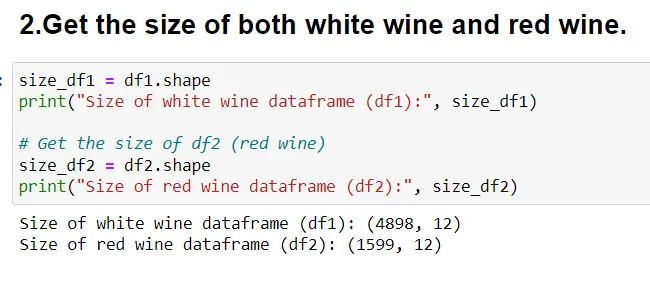
2.Get the size of both white wine and red wine.
***********************************************************************************************************
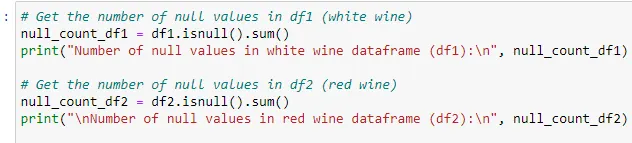
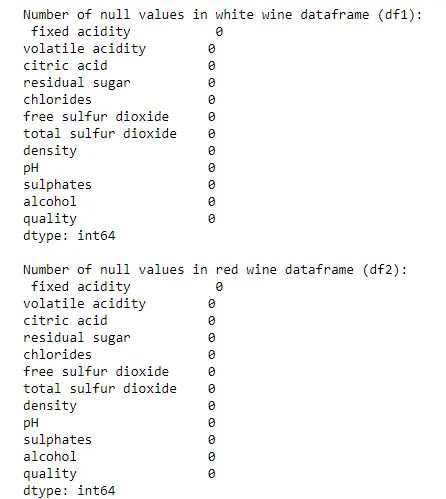
3.Get the number of null in both type of wines
***********************************************************************************************************
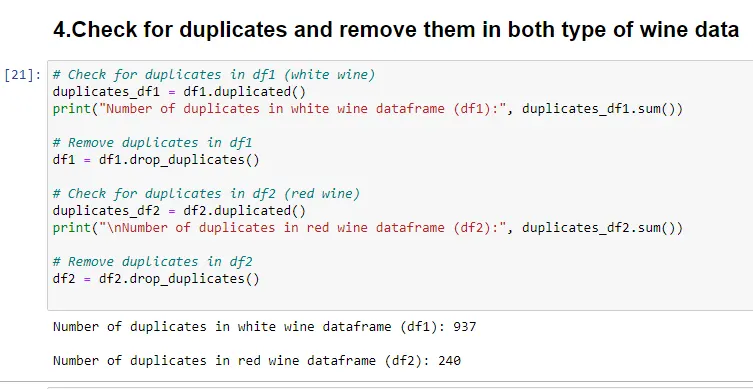
4.Check for duplicates and remove them in both type of wine data
***********************************************************************************************************
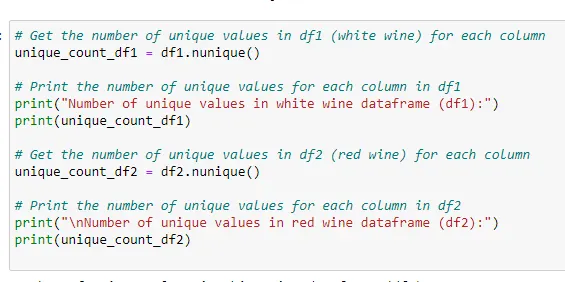
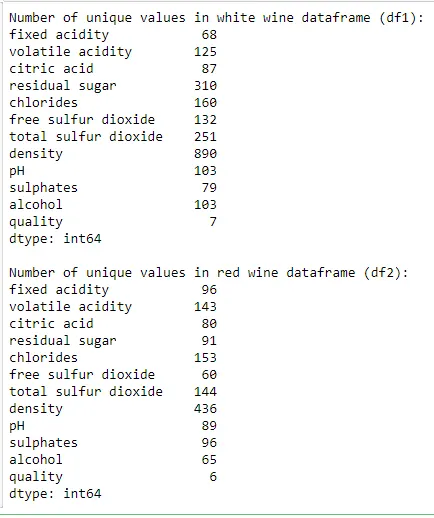
5.Get the number of uniques values in all Feature and print them
***********************************************************************************************************
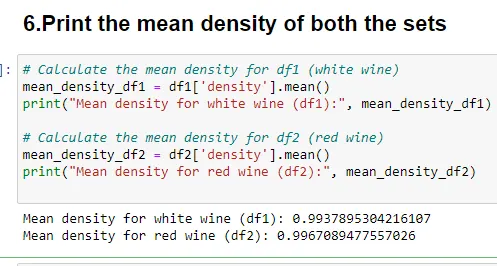
6.Print the mean density of both the sets
***********************************************************************************************************
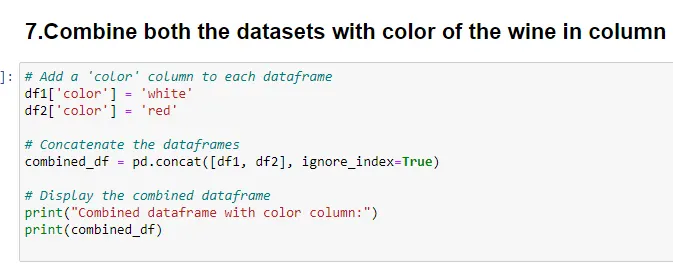
7.Combine both the datasets with color of the wine in column
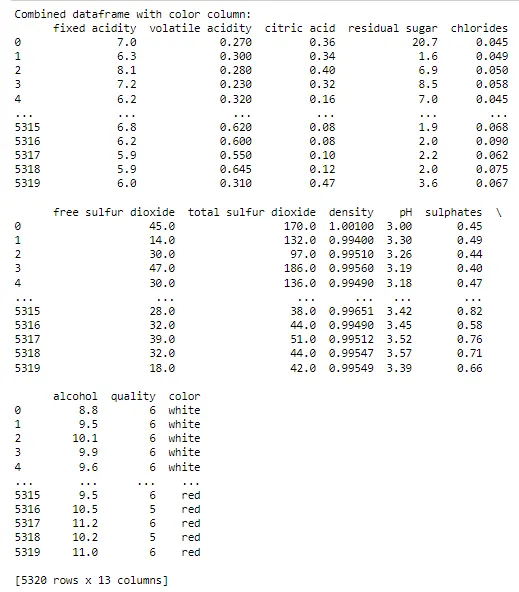
[5320 rows x 13 columns]
***********************************************************************************************************
8.Remove the null values if any
Already remove null values in Q4
***********************************************************************************************************
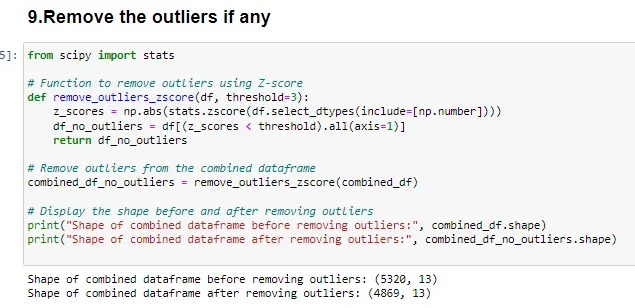
9.Remove the outliers if any
***********************************************************************************************************
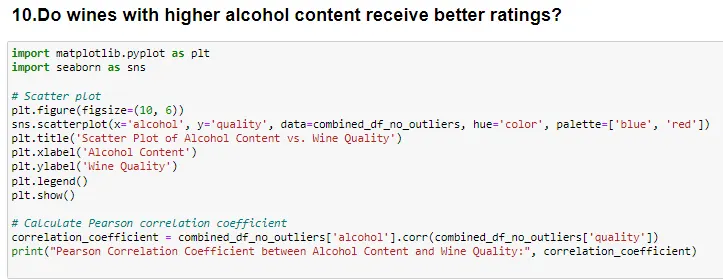
10.Do wines with higher alcohol content receive better ratings?
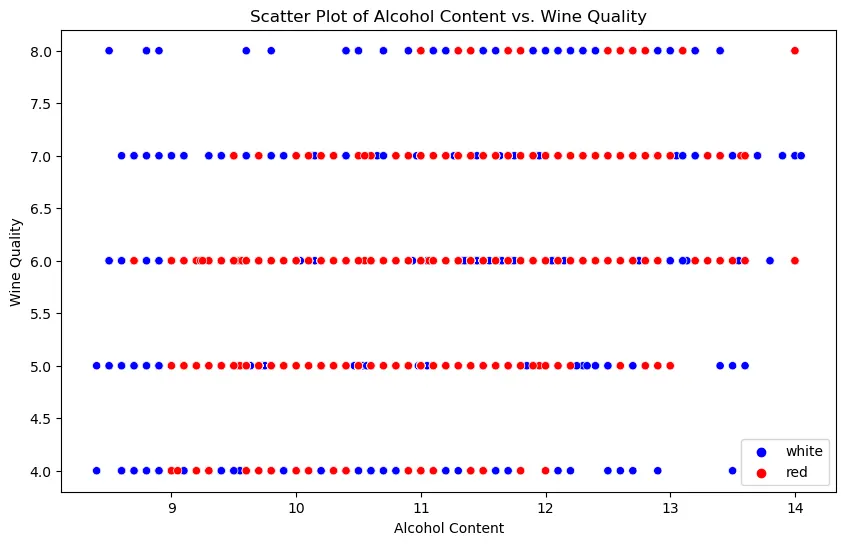
In this example:
- A scatter plot is created to visualize the relationship between alcohol content (alcohol) and wine quality (quality).
- The plot is colored by the wine's color (white or red) for better differentiation.
- The Pearson correlation coefficient is calculated to quantify the linear relationship between alcohol content and wine quality.
***********************************************************************************************************
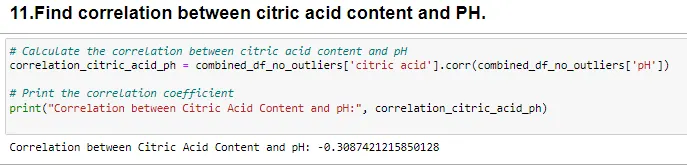
11.Find correlation between citric acid content and PH.
***********************************************************************************************************
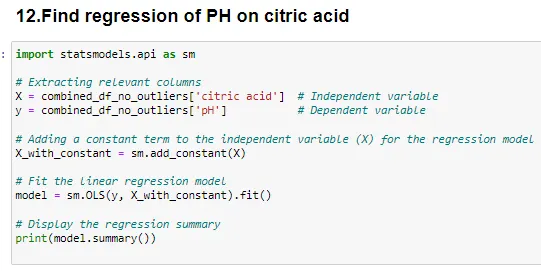
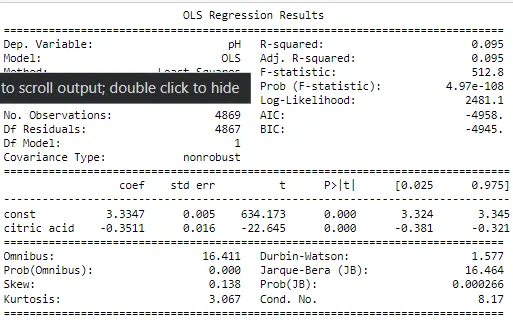
12.Find regression of PH on citric acid
***********************************************************************************************************
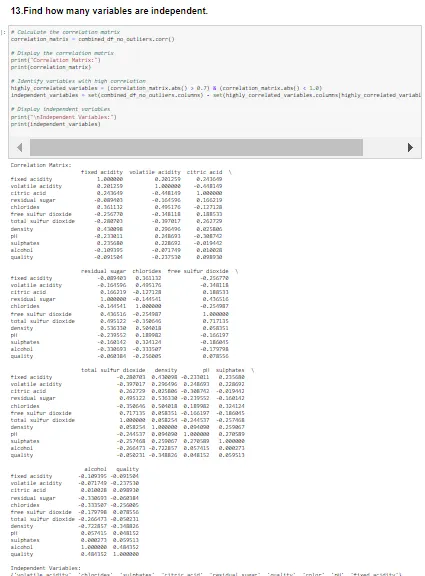
13.Find how many variables are independent.
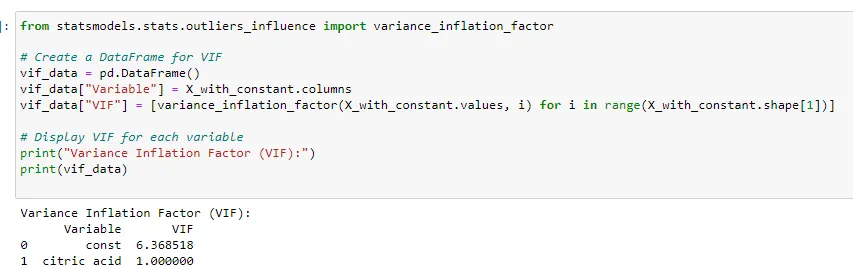
Variance Inflation Factor (VIF):
      Variable       VIF
0        const  6.368518
1  citric acid  1.000000
***********************************************************************************************************
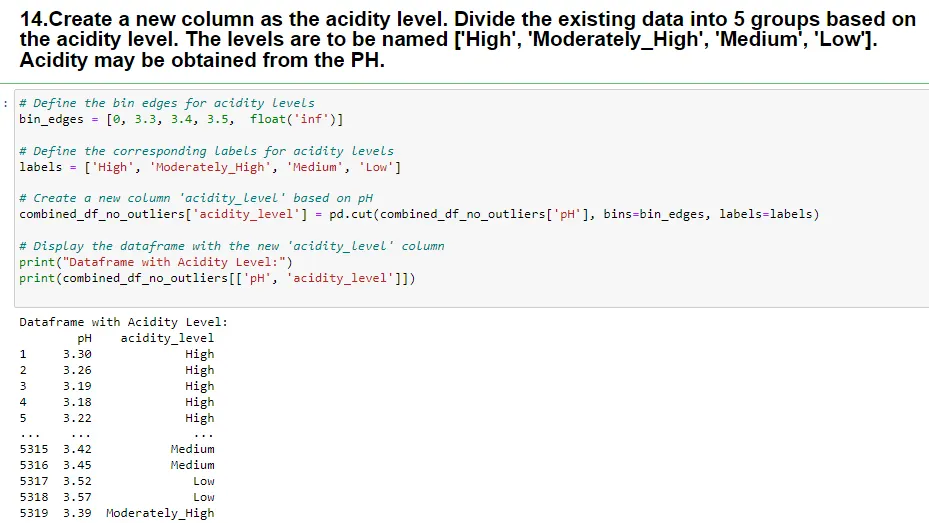
14.Create a new column as the acidity level. Divide the existing data into 5 groups based on the acidity level. The levels are to be named ['High', 'Moderately_High', 'Medium', 'Low']. Acidity may be obtained from the PH.
***********************************************************************************************************
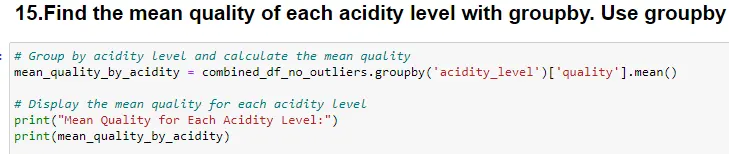
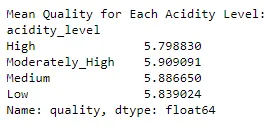
15.Find the mean quality of each acidity level with groupby. Use groupby
***********************************************************************************************************
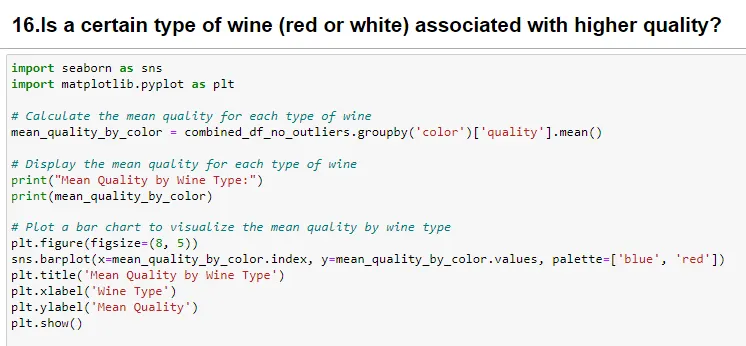
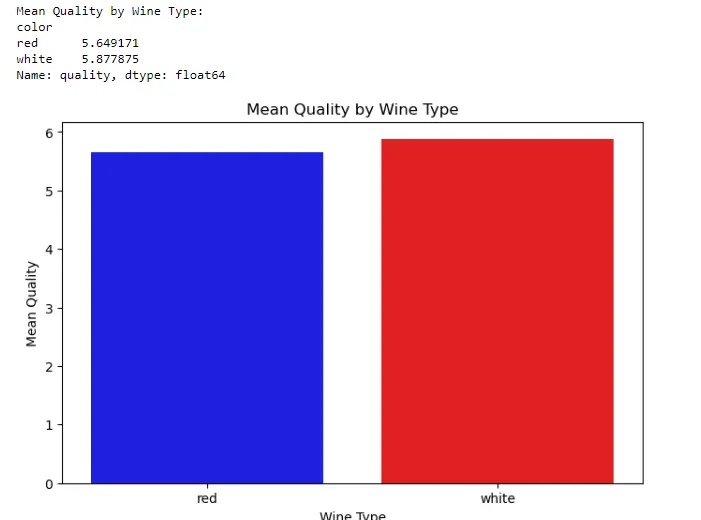
16.Is a certain type of wine (red or white) associated with higher quality?
***********************************************************************************************************
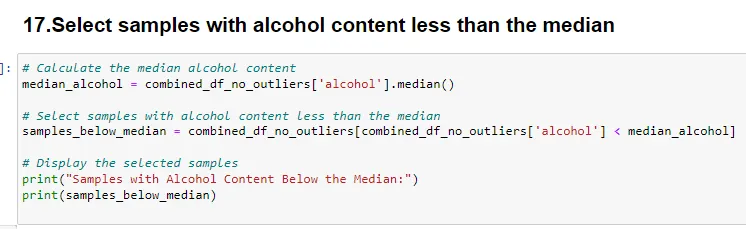
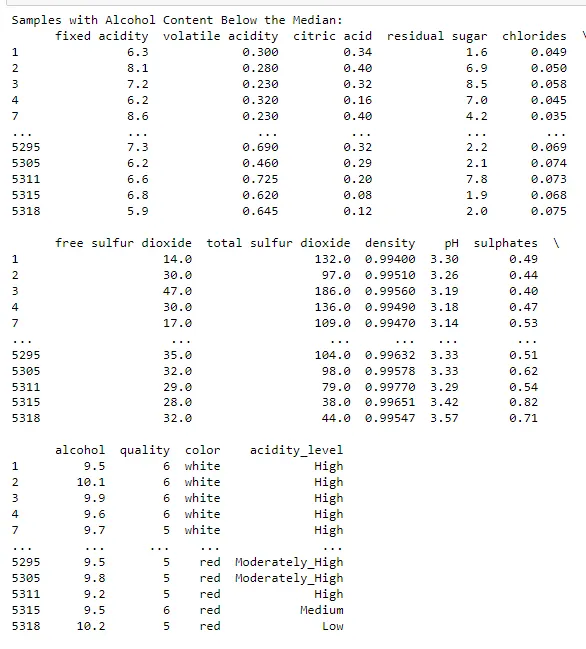
17.Select samples with alcohol content less than the median
***********************************************************************************************************
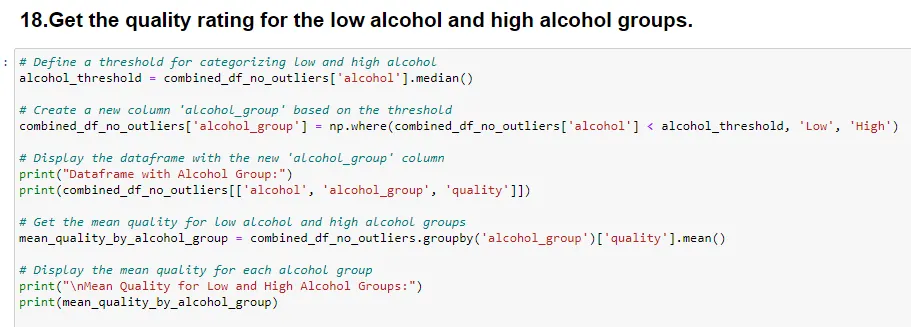
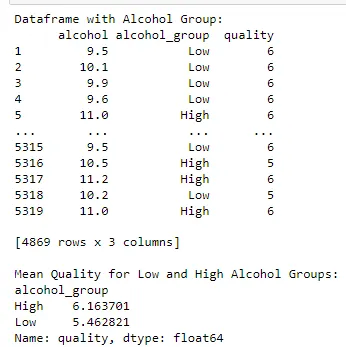
18.Get the quality rating for the low alcohol and high alcohol groups.
***********************************************************************************************************
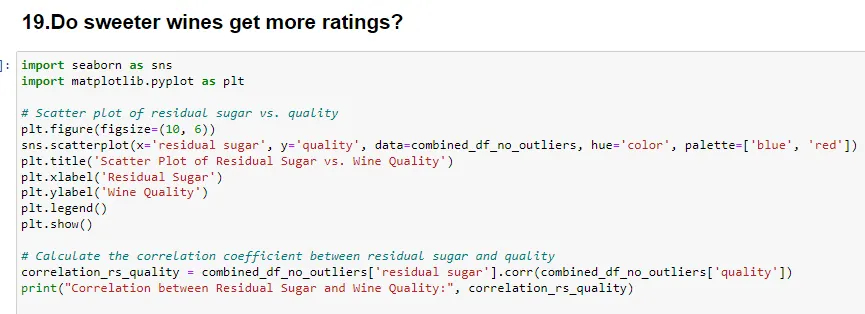
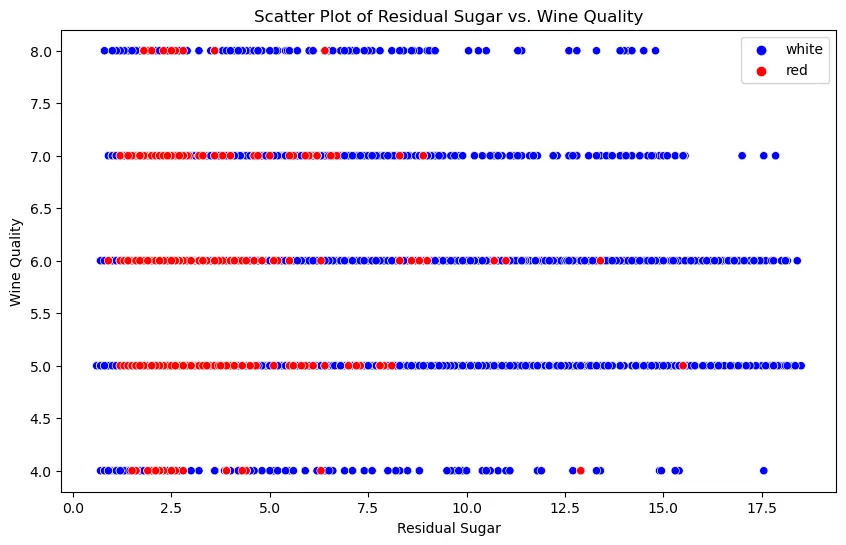
19.Do sweeter wines get more ratings?
***********************************************************************************************************
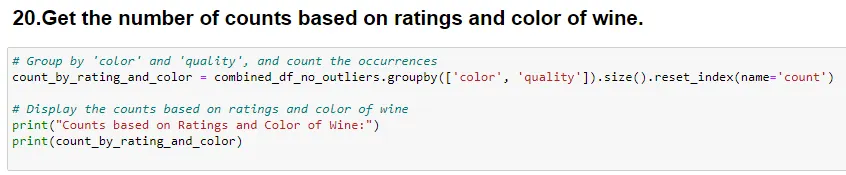
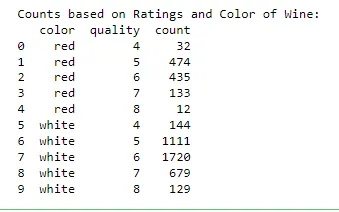
20.Get the number of counts based on ratings and color of wine.
***********************************************************************************************************
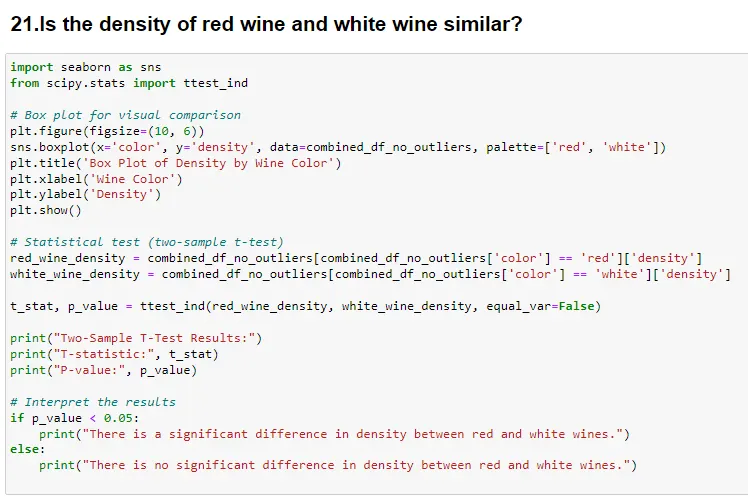
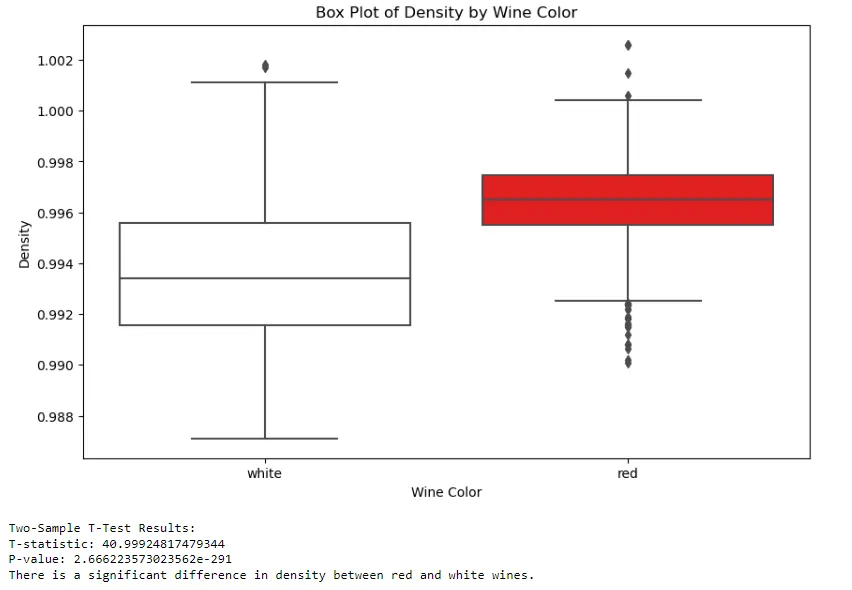
21.Is the density of red wine and white wine similar?
***********************************************************************************************************
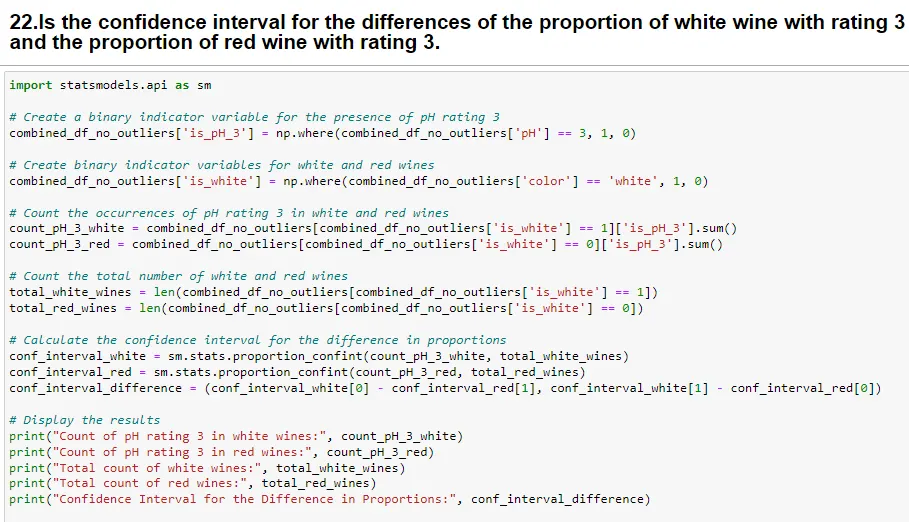
22.Is the confidence interval for the differences of the proportion of white wine with rating 3 and the proportion of red wine with rating 3.

***********************************************************************************************************