Project 2
Aim of the Project :
Using MATLAB/simulink and the drive cycle from the attached excel sheet, find-
- The max heat generation of the battery
- The SOC of the battery at 2*104 second of the battery operation
| Time | Time Step | Battery Current |
| 00:00.4 | 0.1 | -0.9632 |
| 00:00.5 | 0.2 | -0.952 |
| 00:00.6 | 0.3 | -0.9072 |
| 00:00.7 | 0.4 | -0.9632 |
| 00:00.8 | 0.5 | -1.0304 |
| 00:00.9 | 0.6 | -0.9632 |
| 00:01.0 | 0.7 | -1.0304 |
| 00:01.1 | 0.8 | -1.008 |
| 00:01.2 | 0.9 | -0.9856 |
| 00:01.3 | 1 | -0.9632 |
| 00:01.4 | 1.1 | -0.9184 |
| 00:01.5 | 1.2 | -0.9296 |
| 00:01.6 | 1.3 | -0.9296 |
| 00:01.7 | 1.4 | -0.9296 |
| 00:01.8 | 1.5 | -0.9184 |
| 00:01.9 | 1.6 | -0.9408 |
| 00:02.0 | 1.7 | -0.896 |
| 00:02.1 | 1.8 | -0.9072 |
| 00:02.2 | 1.9 | -0.9072 |
| 00:02.3 | 2 | -0.9408 |
| 00:02.4 | 2.1 | -0.9296 |
| 00:02.5 | 2.2 | -0.9296 |
| 00:02.6 | 2.3 | -0.9968 |
| 00:02.7 | 2.4 | -0.9968 |
| 00:02.8 | 2.5 | -0.9408 |
| 00:02.9 | 2.6 | -0.9408 |
| Battery resistance | 2 milli ohm |
delta time is 0.1 and entropic factor is 2
Part 1:The max heat generation of the battery
Theory:
For heat generation:
we know that there are two forms of heat generated during the operation of the pack which are
- Entropic Heat
- Joule heat
in terms of mathematic formula it can be written as:
⇒Q=Qjoule+Qentropic⇒�=�joule+�entropic
where
⇒Qjoule=I2Rint⇒�joule=�2�int
so it is given that
⇒Rint=2mΩ⇒�int=2�Ω
which means that the Joule heat created at each instant will be as follows, and also it has been given that
⇒Entropic Factor=2⇒Entropic Factor=2
⇒Entropic Heat=Entropic Factor×Joule heat⇒Entropic Heat=Entropic Factor×Joule heat
⇒Entropic Heat=2×Joule heat⇒Entropic Heat=2×Joule heat
After plotting the current we can see the waveform ot it visually.
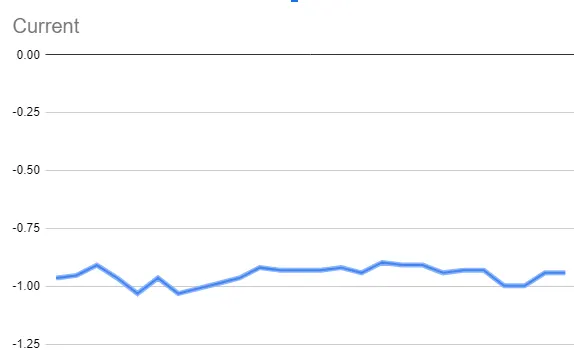
Fig: Current from the battery can be seen for the duration
we can calculate the Joule heat and Entropic heat at each instant and tabulate them as follows:
| Time Step | Battery Current | joule heat | Entropic heat | Total heat |
| 0.1 | -0.9632 | 1.8555 | 3.7110 | 5.5665 |
| 0.2 | -0.952 | 1.8126 | 3.6252 | 5.4378 |
| 0.3 | -0.9072 | 1.6460 | 3.2920 | 4.9381 |
| 0.4 | -0.9632 | 1.8555 | 3.7110 | 5.5665 |
| 0.5 | -1.0304 | 2.1234 | 4.2469 | 6.3703 |
| 0.6 | -0.9632 | 1.8555 | 3.7110 | 5.5665 |
| 0.7 | -1.0304 | 2.1234 | 4.2469 | 6.3703 |
| 0.8 | -1.008 | 2.0321 | 4.0643 | 6.0964 |
| 0.9 | -0.9856 | 1.9428 | 3.8856 | 5.8284 |
| 1 | -0.9632 | 1.8555 | 3.7110 | 5.5665 |
| 1.1 | -0.9184 | 1.6869 | 3.3738 | 5.0608 |
| 1.2 | -0.9296 | 1.7283 | 3.4566 | 5.1849 |
| 1.3 | -0.9296 | 1.7283 | 3.4566 | 5.1849 |
| 1.4 | -0.9296 | 1.7283 | 3.4566 | 5.1849 |
| 1.5 | -0.9184 | 1.6869 | 3.3738 | 5.0608 |
| 1.6 | -0.9408 | 1.7702 | 3.5404 | 5.3106 |
| 1.7 | -0.896 | 1.6056 | 3.2113 | 4.8169 |
| 1.8 | -0.9072 | 1.6460 | 3.2920 | 4.9381 |
| 1.9 | -0.9072 | 1.6460 | 3.2920 | 4.9381 |
| 2 | -0.9408 | 1.7702 | 3.5404 | 5.3106 |
| 2.1 | -0.9296 | 1.7283 | 3.4566 | 5.1849 |
| 2.2 | -0.9296 | 1.7283 | 3.4566 | 5.1849 |
| 2.3 | -0.9968 | 1.9872 | 3.9744 | 5.9617 |
| 2.4 | -0.9968 | 1.9872 | 3.9744 | 5.9617 |
| 2.5 | -0.9408 | 1.7702 | 3.5404 | 5.3106 |
| 2.6 | -0.9408 | 1.7702 | 3.5404 | 5.3106 |
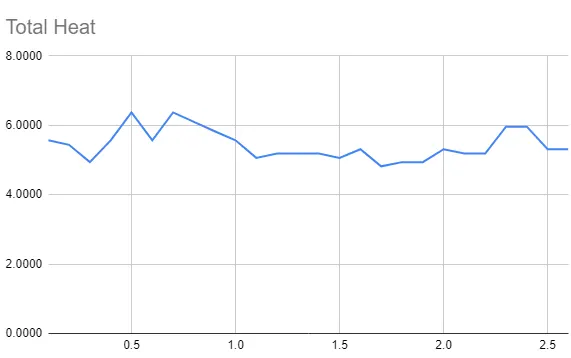
Fig: total heat graphically represented
Note the Unit of the resistance ismΩ�Ωand Current in A�
so the unit of the Heat generated is mJ��
from here we can see that the maximum heat generated would be somwhere around 0.5s.
From the tabular data we see that the maximum heat generated is 6.3703mJ6.3703��
Part 2: The SOC of the battery at 2*104 second of the battery operation
for this we will need the battery to be providing the current as we have been given in the table and after the end of the time we will have to measure the state of the battery.
we will develop the model for the simulation as we will see soon. But first the blocks we need to implement the model are:
- Battery - for the battery we wish to use with its parameters like Nominal Voltage and Nominal capacity and Voltage-SoC behavior and other parameters
- Repeating Sequence - since the current signal information is only for 2.6s and we need to run the simulation for 2*104 s we will need to implement a repeating sequence with the sequence that is repeating to be the tabular current values we have been proivided
- Controlled current source - since we need to draw the current according to the current values provided as tabular form we need to extract the current drom the battery in the same way. So the load will be a controlled current source extracting the current in the same waveform of the current tabulated until the simulation is complete
- Bus Selector - as the output of the battery has many signal we need only certain signals(soc and current) so for that we need bus selector for having output as only those signals we need
- Current measurement - to measure the current being extracted from the battery
- Display - to display instantaneous values of interest such as Voltage,SOC and current
- Scope - to plot the signals we want to inspect
Implementation:
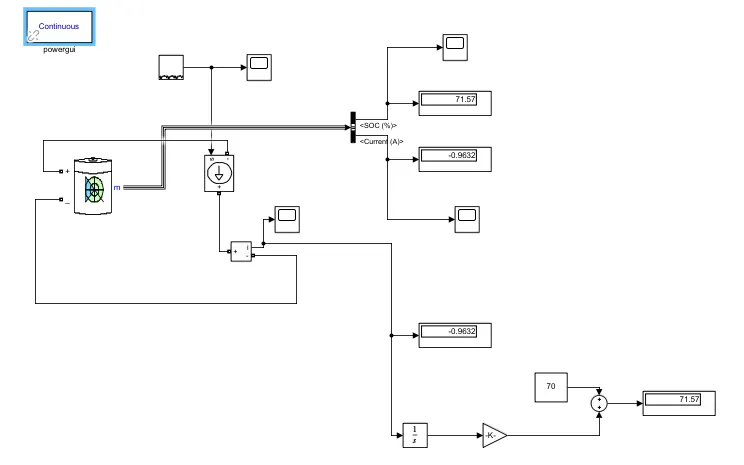
Fig: implementation of the model .
explaination: the repeating sequence will keep on repeating the current tabulated cycle until the end of simulation (2*104s) which will go into the input signal of the controlled current source which will generate a current with the same value. This current source acts as a load to the battery and will extract the current as the waveform is until the end of simulation. The current extracted can be intgerated wrt time and we will get the total amount of charge that has been extracted which after conversion to appropriate units and subtracting from total charge will give us SoC left in the battery. This is coulomb counting method.
We will also extract the SoC from the output of the battery block to see the SoC from there.
Model: we will take a battery with Nominal Voltage of 3.6V and Nominal capacity of 3.5Ah. We will take initial SoC to be less that 1. Because: the current direction is negative that is , according to usal convention this means current is flowing in the battery and hence it is being charged. So if intial SoC is 100 it will not show any change as he SoC cannot go above 100%. For the simulation the initial SoC is taken to be 70%
So after running the simulation for 2*104s we see that the battery soC has increased to 71.57% that means the change in SoC is of 1.57% if the battery receives the Current waveform cycle for 2*104s
the coulomb counting method also gives us the same SoC value, that is, 71.57%.
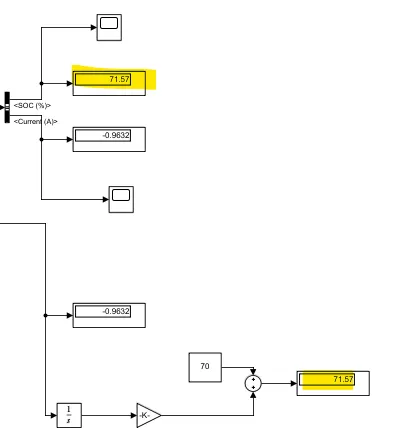
Fig: SoC from coulomb counting and the Battery output match
so SoC of battery(3.6v, 3.5Ah) at 2*104s of the operation is 71.57% (initial SoC=70%)
or change in SoC at 2*104s of the operation is 1.57%.
Taking a look at the Signals:
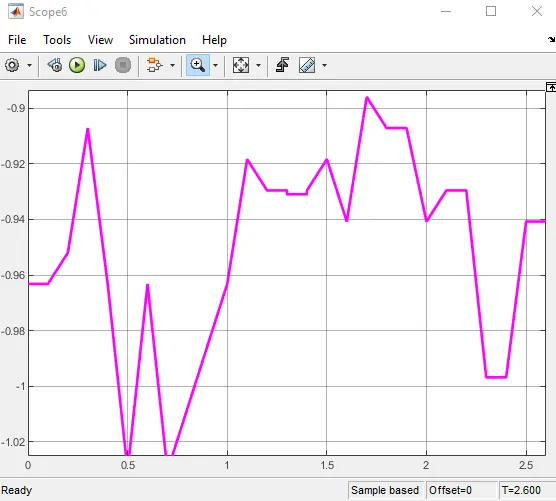
Fig: Current waveform of 2.6s provided in the tabulated format
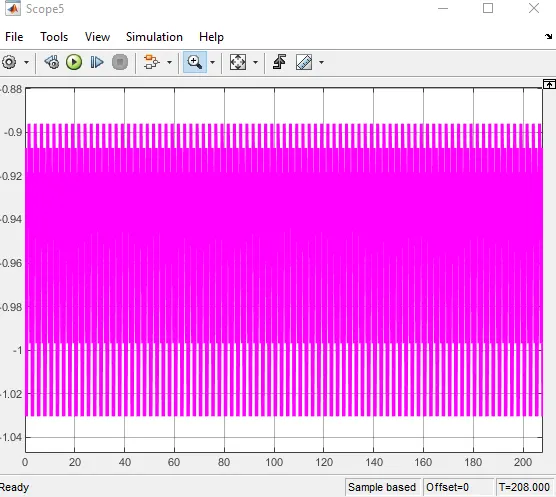
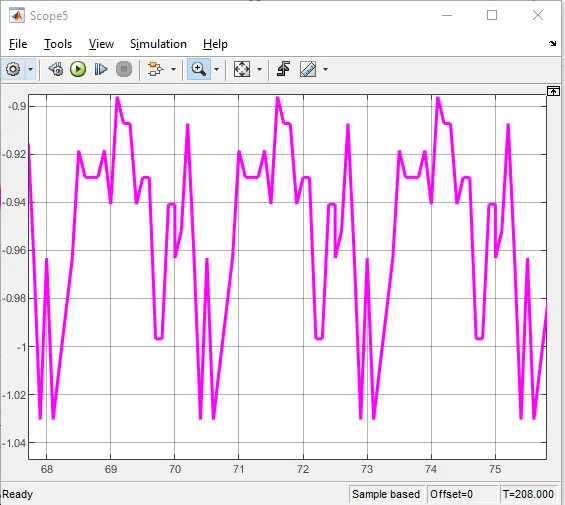
Fig: Repeating signal repeating the 2.6s current waveform for 2*104(208)s. Zoomed for 3 current cycles
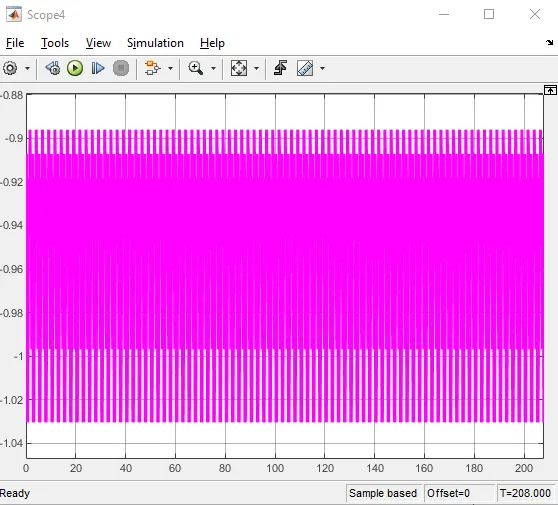
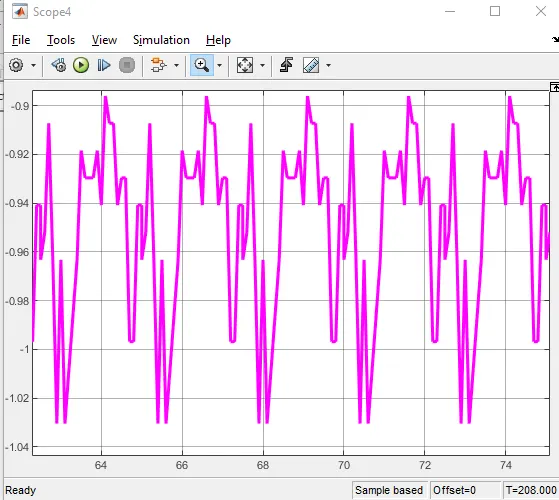
Fig: Current measured waveforms from the current measurement block
Summary And Conclusion:
the maximum heat generation was found to be 6.3707 mJ and
the Simulink model using the Current cycle was run for 208(2*104)s was implemented and the change in SoC was found to be 1.57%. We used a 70% intial SoC and ended up with 71.57% .