SAE BAJA Vehicle Analysis
(CVT Model)
- Input:
For Engine: Brake & Throttle Input using Signal Builder.
For Transmission: Gear ratio using Signal Builder.
- Output:
For Car: Vehicle Speed.
For Transmission: Secondary shaft RPM.
- System diagram:
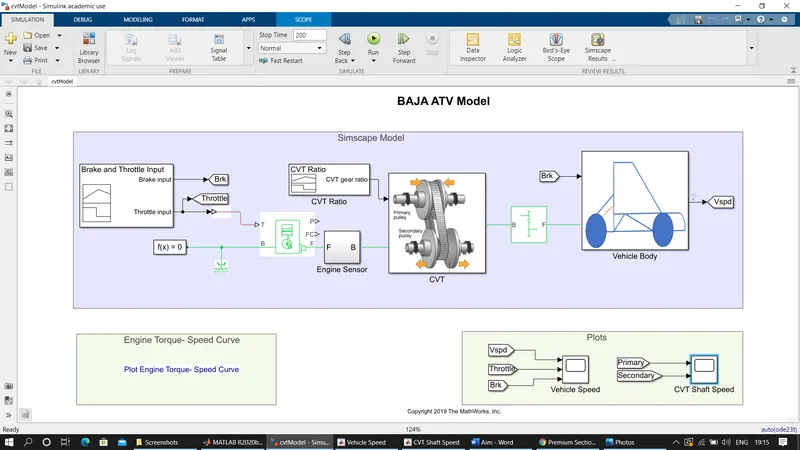
It is a system of BAJA All-Terrain Vehicle, where they have used Three main systems like Generic Engine, Continuously Variable Transmission (CVT) and Vehicle Body.
The parameters of Generic Engine are given through the attached graph and Inputs of the Engine are throttle position and brake using signal builder block.
According to given parameters and position of the throttle an output is Engine RPM.
The Output shaft of engine is connected to the primary pully of the CVT. The Primary pully of CVT transmits the motion to the secondary pully through a belt strap.
To achieve a desirable wheel torque in the car, gear ratio should be defined at a different time and condition. So, the input of the CVT System is Gear ratio.
A simple gear is attached in the system for the purpose of reducing the RPM of the secondary shaft to the final drive.
The third system is Vehicle body. Which will simulate the speed of the vehicle (Output) by taking account in to the fundamental external forces acting on a vehicle.
The vehicle Body block requires some fundamental data like Position of the CG, Wheels per axle, Value of the Drag and Air co-efficient, and Area & Mass of the vehicle.
Physically vehicle body is connected to the parameters like translational movement in the horizontal direction through tires, Front and Rear normal wheel force, Wind velocity acted on the body and the inclination angle of the road.
The Normal Wheel force acting on the body is modelled using a Tire block. This block has 4 input ports. The port A is rotational conserving port for the wheel axle. Port H is the mechanical translational conserving port for wheel hub. Port N is for normal force applied to the tires. And Port S reports the tire slip.
- Result Analysis:
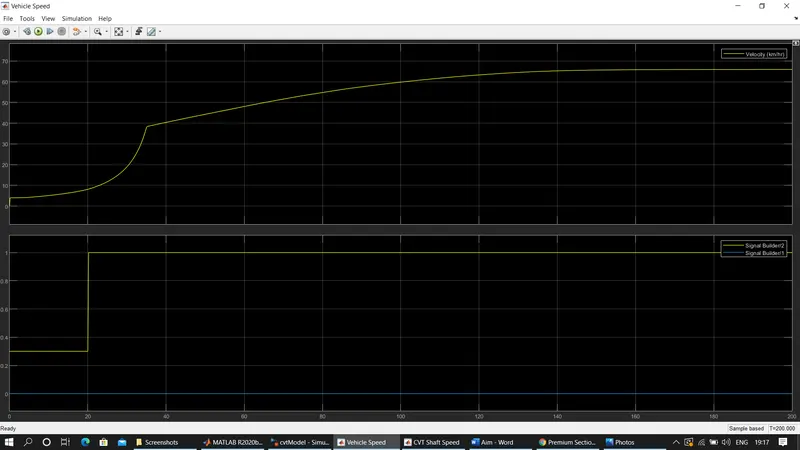
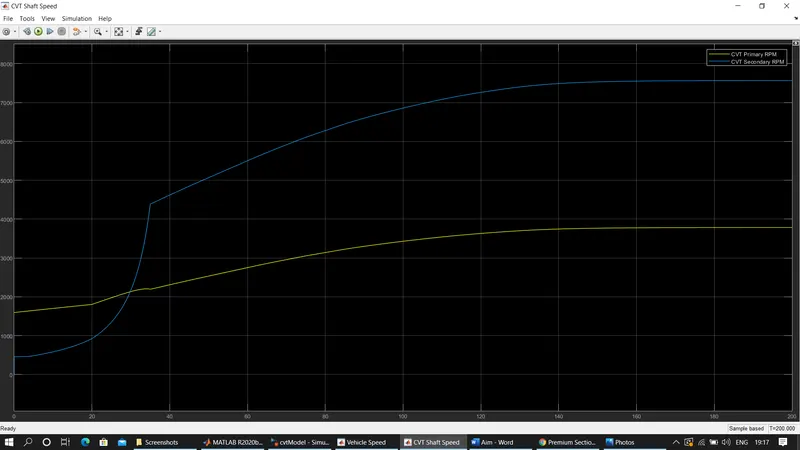
Continuously Variable Transmission has Primary pully which is connected to the output shaft of the engine so it is also known as Base and according to gear ratio Secondary pully rotates which is also known as Follower.
Primary Shaft rotates at the same RPM as the output shaft of engine in graph we can see that and also up to 4 sec gear ratio is 3.5. So, this means that to get a higher Torque gear ratio is increased.
To complete a 1 rotation of Secondary pully 3.5 rotation of Primary pully is needed and this condition is achieved when the diameter of secondary pully is more than the primary pully.
After 5 to 35 secs Gear ratio is gradually decreased from 3.5 to 0.5. Due to this the RPM of secondary pully is increasing exponentially.
There is also change in slope for the curve of Primary Shaft between 20 to 35sec because after 20 sec throttle position of the engine is fully opened. So, The RPM of Primary shaft is increasing.
After 35 sec RPM of Primary and Secondary shaft are increasing gradually up to 140secs and then it is constant at around 3800 and 7500 RPM of Primary and secondary shafts respectively. (Because limit of the maximum RPM is set by BAJA Competition)
Vehicle speed curve has the same behavior as the secondary pully of the CVT as it is connected to the final drive axle of the vehicle.
(CVT Dashboard)
- System Diagram:
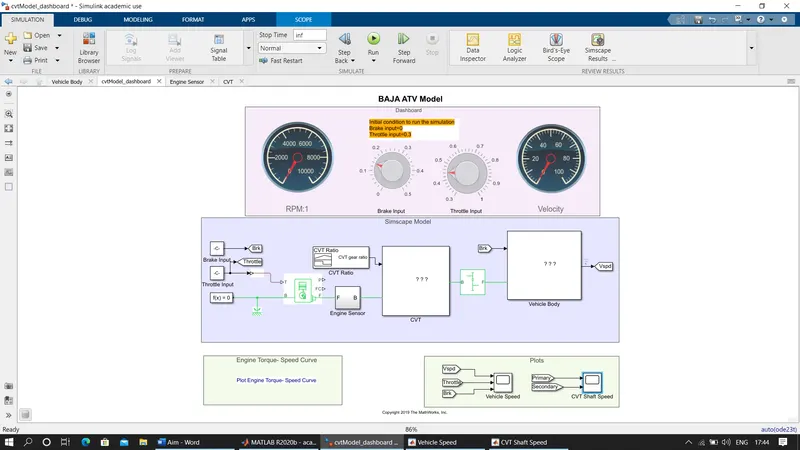
The whole system arrangement is same as above but the difference is only an Input can be given in real time with the help of Knob and output can be observe graphically using circular gauge.
Here real time data of brake and throttle input is given using Knob and in that knob minimum and maximum limit is set for the given system.
- Result Analysis:
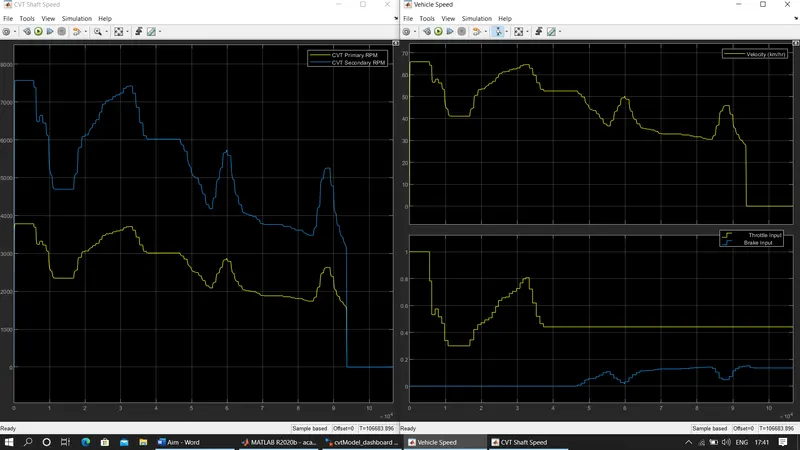
As throttle position is variate or more than zero the engine RPM variates according to that. Here the engine RPM is also disturbed through a brake input during a real time simulation.
From the graphical representation and graph it can be seen that higher RPM in engine can be achieved through setting the value of throttle position near to the 1.
If the value of engine RPM is higher the speed of the vehicle is also Higher. CVT gear ratio is less at higher RPM so the available torque will be less but the velocity will be higher.
From the graph it can be seen that maximum possible speed of the vehicle is around 66 km/hr. it is maximum because at this point the throttle position is at 1 brake input is 0 and RPM is maximum.
Here the noticeable thing is when break is applied the speed of vehicle is decreasing but when throttle position is constant at 0.5 and break is applied more than 0.15 point the vehicle has stopped running and after that it has no effect whatever the position of throttle.
CVT shaft speed has the same behavior as above because it has the same gear ratio as before.
(CVT Mapped)
- Input:
For Engine: Brake & Throttle Input using Step signal.
For Transmission: Velocity of the vehicle
- Output:
For Car: Vehicle Speed.
For Transmission: Secondary shaft RPM.
- System Diagram
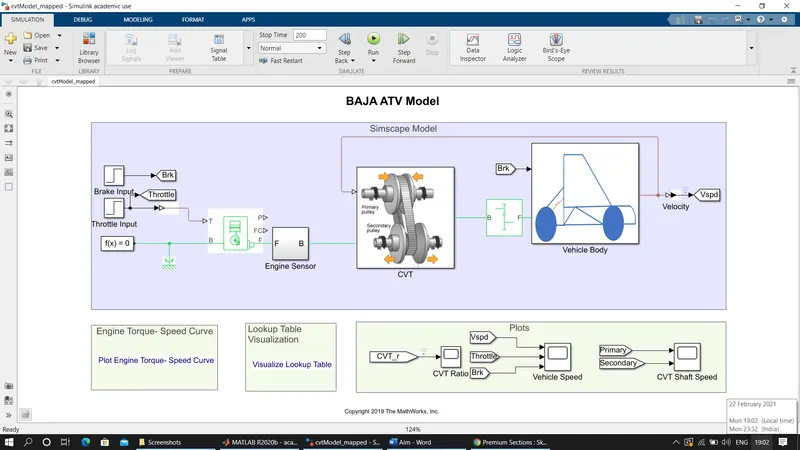
In this system inputs of the Generic Engine and gear ratio of the CVT is given more practical and tried to simulate the realistic model of the BAJA all-terrain vehicle.
The parameters of Generic Engine are given through the attached graph and Inputs of the Engine are throttle position and brake using step input.
According to given parameters and position of the throttle and break an output is the Engine RPM.
The Output shaft of engine is connected to the primary pully of the CVT. The Primary pully of CVT transmits the motion to the secondary pully through a belt strap.
To achieve a desirable wheel torque in the car, gear ratio should be defined at a different time and condition. So, the input of the CVT System is velocity of the vehicle.
At specified velocity of vehicle defined gear ratio is achieved in the system, this defined gear ratio is given using look up table. The data set of look up table is logged signal of the real condition gear ratio as per the speed.
The third system is Vehicle body. Which will simulate the speed of the vehicle (Output) by taking account all the fundamental external forces acting on a vehicle.
Here the brake input is also given for the purpose of simulating the force acting on wheels of the vehicle.
The forces acting on the vehicle body are same as discussed above.
- Result Analysis
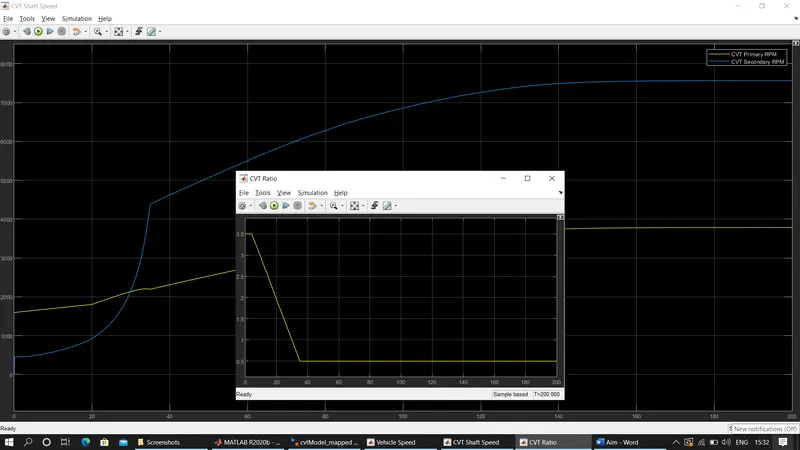
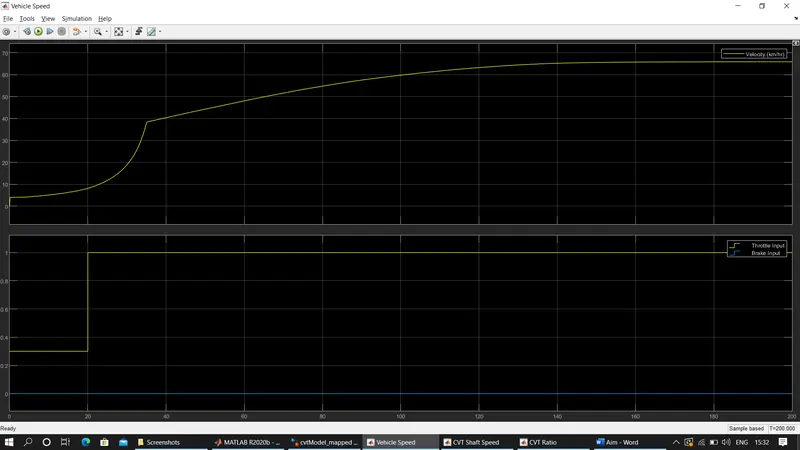
From the graph of CVT Shaft speed we can see that the RPM of the Primary pully is the same as the RPM of engine output shaft. because it is connected directly with engine.
RPM of the engine is depending on the characteristic curve of torque and speed and also its throttle and break input at the time instance. The value of the break input is zero through a whole simulation so, the throttle input is the responsible to variate the engine RPM.
In this system the gear ratio of the transmission is an input of the CVT system. And this gear ratio is fixed for a specific speed of the vehicle. That is why here the input of the CVT system is vehicle speed. As per the speed of the vehicle there is a specific gear ratio in transmission.
From 0 to 20 sec,
Value of throttle input is 0.3 but the engine RPM is slightly increasing because of its torque- speed characteristic curve. As engine output shaft is connected to primary pully of the transmission so it has also same behavior as engine RPM.
But RPM of the secondary pully is less than the primary pully though it is also increasing but it is less than Primary pully due to higher gear ratio. In this time instance gear ratio is 3.5 to 2.
From 20 to 35 sec,
During this time instance value of throttle is maximum. Because of its Primary pully has a higher RPM than time instance 0 to 20 sec. In this duration RPM of the Secondary pully is increasing exponentially.
At 30 sec, Secondary pully has a more RPM than the Primary pully because at this point gear ratio is 0.9 now onwards gear ratio is decreasing as the speed of the vehicle is increasing.
After 35 sec,
Now during this time, the value of throttle input is remained maximum and also the value of gear ratio is constant at 0.5. This means to complete the 1 rotation of Secondary pully only half rotation of Primary pully is required.
So, until the maximum limit of RPM is achieved in Primary pully it is increasing and the same behavior is in the Secondary pully. At around 3800 RPM maximum limit is achieved in the primary pully and then it is constant.
The maximum limit of Secondary pully RPM is 7500 at this point the speed of the vehicle is maximum.
(CVT Mapped Dashboard)
- System Diagram:
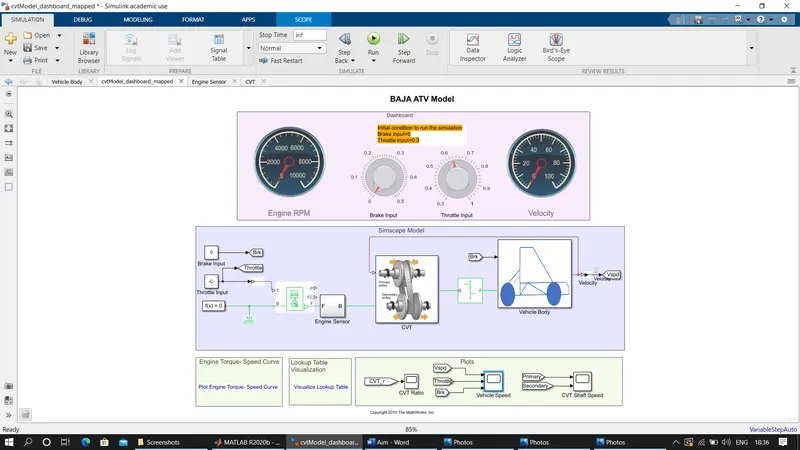
The whole system arrangement is same as above but the difference is only an Input can be given in real time with the help of Knob and output can be observe graphically using circular gauge.
Here real time data of brake and throttle input is given using Knob and in that knob minimum and maximum limit is set for the given system.
- Result Analysis:
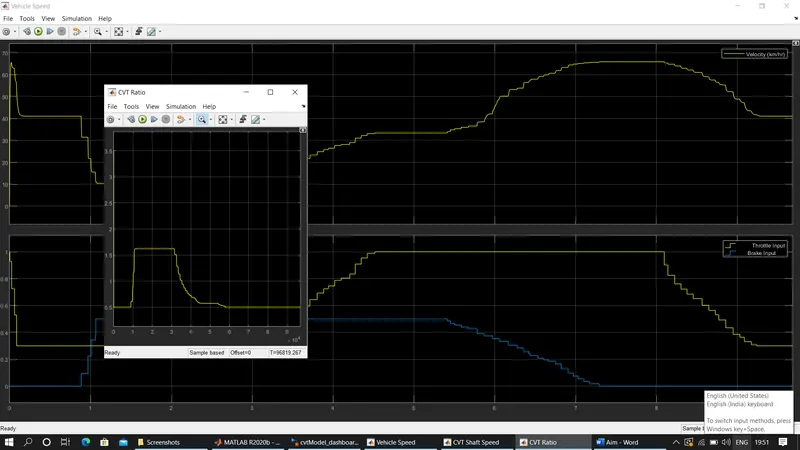
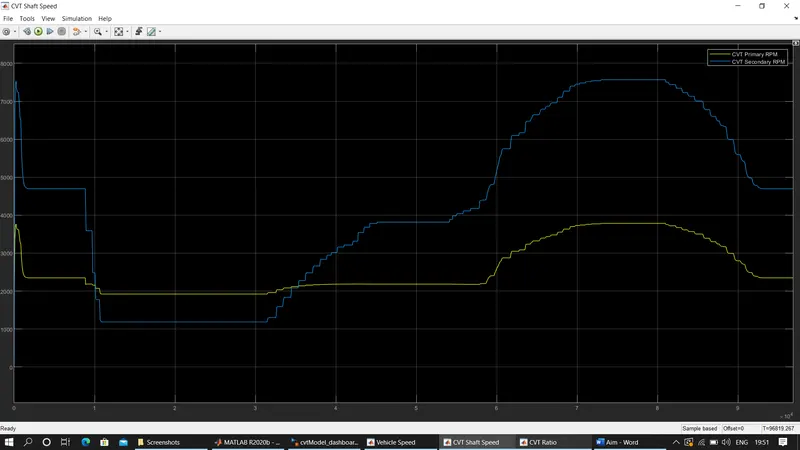
As throttle position is variate or more than zero the engine RPM variates according to that. Here the engine RPM is also disturbed through a brake input during a real time simulation.
From the graphical representation and graph it can be seen that higher RPM in engine can be achieved through setting the value of throttle position near to the 1 or lowering the value of brake input on to the vehicle system.
At first, the speed of the vehicle is higher and the value of throttle input is at maximum and brake input is at minimum. At this point the gear ratio is also very less around 0.5 due to this vehicle has a very higher speed.
After decreasing the throttle value to its minimum, the speed of the vehicle is decreasing but it is not going to be zero as the value of throttle is also not zero. It is constant at the speed 40 km/hr until 1 sec.
When brake is also applied to the vehicle, speed is now decreasing up to its minimum 10 km/hr. at this time gear ratio is also higher nearly up to 2 because during this situation torque requirement is more than the velocity so, the higher gear ratio gives more torque to the vehicle.
Again, when we apply more throttle to vehicle speed will increase and gradually gear ratio is decreasing up to 0.7 but still the value of brake input is higher so vehicle not at its highest speed.
At zero input value of brake and highest input value of throttle, maximum speed of vehicle is 65 km/hr and the gear ratio at this point is 0.5 which is possibly a lowest for this transmission system that we can see from the given graph.