Project 12
Project_12 : Real-time Video Motion Tracking using Optical Flow and OpenCV with Tkinter GUI
Aim: The aim of this project is to develop a real-time video motion tracking system using optical flow and OpenCV, with a user-friendly graphical interface to display the results.
Here is the code
Importing Libraries
import cv2
import numpy as np
from tkinter import *
from PIL import Image, ImageTk
Defining optical_flow() function
#Lucas Kanade optical flow
def optical_flow(old_gray, frame_gray):
    flow = cv2.calcOpticalFlowFarneback(old_gray, frame_gray, None, 0.5, 3, 15, 3, 5, 1.2, 0)
    return flow
- This function calculates the optical flow between two gray scale image using 'cv2.calcOpticalFlowFarnerback() function.
- The performance of the algorithm can be afftected by the values of the parameters passed to the function,including the scale factor(0.5),number of pyramid layer(3),window size(15) ,number of iterations(3) ,size of pixel neighborhood(5) and standrad deviation of gaussian(1.2).
- In above a smaller scale factor will result in a more accurate flow calculation, but it will be slower and vice versa.
- For all other parametesrs by increasing the values of these parameters accuracy increases but it will also be slower.
- So in general we can say performance of this optical flow algorithm depends on specific requirement of the application and the trade-off between accuracy and speed.
- Performance is also depend on the quality of the input images and how much motion is present in the scene.
Defining utility function
def on_entry_click(event):
    "function that gets called whenever entry1 is clicked"
    input_source.delete(0, END)

def stop():
    global stop_clicked
    stop_clicked = True
Defining start function
def start():
    global stop_clicked
    stop_clicked = False

    # Get the input source from the user
    source = input_source.get()

    # Check if the source is a webcam or a video file
    if source == "0":
        source = int(source)
        cap = cv2.VideoCapture(source)
    else:
        cap = cv2.VideoCapture(source)
        if not cap.isOpened():
            print("Error opening video file")
            return

    # Initialize the First Frame
    ret, old_frame = cap.read()
    old_frame = cv2.resize(old_frame, (720,480))

    old_gray = cv2.cvtColor(old_frame, cv2.COLOR_BGR2GRAY)

    while True:
        ret, frame = cap.read()
        frame = cv2.resize(frame, (720,480))

        if not ret:
            break
        if stop_clicked:
            break

        frame_gray = cv2.cvtColor(frame, cv2.COLOR_BGR2GRAY)

        #..//Converting Optical Flow to HSV Image and Normalizing Magnitude//..

        #Compute optical flow between previous and current frame
        flow = optical_flow(old_gray,frame_gray)
        #Create HSV image with same shape as frame
        hsv = np.zeros_like(frame)
        #Set saturation channel to 255
        hsv[..., 1] = 255
        #Convert flow to polar coordinates and extract magnitude and angle
        mag, ang = cv2.cartToPolar(flow[..., 0], flow[..., 1])
        #Set hue channel to angle of flow (scaled by 180/pi/2)
        hsv[..., 0] = ang * 180 / np.pi / 2
        #Normalize magnitude of flow and set value channel to normalized magnitude
        hsv[..., 2] = cv2.normalize(mag, None, 0, 255, cv2.NORM_MINMAX)
        #Convert HSV to BGR
        bgr = cv2.cvtColor(hsv, cv2.COLOR_HSV2BGR)

        #..//Processing and Visualizing Optical Flow on Video Frame //--
        #extract height and width
        h, w = frame.shape[:2]
        #step size for vectors
        step = int(max(h, w) / 100)
        #Create grid of x and y coordinates with step size
        y, x = np.mgrid[step/2:h:step, step/2:w:step].reshape(2,-1).astype(int)
        #Extract x and y components of flow for grid of coordinates
        fx, fy = flow[y, x].T
        #Stack x, y, x+fx, y+fy to form lines
        lines = np.vstack([x, y, x+fx, y+fy]).T.reshape(-1, 2, 2)
        #Round lines to nearest integer
        lines = np.int32(lines + 0.5)
        #Draw lines on frame
        lines = cv2.polylines(frame, lines, 0, (0, 255, 0))

       #Displaying Optical Flow and Original Frame in GUI

        flow_pil = Image.fromarray(bgr)
        flow_tk = ImageTk.PhotoImage(flow_pil)
        output_label.configure(image=flow_tk,width=720, height=480)
        output_label.image = flow_tk

        orig_frame_pil = Image.fromarray(lines)
        orig_frame_tk = ImageTk.PhotoImage(orig_frame_pil)
        input_label.configure(image=orig_frame_tk,width=720, height=480)
        input_label.image = orig_frame_tk

        root.update()
        # Update the previous frame
        old_gray = frame_gray

        # Exit if the user pressed the 'q' key
        if cv2.waitKey(1) == ord('q'):
            break

    cap.release()
    cv2.destroyAllWindows()
- The function starts by initializing a global variable stop_clicked to False.because if you place the stop_clicked global variable as True at the start of the function, the while loop in the start() function would immediately exit, and the function would not process any video frames or compute any optical flow.
- Then by using input_source.get() method it gets input source and checks source (i.e webcam,video file).
- If the source is "0", it sets the source as an integer 0, creates a cv2.VideoCapture() object with the source, and starts capturing video.
- If the source is not "0", it creates a cv2.VideoCapture() object with the source and checks if the video file is opened successfully. If not, it prints an error message and returns.
- Then it read first frame and preorocess it by resizing and converting it into gray scale.
- Then function enters a while loop, where it reads the next frame and resizes it.
- Here we have given option to stop video, if stop_clicked = True the video ends, the loop breaks.
- Converting Optical Flow to HSV Image and Normalizing Magnitude
-
#Compute optical flow between previous and current frame flow = optical_flow(old_gray,frame_gray) #Create HSV image with same shape as frame hsv = np.zeros_like(frame) #Set saturation channel to 255 hsv[..., 1] = 255 #Convert flow to polar coordinates and extract magnitude and angle mag, ang = cv2.cartToPolar(flow[..., 0], flow[..., 1]) #Set hue channel to angle of flow (scaled by 180/pi/2) hsv[..., 0] = ang * 180 / np.pi / 2 #Normalize magnitude of flow and set value channel to normalized magnitude hsv[..., 2] = cv2.normalize(mag, None, 0, 255, cv2.NORM_MINMAX) #Convert HSV to BGR bgr = cv2.cvtColor(hsv, cv2.COLOR_HSV2BGR) - In above snippet in first line calling optical_flow() function, which calculate the optical flow between current frame and previous frame.
- Then It converts the flow to polar coordinates, normalizes the magnitude and convert to BGR.
- Processing and Visualizing Optical Flow on Video Frame
-
#extract height and width h, w = frame.shape[:2] #step size for vectors step = int(max(h, w) / 100) #Create grid of x and y coordinates with step size y, x = np.mgrid[step/2:h:step, step/2:w:step].reshape(2,-1).astype(int) #Extract x and y components of flow for grid of coordinates fx, fy = flow[y, x].T #Stack x, y, x+fx, y+fy to form lines lines = np.vstack([x, y, x+fx, y+fy]).T.reshape(-1, 2, 2) #Round lines to nearest integer lines = np.int32(lines + 0.5) #Draw lines on frame lines = cv2.polylines(frame, lines, 0, (0, 255, 0)) - h, w = frame.shape[:2] this code extract the height and width of frame,then in next line calculate step size
- y, x = np.mgrid() creates a mesh grid with the step size, this grid is a 2D array containing x and y coordinates at which the optical flow vectors will be computed.
- In next line of code it extracts x,y components of the flow for the grid of coordinates,stack them to form lines.
- Nextt code use vstack() function to stack the x and y coordinates, and their corresponding x+fx and y+fy, which are the endpoint of the optical flow vectors, into a single array.
- Then cv2.polylines() used to draw the lines on the frame.
Displaying Optical Flow and Original Frame in GUI
#Displying optical flow in GUI
 flow_pil = Image.fromarray(bgr)
 flow_tk = ImageTk.PhotoImage(flow_pil)
 output_label.configure(image=flow_tk,width=720, height=480)
 output_label.image = flow_tk

 orig_frame_pil = Image.fromarray(lines)
 orig_frame_tk = ImageTk.PhotoImage(orig_frame_pil)
 input_label.configure(image=orig_frame_tk,width=720, height=480)
input_label.image = orig_frame_tk- It converts the Optical flow and original frame from numpy array to PIL image, then it converts the PIL image to a PhotoImage that can be used with Tkinter's Label widget.
Creating GUI for Optical Flow Dashboard
#Initialize a new GUI window
root = Tk()
#root.attributes("-fullscreen", True)

root.configure(bg='#1F3F49') #set background
root.geometry("2560x1440")   #set window size
root.title("Optical Flow Dashboard") # set title of window

#creates a new Entry widget for the user to enter the input source,such as a webcam or a video file.
input_source = Entry(root)

input_source.insert(0, "video_source") #initial text appear in entry widget
input_source.grid(row=0, column=0,sticky="ne",columnspan=2, padx=600,pady=10) # sets the position of entry widget
input_source.bind('<FocusIn>', on_entry_click) # it is called when user click on entry widget and clear initial text.

start_button = Button(root, text="Start", command=start) #create start button
start_button.grid(row=0, column=1,sticky="ne", padx=60, pady=10) # set position of start button

stop_button = Button(root, text="Stop", command=stop) #create stop button
stop_button.grid(row=0, column=1,sticky="ne", padx=5, pady=10) #set stop button position

quit_button = Button(root, text="Quit", command=root.destroy) #create quit button
#quit_button.grid(row=2, column=0, columnspan=2, pady=10)
quit_button.grid(row=0, column=2, sticky="ne", padx=10, pady=10) # position of quit button

#creating Label widget
input_label = Label(root) # create new input label for displying images or video
input_label.grid(row=2,column=0,padx=20,pady=10,columnspan=1) # position of input label

output_label = Label(root) # create new output label for displaying image or video
output_label.grid(row=2, column=1,padx=10, pady=10,columnspan=1) #set position of label

root.rowconfigure(0, weight=1)
root.rowconfigure(1, weight=1)
root.rowconfigure(2, weight=1)
root.rowconfigure(3, weight=5)
root.columnconfigure(0, weight=5)
root.columnconfigure(1, weight=5)

root.mainloop() # Run GUI loop
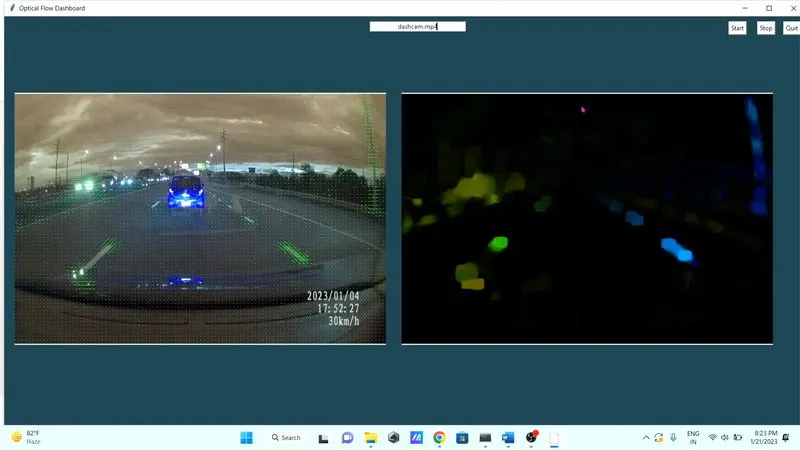
- The above code can be titled as "Creating GUI for Optical Flow Dashboard".
- It sets up a new GUI window using Tkinter, sets the window size and title, creates input fields, buttons, and labels for the user to interact with.
- It also sets the layout of the widgets using grid() and rowconfigure() and columnconfigure() function.
- Finally, it starts the GUI loop using the mainloop() function.
Dashboard