Project-1: Powertrain for aircraft in runways
Part A:
1. Search and list out the total weight of various types of aircrafts.
Solution: The aircraft gross weight is the total weight at any moment during the flight or ground operation. An aircraft gross weight decreases durig a flight due to fuel and oil consumption. It may varies during a flight due to payload dropping or in fight refueling. At the moment of releasing its brakes, the gross weight of an aircraft is equal to its takeoff weight. From Manufacturing to commissioning and from On the Ramp to Takeoff there are huge variations in the weight and balance of an aircraft. It varies significantly, so striking a correct balance with all loads on an aircraft is significantly important. The following figure shows the maximum takeoff weight of an aircraft.
Prerequisites:
- Weight of a male person = 88kg(avg)
- Weight of a female person = 70kg(avg)
- Weight of a children (2-12)years = 35kg(avg)
- Weight of cabin crew = 75kg (including 3kg of crew baggage)avg
- Weight of fuel in aircraft can be approximated as approx 12000kgs for 4000km by an narrow body aircraft (A-320)
- Payload - Passengers, Cargo, Mail, Baggage.(mainly).
Aircraft authorised gross weight limits are laid down in the Aircraft manuals(AFM). Those limits may be equal to or lower than the structural design weight limits. The authorised weight limits are choose by the airine and they are referred to as the purchased weights. An operator may purchase a certified weight below maximum design weights because many of the airport operating fees are based on the aircraft AFM maximum allowable weight values. An aircraft purchase is, typically a function of the certified weight purchased. An AFm will often include,
- V speeds
- aircraft gross weight
- Maximum ramp weight
- Maximum takeoff weight
- Manufacturers empty weight
- operating empty weight
- Centre of gravity limitations
- Zero fuel weight
- Take off distance
- Landing distance.
Lets discuss about the weights of an aircraft one by one,
Manufacturers Empty Weight(MEW): It is the weight of the aircraft as built and includes the weight of the structure, power plant(engines), furnishings, installations, systems and other equipment that are considered an integral part of tn aircraft.
Zero Fuel Weight(ZFW): This is the total weight of the airplane and all its contents including unstable fuel (unstable fuel is the fuel which is required to maintain the structural stability of the aircraft, especially wings). but excludingg the total weight of the usable fuel on board (usable fuel is the fuel necessary for the flight). Here is a point to be noted that as a flight progresses and fuel is consumed, the tota weight of the airplane reduces, but the ZFW remains constant.
Operational Empty Weight(OEM) or Dry Operating Weight(DOW): It is the basic weight of an aircraft including the crew, all fluids necessary for operation,(such as engine oil, engine coolant, water, unuable fuel) all operator items and equipment required for flight but excluding usable fuel and the payload.
Maximum Zero Fuel Weight(MZFW): Maximum zero fuel weight is the maximum weight allowed before usable fuel and other specified usable agents (engine injection fluid, and other consumable propulsion agents) are loaded. or it can also say that OEM/DOW + Payload = MZFW.
Maximum Taxi Weight(MTW) or Maximum Ramp Weight(MRW): It is the maximum permitted weight of the aircraft at which it may be moved on the ground either with its own engine or towed by a tractor. It can also be defined as maximum weight for ground maneuvering including the weight of run up and taxi fuel. Which can be write as MZFE+Ramp fuel = MRW.
Maximum Take Off Weight(MTOW): It is the maximum permitted weight at the start of the take off. While determining this limit, the manufacturer takes into consideration the strength of the material used for the manufacturing of the aircraft and standard performance variables such as runway temperature, altitude, atmospheric pressure, wind components, flaps, etc. Which is written as MZFW+Take off fuel = MTOW. In operation MTOW is may be limited to vaues less than MTW.
Regulated Take Off Weight(RTOW): As told in the above definition depending on different factors; ex. flap setting, altitude, air temperature, length of runway), RTOW or maximum permissible takeoff weight varies for each takeoff. It can never be higher than MTOW.
Maximum Landing Weight(MLW): When aircraft touches the ground it puts force of the runway as well as on the tyres and under carriage, so to ensure structural safety of the aircraft MLW is taken into consideration. MAnufactures have calculate this force to be approximately 9 times the weight of the aircraft. Thus when the aircraft has to make an emergency landing or when the weight of the aircraft before landing exceeds the MLW defined by the manufacturer the pilots dump fuel to reduce the weight of the aircraft. Where it can be written as MTOW-Trip fuel = MLW.
All Up Weight(AUP): It can be written as DOW + Payload + Fuel.
The following table shows the different types of Aircrafts weights,
Where MTOW = Maximum Take Off weight and MLW = Maximum Landing Weight.
| Type of Aircraft | MTOW [kg] | MLW [tonnes] |
|---|---|---|
| Antonov An-225 | 640,000 | 591.7 |
| Scaled Composites Model 351 Stratolaunch | 589,670 | |
| Airbus A380-800[1][2][3] | 575,000 | 394 |
| Boeing 747-8F | 447,700 | 346.091 |
| Boeing 747-8 | 443,613 | 306.175 |
| Boeing 747-400ER | 412,770 | 295.742 |
| Antonov An-124-100M | 405,060 | 330 |
| Boeing 747-400 | 396,900 | 295.742 |
| Lockheed C-5 Galaxy[4][5][6] | 381,000 | 288.417 |
| Boeing 747-200[7] | 377,840 | 285.700 |
| Boeing 747-300[7] | 377,840 | 260.320 |
| Airbus A340-500[8] | 371,950 | 240 |
| Airbus A340-600[8] | 367,400 | 256 |
| Boeing 777F | 347,800 | 260.816 |
| Boeing 777-300ER | 351,800 | 251.29 |
| Boeing 777-200LR | 347,450 | 223.168 |
| Boeing 747-100[7] | 340,200 | 265.300 |
| Airbus A350-1000 | 308,000 | 233.5 |
| Boeing 777-300 | 299,370 | 237.683 |
| Boeing 777-200ER | 297,550 | 213.00 |
| Airbus A340-300[8][9] | 276,700 | 190 |
| McDonnell Douglas MD-11 | 273,300 | 185 |
| Airbus A350-900 | 270,000 | 175 |
| Ilyushin Il-96M | 270,000 | 195.04 |
| McDonnell Douglas DC-10 | 256,280 | 183 |
| Boeing 787-9[10] | 254,000 | 192.777 |
| Boeing 787-10[10] | 254,000 | 201.849 |
| Airbus A340-200[8][11] | 253,500 | 181 |
| Airbus A330-900 | 251,000 | 191 |
| Ilyushin IL-96-300 | 250,000 | 175 |
| Airbus A330-300[12][13] | 242,000 | 185 |
| Airbus A330-200[12][13] | 242,000 | 180 |
| Lockheed L-1011-500 | 231,300 | 166.92 |
| Boeing 787-8[10] | 228,000 | 172.365 |
| Lockheed L-1011-200 | 211,400 | |
| Ilyushin IL-86 | 208,000 | 175 |
| Boeing 767-400ER | 204,000 | 158.758 |
| Airbus A300-600R[14] | 192,000 | 140 |
| Boeing 767-300ER | 187,000 | 136.08 |
| Concorde | 185,000 | 111.1 |
| Airbus A300-600[14] | 163,000 | 138 |
| Boeing 767-300 | 159,000 | 136.078 |
| Airbus A310-300[14] | 157,000 | 124 |
| Vickers VC10 | 152,000 | 151.9 |
| Boeing 707-320B[15] | 151,000 | 97.5 |
| Boeing 707-320C[15] | 151,000 | 112.1 |
| Douglas DC-8-61 | 147,000 | |
| Airbus A310-200[14] | 142,000 | 123 |
| Airbus A400M | 141,000 | 122 |
| Douglas DC-8-32 | 140,000 | |
| Douglas DC-8-51 | 125,000 | |
| Boeing 757-300 | 124,000 | 101.6 |
| Boeing 707-120B[15] | 117,000 | 86.3 |
| Boeing 757-200 | 116,000 | 89.9 |
| Boeing 720B[16] | 106,000 | 79.5 |
| Boeing 720[16] | 104,000 | 79.5 |
| Tupolev Tu-154M | 104,000 | 80 |
| Tupolev Tu-204SM | 104,000 | 87.5 |
| Convair 880 | 87,500 | |
| Boeing 737-900 | 85,000 | 66.36 |
| Boeing 737-900ER | 85,000 | 71.35 |
| Boeing 727-200 Advanced[17] | 84,000 | 70.1 |
| Airbus A321-100[18] | 83,000 | 77.8 |
| Boeing 737-800 | 79,000 | 65.32 |
| Boeing 727-200[17] | 78,000 | 68.1 |
| McDonnell-Douglas MD-83 | 73,000 | 63.28 |
| Boeing 727-100[17] | 72,500 | 62.4 |
| Boeing 727-100C[17] | 72,500 | 62.4 |
| McDonnell-Douglas MD-90-30 | 71,000 | 64.41 |
| de Havilland Comet 4 | 70,700 | |
| Boeing 737-700 | 70,000 | 58.06 |
| Airbus A320-100[18] | 68,000 | 66 |
| Boeing 737-400 | 68,000 | 54.9 |
| de Havilland Comet 3 | 68,000 | |
| Boeing 377 | 67,000 | |
| Boeing 737-600 | 66,000 | 54.66 |
| Airbus A220-300 | 65,000 | 57.61 |
| Hawker Siddeley Trident 2E | 65,000 | |
| Airbus A319[18] | 64,000 | 62.5 |
| Boeing 737-300 | 63,000 | 51.7 |
| Boeing 737-500 | 60,000 | 49.9 |
| Airbus A220-100 | 59,000 | 50.80 |
| Airbus A318[18] | 59,000 | 57.5 |
| Boeing 717-200HGW | 55,000 | 47.174 |
| Douglas DC-7 | 55,000 | |
| de Havilland Comet 2 | 54,000 | |
| Boeing 717-200BGW | 50,000 | 46.265 |
| de Havilland Comet 1 | 50,000 | |
| Douglas DC-6A | 48,600 | |
| Douglas DC-6B | 48,500 | |
| Embraer 190[19] | 48,000 | 43 |
| Caravelle III | 46,000 | |
| Fokker 100 | 46,000 | 39.95 |
| Douglas DC-6 | 44,000 | |
| Avro RJ-85 | 42,000 | 36.74 |
| Handley Page Hermes | 39,000 | |
| Embraer 175[20] | 37,500 | 32.8 |
| Bombardier CRJ900[21] | 36,500 | 33.345 |
| Embraer 170[22] | 36,000 | 32.8 |
| Bombardier CRJ700 | 33,000 | 30.39 |
| Douglas DC-4 | 33,000 | |
| Vickers Viscount 800 | 30,400 | |
| Bombardier Q400 | 28,000 | 28.01 |
| Bombardier CRJ200 | 23,000 | 21.319 |
| ATR 72-600 | 22,800 | 22.35 |
| Saab 2000 | 22,800 | 21.5 |
| Embraer ERJ 145 | 22,000 | 19.3 |
| ATR 42-500 | 18,600 | 18.3 |
| Saab 340 | 13,150 | 12.930 |
| Embraer 120 Brasilia | 11,500 | 11.25 |
| BAe Jetstream 41 | 10,890 | 10.570 |
| Learjet 75[23] | 9,752 | 8.709 |
| Pilatus PC-24[24] | 8,300 | 7.665 |
| Embraer Phenom 300[25] | 8,150 | 7.65 |
| Beechcraft 1900D | 7,765 | 7.605 |
| Cessna Citation CJ4[26] | 7,761 | 7.103 |
| de Havilland Hercules | 7,000 | |
| Embraer Phenom 100 | 4,800 | 4.43 |
2. Is there any difference between ground speed and air speed?
Solution: The following definations are important to know before going to the differences,
Ground Speed: Ground speed is the horizontal speed of an aircraft relative to the earth surface. It is vital for accurate navigation that the pilot has an estimate of thr ground speed that will be achieved during each leg of a flight. An aircraft driving vertically would have a ground speed of zero. It ca be determined by the vector sum of the aircrafts true airspeed and the current wind speed and direction, a headwing substracts from the ground speed, while a tailwind adds to it. Groundspeed radar can measure the ground speed directly.
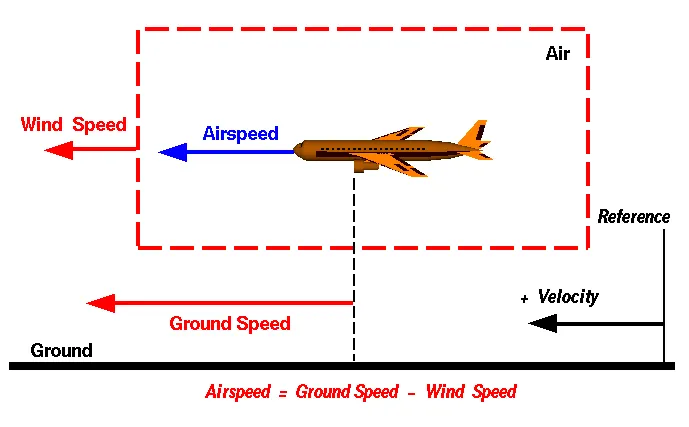
Air Speed: The important quantity in the generation of lift is the relative velocity between the aircraft and the air is called Airspeed. It is also the speed at which the air is flowing around the aircrafts wings. Airspeed cannot be measured directly from the ground position, but must be computed from the groundspeed and the wind speed. Airspeed is the vector difference between the ground speed and wind speed. An airspeed indicator indicates the aircrafts speed relative to the air mass. The air mass may be moving over the ground due to wind and therefore some additional means to provide position over the ground is required.
Airspeed = Ground Speed - Wind speed
On a perfectly still day, the airspeed is equal to the ground speed. But if the wind is blowing in the same direction that the aircraft is moving, the airspeed will be less than the ground speed.
The following figure shows the indication of ground speed an airspeed of an aircraft.
Differences between Airspeed and Ground speed:
- Ground speed is quite different from the airspeed. When an aircraft is airbone the ground speed does not determine when the aircraft will stall, and it den't influence the aircraft performanace such as rate of climb.
- While Airspeed is what determines whether there is enough airflow around an aircraft to make it fly, ground speed is what determines how fast an aircraft will get to its destination.
- Ground speed is the aircraft's speed relative to the surface of the earth, airspeed is its speed relative to the air it is flying in.
- Ground speed is easily accurately determinable using GPS. AIrpseed is more complicated because it can't be directly computed from sensor data, what we get is something called indicated airspeed which is adjusted for instrument error, prooduuces calibrated airspeed.
- Without wind both these speeds would be equal. In some light aircraft on very windy days it is literally possible to hover over a spot on the ground or even to be pushed backwards, if the headwind is strong enough.
3. Why is it not recommended to use aircraft engine power to move it on the ground at Airport?
Solution: The term Aircraft ground running is usually used to describe the operation of some or all the engines of an aircraft, whilst on the ground, for the purpose of functionally checking the operation of either engines or aircraft systems. This usually takes place prior to the release to service of an aircraft from maintainance. Ground running may e carried out either prior to, during or after the rectification of a defect or scheduled work on an engine or an aircraft system, when this requires engined to be operating in order to asses its function. Although the aircraft may need to be taxied or towed to an approved ground running position under a clearance from ATC, most operators and maintainance organisations do not require pilots to be on board because aircraft technicians can be trained and approved for these duties.
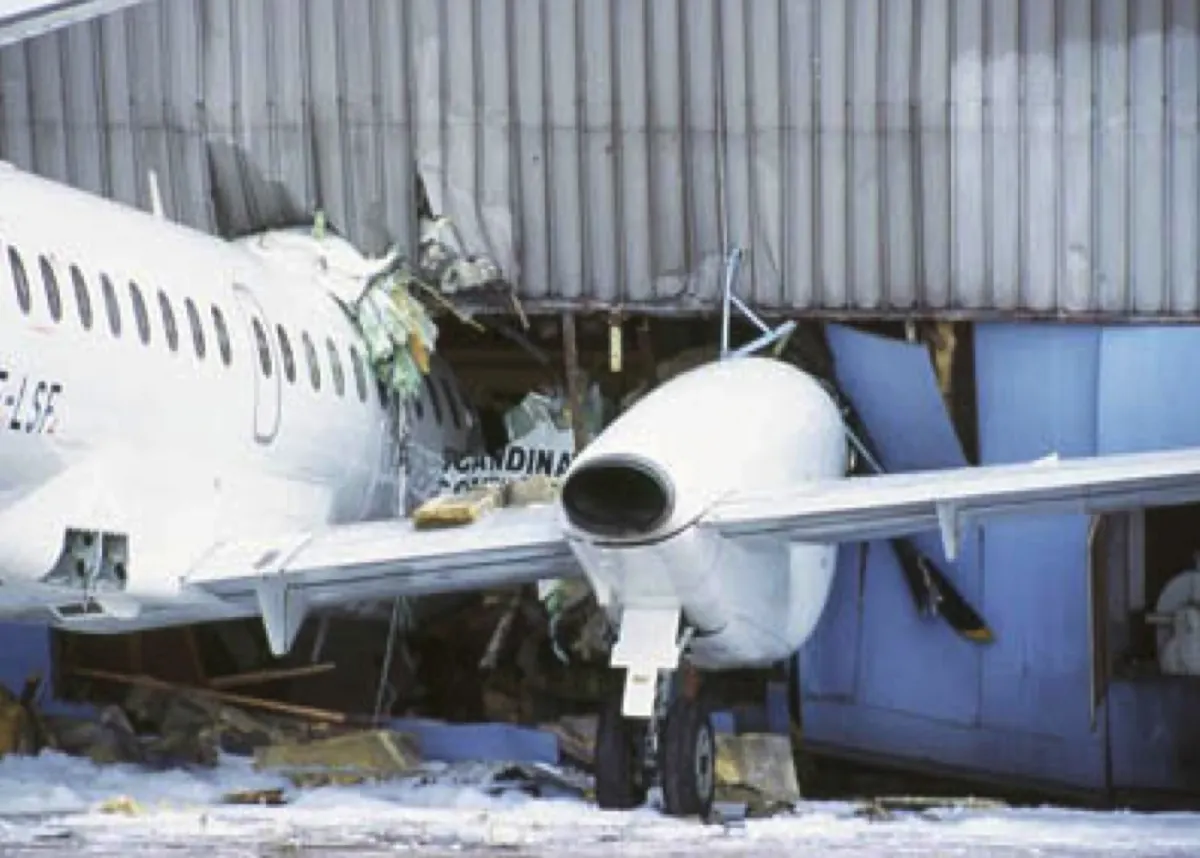
Risk to operational Safety: The risk which may arise from engine ground running relate to the potential for loss of control of the aircraft by those persons occupying the pilot seats in the flight deck. The consequences of loss of control during taxi or towing are the same as apply to these operations generally and the riks araising from the static running of one or more aircraft engines. Unwanted consequences from such static running are mainly related to those arising from the unintended movement of the aircraft during engine running effectively a loss of control, especially during high power engine running. Damage can occur to the aircraft itself, other aircraft nearby or to airside structures. In addition there is a risk of injury to ground support personnel who may be in relatively close proximity to the aircraft.
Overall risk mitigation: The best form of overall mitigation is to ensure that all persons authorised to supervise or directly participate in engine ground from the flight deck, who are not pilots or flight engineers currently rated on the specific aircraft type, are in receipt of suitable intial running and that there is a proper system for both intial and recurrent qualification for engine ground running duties. The task of engine groung running should be seen as part of a broader group of aircraft groung movement tasks which can carried out under the control of flight deck occupants other than type rated flight crew.
4. How an aircraft is pushed to runway when its ready to take off?
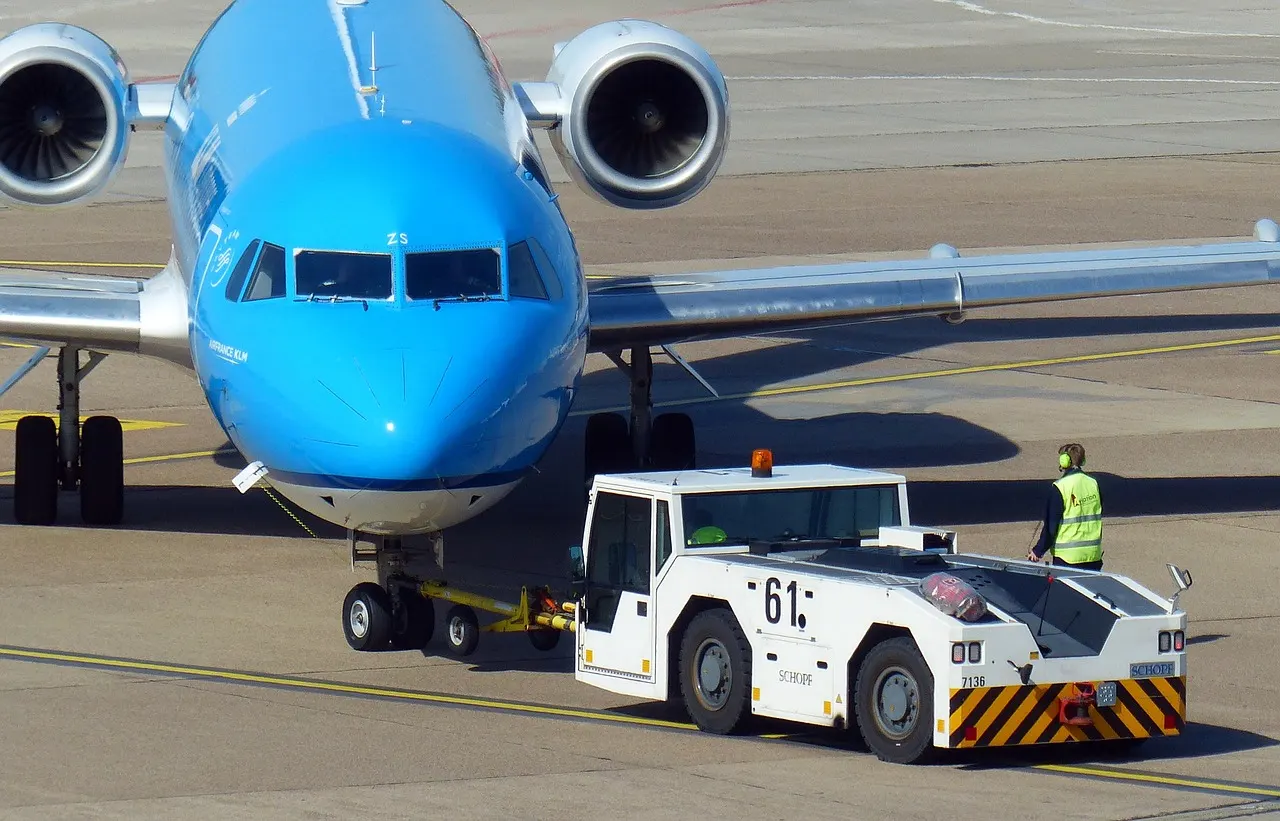
Solution: Pushback means the movement of an aircraft from a nose in parkiing stand using the power of a specialised ground vehice attached to or supporting the nose landing gear. It is commonly the second part of a Taxi In Push Out(TIPO) procedure at airport terminal gates and will be necessary to depart from all except self manoeuvring parking stands unless the aircraft type is capable of powerback and local procedures allow this. Occasionally a pushback may need to be followed by an engines running pull forward to a position where local procedures allow aircraft to move forward under their own power, but ususally ground vehicle disconnection will occur after the completion of a pushback.
Procedure: Once the aircraft commander has given their confirmation of brakes released to the person in charge of the ground crew who are to carry out the pushback, the ground crew become temporarily responisble for the safe manoeuvring of the aircraft in accordance with either promulgated standard procedures or as specifically agreed beforehand. Almost all aircraft types required that the ground locking pin be installed in the nose landing gear during any pushback. However this is now no longer always the case. If a ground locking pin is installed for the pushback, it will need to be removed after the completion of the ground vehicle manoeuvre if the airfact has been pushed back prior to intended flight.
The traditional method of allowing the ground vehicle to move an aircraft is to attach it to the aircraft nose landing gear by means of a towbar. These must be approved for use with s particular aircraft type and clearly marked as such, since there is no universall towbar specification, the same towbar attachment and ground vehicle may also be used for Aircraft towing in the forward direction. An alternative method which is becoming more common for pushback is the use of a specialised vehicle called a towbarless tug. This positions two level arms either side of the aircraft nose landing gear and these are used to engage with the aircraft gear leg and raise it slightly off the ground. These specialised vehicles can also be used to tow aircraft forward.
The responsibilities of the ground crew team carrying out a pusback include ensuring that no part of the aircraft structure will impact any fixed object or other aircraft and my include giving clearance to start one or more engines just before, during or immediately after a pushback. Effective communication between the person in charge in the flight deck and the person in charge of the ground crew and between the members of the ground crew team is critical. The following figure shows the pushback procedure by using tug.
The case of engines running pull forward as a supplementary action prior to ground vehicle disconnection after a pushback should be considered as part of the pushback procedure and trained accordingly since it bears little practical resemblance to the towing for longer distances of empty out of service with engines stopped. Engines starts ay be routinely accomplished immediately before or during pushback. Many aircraft operators require that when pushback is accomplished without headset communications, engine starts do not take place whilst the aircraft is being pushed, preferring instead to require that engine starting takes place before or after completion of the pushback.
For smaller aircraft, the pushback tug doen't require a massive amount of power. They utilize the weight of the tug, sometimes up to 60tons, to ensure that the wheels don't just spin on the tarmac. We connect a tow bar at the aircraft first and then at the tug. It takes skill to push an aircraft back using these types of tug, you have two steering axis at the nose gear and at the tug where the tow bar is connected. So when you steer right, the nose of the aircraft goes opposite. However with bigger aircraft, tug designers ran intoa problem. Even with a 60-ton tug, there isn't enough weight to stop the tug wheels spinning. To get round this problem, needed something weigh the tug down. Something like the weight of a 560-ton A380. Tow barless tugs clamp around the nose wheel of the aircraft and lift it up, thus utilizing the weight of the aircraft to provide the traction for its wheels. It needs between 40 and 90 seconds to connect the tug with the aircraft and lift it up.
5. Learn about take off power, tyre design, rolling resistance, tyre pressure, brake forces when landing.
Solution:
TAKE OFF POWER: Take off is the phase of flight in which an aircraft leaves the ground and becomes airbone. For aircraft travelling vertically then it is known as Liftoff. For aircraft that take off horizontally, this usually involves starting with a transition from moving along the ground on a runway. For light aircraft, usually full power is used during takeoff. Large aircraft may use a reduced power for takeoff, where less than full power is applied in order to prolong engine life, reduce maintenance costs and reduce noise emissions. In some emergenncy cases, the power used can then be increased to increase the aircrafts performance.
The amount of power that an engine is allowed to produce for a limited period of time for takeoff. The use of takeoff power is usually limited to 5min for reciprocating engines and upto 2½ minutes for gas turbine engines. This may not always be the case. Specifically with respect to reciprocating engines, it is the brake horsepower developed under stndard, sea level conditions and under the maximum conditions of the crankshaft rotational speed and the engine manifold pressure approved for the normal takeoff. It is limited in continuous use to the period of time shown in the approved engine specifications. With respect to gas engines, it is the thrust developed under static conditions at a specified altitude and atmospheric conditions of the rotor shaft rotational speed and gas temperature approved for thr normal takeoff. It is limited in continuous use to the period of time shown in the approved engine specifications. Following figure sows the take off of an aircraft.
TYRE DESIGN: The tyres fitted to an aircraft are designed to support the full weight of that aircraft while on the ground, as well as the static and dynamic loads generated while landing, take off, taxing and parking, When it comes to safety tyres are one of the most important components of aircraft. They help to absorb the shock of landing and provide cushioning. It also provides traction for braking and stopping of an aircraft. The tyre is only part of the aircraft in contact with the ground, and a well maintained set of tyres is crucial to the safe operation of any aircraft. Tyres cushion the impact on touch-down and transfer the enrgy of landing into the wheels.
Classsification: Tyres are classiffies according to their dimensions, strength(ply-rating) and configuration(tubed or tubeless). To ensure safe operation,the correct tyre should always be fitted to a particular aircraft in accordance with the operating manual.
Dimensional classifiction is usually made according to outer tire diameter, sectional width and the diameter of the rim. A common classification system in use today is that of the US Tire and Rim Association, where aircraft tyres are classified as one of nine types. Today 3 tyre classifications cover almost all aircraft classes in use, which use a slightly different way to report the tyre dimensions, they are:
Type III : These tyres are common low pressure general aviation tyres predominantly used on light aircraft with reasonably low landing speeds. These tyres are easily identified as theyhave a small rim diameter in comparison to their width. Type III tyres are designated by a 2 numbber system: the first number describes the nominal tire width and the second, the diameter of the rim that the tyre can be fitted to. The two numbers are seperated by a dash.
Type VII: These tyres are high pressure, high performance tyres fitted to jet aircraft. These tyres are sized according to a 2 number system that differs from the type III classification described above. Here the first number designates the nominal overall diameter of the tyre while the second number, which is seperated from the first by a multipication sign, gives the nominal section width.
Type VIII: These tyres are designated by 3 numbers and incorporate the conventions of both the part III and part VII tyres. The first number specifies the outside diameter, the second number is nominal tyre width, and the third is the rim diameter. These tyres are designed to operate at high pressures and high speeds.
Following figure shows the classification of tyres according to US Tyre and Rim Association.
Ply-Rating: Ply rating provides an indication of the relative strength of the tyre. The strength of early tyres was directly proportional to the number of reinforcing piles present in the design which is how the ply rating system originated. Nowadays the use of modern materials and complex maufacturing techniques have rendered the actual ply count somewhat irrelevant when discussing to the strength of a tyre. However a ply rating system is still used to describe the relative strength of one tyre against another and remains an important indicator of tyre strength.
Tubed or Tubeless: Aircraft tyres are either designed to use an inflatable tube to provide the required pressure or seal directly onto the wheel without a tube. Tuneless tyres are built with an inner lining to prevent air leaks and are stamped with the word tubeless on the sidewall. Tubeless tyres are lighter than tubed tyres and are less susceptible to tyre creep, which occurs when the tyre shift relative to the wheel during a hard impact.
Design and Construction: A tyre follows a layered construction approach where each layer of the tyre serves a different purpose. Broadly speaking, a tyre can be divided into 4 specific regions. They are Bead, Ply, Tread and Sidewall. The following figure shows an aviation tyre is comprised of four elements.
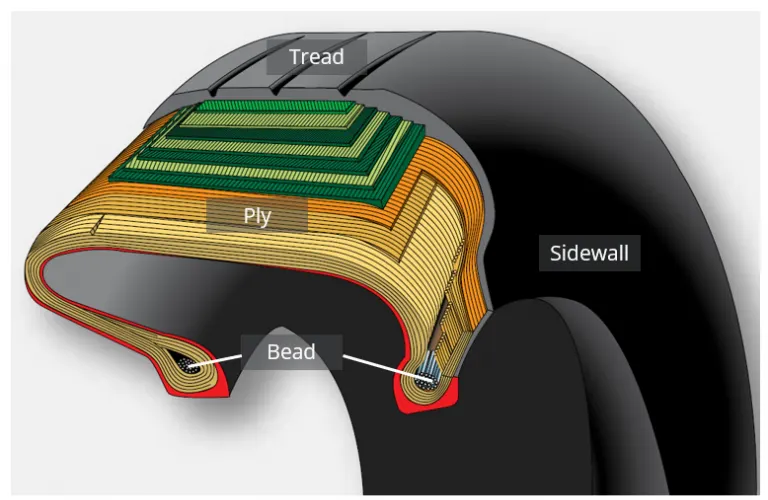
Bead: The bead consists of bundles of high strength steel wire encased in rubber. This provides the tyre with lateral strength, anchoring the structural plies and transferring the impact loads generated in the tyre onto the wheel rim. Tyres are designed to operate at higher speeds and at higher loads may have multiple bundles of beading to effectively transfer the loads and resist the large tyre deformations that result.
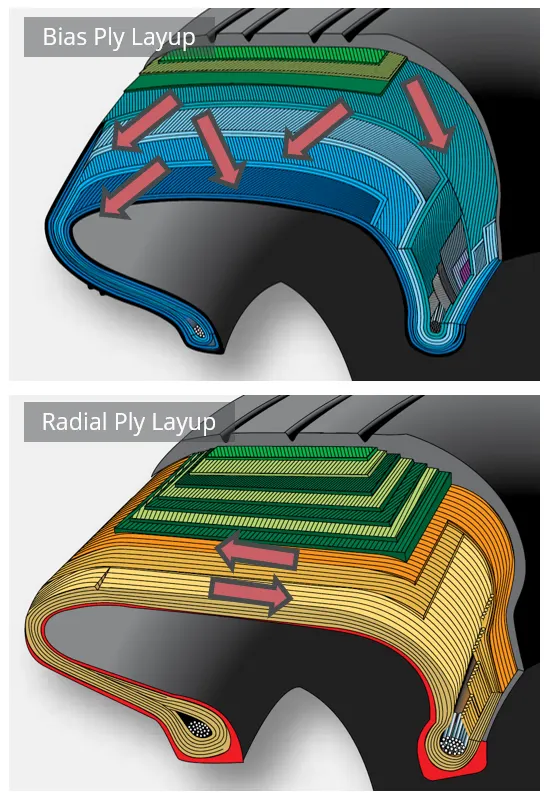
Ply region: A tyre is built from multiple plies(carcass) which are laid on top of each other to give the tyre its struccture and form. Plies are usually manufactured from nylon fabric sandwitched between layers of rubber. These structural members are sometimes called carcass plies as they form the skeleton of the tyre. The concept of ply rating refers to the relative strength of the tyres ply layup. The ends of each ply are anchored to the beading on each side of the tyre to transfer load out the tyre and into the wheel. Piles are characterised according to their orientation relative to the direction of motion of the tyre. Traditionally plies were oriented predominantly in the direction of motion of the tyre with a bias of between 30° and 60°. This is called a bias ply layup as the plies are oriented with a bias to the direction of rotation. Bias plies result in a tyre that is flexible and able to absorb the loads typically seen during landing and take off.
A radial ply layup is one where the plies are laid perpendicular to the direction of motion of the tyre. This results in a stronger tyre, but one that is not able to deflect and flex as much as in a bias ply layup. Aircraft tyres are either comprised of a bias layup or a radial layup which is shown in the following figure.
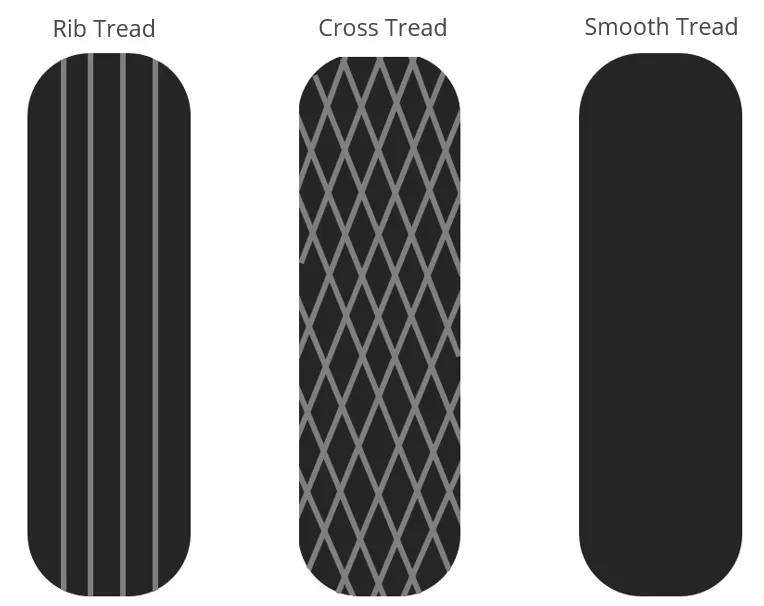
Tread: The tread refers to the wearable part of the tyre that is designed to come into contract with the ground. The tread is located on the tyre crown and must resist frictional wear, abrasion, cracking and cuts that occur as a result of the landing surface and condition of the runway. The tread pattern seen on the tyre differs according to the operational requirements of the tyre. Most tyres are grooved in the circumferential direction which provides good operating characteristics for aircraft generally flown into and out of prepared runways. The grooves that characterize a rib tread tyre assist in cooling the tyre and provide a means for water to channel away from the tyre in wet conditions.
Aircraft operating from unprepared or unpaved surfaces may be fitted with a cross tread pattern. This diamond pattern is cut deep into the tyre and provides more traction that the rib tread design in soft ground. On a hard surface the tyre has a snaller total contact area and so will provide less traction that a tyre with a rib tread. Some older aircraft may have a smooth tread with no ribs or cutouts. This provides the greatest traction, largest contact area and subsequently the greatest frictional force which assists in stopping the aircraft. The following figure shows the common aircraft tyre tread patterns.
Sidewall: The sidewall of a tyre is designed to protect the plies (carcass) that gives the tyre its strength. Information about the tyre like its dimentions, speed rating, ply rating, direction of rotation, manufacturer etc is printed on to the sidewall for easy reference. The inner sidewall is covered by an inner liner which is a thin rubber liner designed to prevent damage to the carcass plies. Small vent in the sidewall are built in to allow traped air in the plies to escape. This helps prevent delaminations between plies from forming as a result of the trapped air expanding due to altitude and temperature changes.
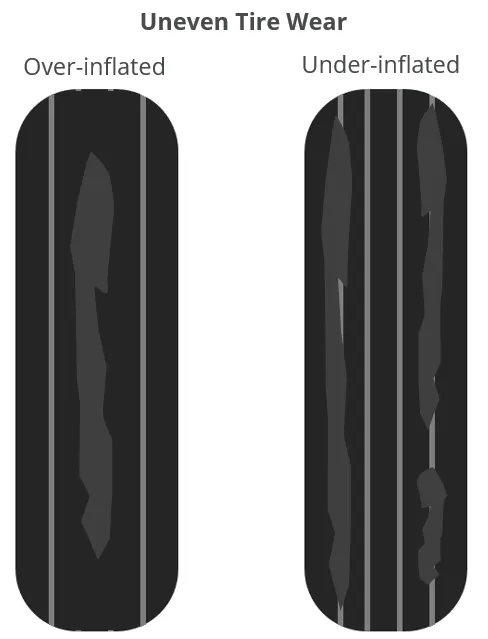
Tire wear: Tyres that are operated at the incorrect inflation pressure result in an uneven tread wear that could be determental to the safety of the tyre. The nature and severity of the wear can alert the pilot as to whether the tyre is over or under inflated. Considerable traction is lost when a tyre has worn beyond its limits and should always be replaced or retreaded rather than left to operate in a poor condition. A tyre that is over-inflated will tend to wear towards the center of the tread. This is because at higher inflations, a smaller area of the tire is in contact with the ground and so wear is highest in this region.nConversely, under-inflated tyres will wear towards the tyre shoulders as the tyre sags onto the ground with a corresponding increase in friction. This can lead to the tyre overheating, damage to the carcass, and the tyre creeping or pinching at the sidewall. Uneven tyre wear is indicative of aircraft operation with incorrect inflation pressures which is shown in the following figure.
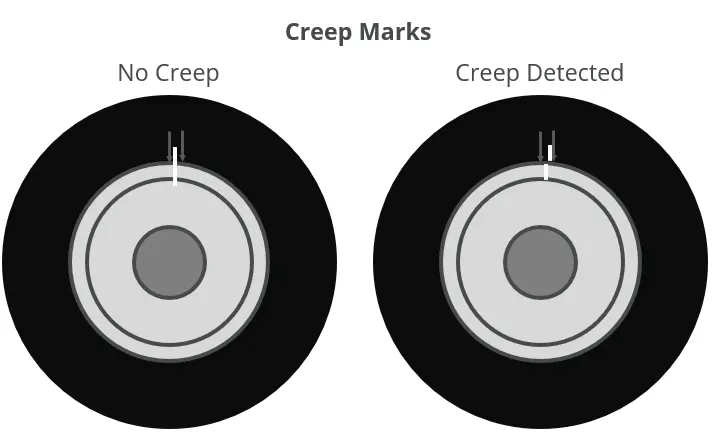
Creep markings: Hard landings and heavy braking, particularly if the tyre is under-inflated, can lead to movement of the tyre relative to the wheel in the direction of rotation. Rotation of the tyre around the rim is referred to as tyre creep or slip and should be avoided. Creep in a tubed tyre is particularly undesirable as this could cause the tube valve to rupture, resulting ina blow out. Tyre creep is often monitored by painting a single white line over the tyre and wheel once the tyre is installed and inflated to the correct pressure. Any slip is easily identified as the line on the tyre and wheel move out of alignment. Acceptable creep limits are established by the tyre manufacturer and often creep markings are moulded into the sidewall between which the line across the wheel and tyre is drawn. Once the alignment moves beyond the limits bounded by the markings, the creep is deemed too severe and must be addressed. Following figure shows the creep marks which are used to detect the tyre and the rim.
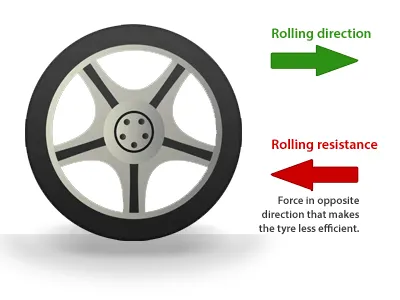
ROLLING RESISTANCE: When taking off from a runway covered with slush, standing water or snow, the required take off ground run distance will be longer than on a dry runway. This is the result of the fact that slush, standing water and snow on the runway will generate a rolling resistance that increases the total resistance on the aircraft during the ground run. Rolling resistance is the combination of forces that work aganist the forward motion of a aircraft. The weight of the aircraft, gravity and inertia, the amount of friction between the tyres and the road surface, and airdrag all play a part.
By considering the measurements of rolling resistence of an aircraft wheel caused by dry snow: The wheel was equipped with a tyre of dimension 12.50-16. The measurements were carried out at a static wheel load of 38.800n and tyre pressures of 410 kpa and 550 kpa. The speed during the measurements was 50 km/h. The rolling resistence increased approximately proportionally with increasing snow depth at a constant tyre pressure. Increased tyre pressure caused a decrease of the rolling resistence. This effect indicates that tyres wiyh high pressure should be used on aircraft wheels when taking off from snow covered areas, even if the load on the wheels does not require tyre pressure. Further more measurements have been carried out of the rolling resistance of a tyre of the dimension 7.50-14 caused by dry snow at different speeds. This tyre is especially intended fot friction measurements(ASTM tyre). These measurements were performed at a static wheel load of 4.800n and at speeds of 50,65 and 80kmph. The rolling resistance increased proportionally with increasing speed within the interval of speed used. The speed dependence of the rolling resistance increased with the snow depth.
Major factors in rolling resistance:
The most significant factors to be considered are,
- Load
- Wheel diameter
- Tread material/hardness
- Floor material/finish
- Floor conditions (roughness, cleanliness, slope, etc.).
Rolling resistance = Coefficient of rolling resistance × (Weight Newton - Lift force)
Rr = µr × (W - FL)
The coefficient of rolling friction during ground roll is a function of weight, lift and resistance force due to the rolling of the aircraft. It is denoted by µr. Rolling resistance (Rr) is the force resisting the motion of rolling body on a surface, Weight Newton(N) is a vector quantity and defined as the product of mass and acceleration acting on that mass and the lift force, lifting force(FL) or simply lift is the sum of all the force on a body that force is to move perpendicular to the direction of flow.
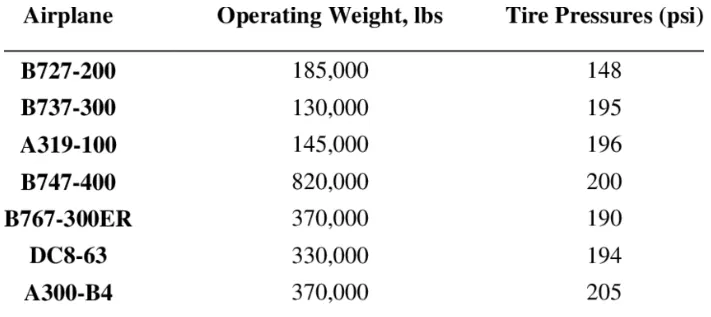
TYRE PRESSURE: Aircraft tyres generally operate at high pressures, up to 200psi(14bar, 1400kPa) for airliners and even higher for business jets. The main landing gear on the concorde was typically inflated to 232psi(16.0bar), whilst its bumper gear were as high as 294psi(20.3bar). The high pressure and weight lod on the concorde tyres were a significant factor in the loss of Air France Flight 4590. Tests of airliner aircrat tyres have shown that they are able to sustain pressures of maximum 800psi(55bar, 5500kPa) before bursting. DUring the tests the tyres have to be filled with water to prevent the test room being blown by the energy that would be released by a gas when tyre bursts.
Aircraft tyres are usually inflated with nitrogen to minimize expansion and contraction from extreme changes in ambient temperature and pressure experienced during flight. Dry nitrogen expands at the same rate as other dry atmospheric gases, but common compressed air sources may contain moisture, which increases the expansion rate with temperature. The requirement that an inert gas, such as Nitrogen be used instead of air for inflation of tyres on certain transport category airplanes was prompted by at least three cases in ehich the Oxygen in air filled tyres had cobined with volatile gases given off by a severely overheated tyre and exploded upon reaching autoignition temeperature. The use of an inert gas for tyre inflation eliminates the possibility of explosion. The following figure shows different aircrafts and their pressure values.
A carefully thought out pressure maintainance routine will increase the life of the tyre and will reduce the number of wheel changes required. As all tyres can allow a small pressure decrease during normal operations aircraft operators should check the ture pressure every 24hours. Because putting the right pressure in the tyres will always take pressure off the aircraft operation. Few poiints have been observed for preventive maintenance. They are,
- Check inflation pressure daily or before first flight when tyres are cool. Tyre pressures should always be checked with the tyre at ambient temperatures as they can rise in excess of 93°C above ambient during operetion. A tempereture change of 3°C produces approximately 1% pressure change. It can take up to 3 hours or more after a flight for tyre temperatures to return to ambient. A tyre assembly can lose as much as 5% of the inflation pressure in a 24-hour period and still be considered normal. Tyre pressures change on a daily basis.
- When tyres are going to be subjected to ambient temperature differences between two locations in excess 2°C, inflation pressures should be adjusted to the colder temeperature prior to takeoff. This also applies when checking pressure in a heated hangar in the winter.
- It muct be determined if loaded and unloaded pressure has been specified by the aircraft manufacturer. When a tyre is under load, the gas chamber volume is reduced due to tyre deflection. Therefore, if unloaded pressure has been specified, that number should be increased by 4% to obtain the equivalent loaded inflation pressure. The opposite is true as well, if loaded pressure has been specified, that number should be reduced by 4% if the tyre is eing inflated while unloaded.
- Excess inflation pressure should never be bled off from hot tyres. All adjustments to inflation pressure should be performed on tyres cooled to ambient temperature.
- To prevent one tyre on a gear from carrying extra load, all tyres on a single gear should be inflated equally. The mate tyres will share the load, allowing individual tyres to run underinflated or overloaded if pressures are unequal, because all tyres on the gear will deflect identically.
- Inaccurate gauges are a major source of improper inflation pressures. Gauges should be checked periodically and recalibrated as necessary.
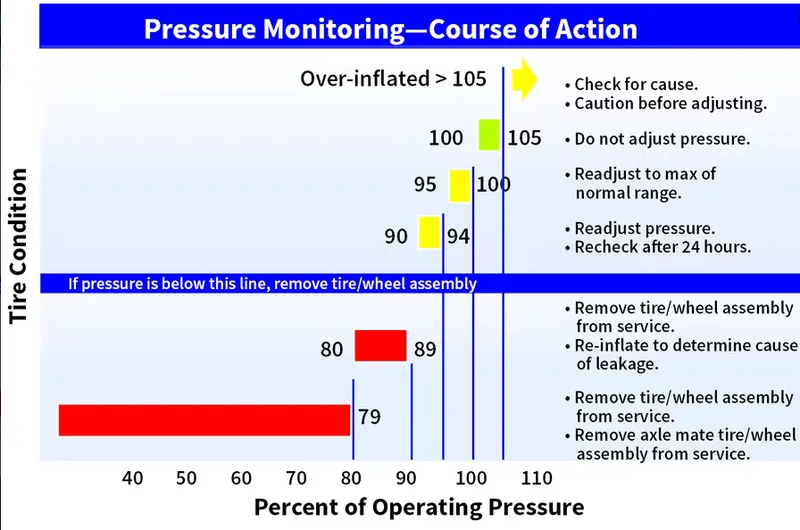
The following figure shows the pressre monitoring and respectieve course of action.
BRAKE FORCES WHEN LANDING: Aircrafts relay on a braking system to safely land on runways. At crusing altitude, most commercial airplanes fly at a speed of roughly 500 to 600mph. When landing, however thet must reduce their speed. A typical 747, for instance, has a landing speed of about 160 to 170mph. And upon touching the runway, aircrafts must quickly brake until they come to complete stop. From the cockpit will apply the brake as shown in the following figure.
The braking procedure which is used while landing is explained below.
Wing spoilers: Many aircrafts use wing spoilers to assist with braking when landing. Not to be confused with ailerons, spoilers are extendable flaps on the ends of n aircrafts wings. Pilots can raise the spoilers to decelerate the airplane as it approches the runway. And even while on the run way, piots will typically leave the wing spoilers raised. Raised wing spoilers create drag, which essentially slows down the aircraft so that it is able to brake more quickly. The following figure shows wing spoler of an aircraft.
Disc Brakes: In addition to wing spoilers, aircraft's use disc brakes. Aircraft disc brakes are similar to the braking system in automobiles. They consist of a pain of calipers that, when engaged, squeeze pads against the rotors of an aircraft's landing gear.
Disc brakes are designed to remain static at all times. In other words, they don't rotate with the wheels of an aircraft's landing gear. As the wheels turn, the disc brakes will remain static and statonary. They are a vital component of an aircraft's braking system because they are designed to apply pressure to the aircraft's wheels. Disc brakes will squeeze the wheels, thereby slowing down the speed at which they spin. In turn, this reduces the speed of the aircraft so that it can come to a complete stop on the runway. The following figure shows the disc brake and its parts.
Reverse Thrust: Finally many jet aircrafts use reverse thrust to assist with braking during landings. Reverse thrust is a feature in jet engine aircrafts that, as the name suggests, involves the reversal of the engine's thrust. When flying, the thrust is projected out the rear of an aircraft's engines. When landing, however, pilots may use the reverse thrust feature. Reverse thrust changes the direction of the engine's thrust. Rather than projecting out the rear, the thrust will be projected out the front. This reversal of thrust provides deceleration that allows aircrafts to slow down more quickly when landing.
PART B
6. A. With necessary assumptions, calculate the force and power required to push / pull an aircraft by a towing vehicle.
B. Develop the model for the calculated force and power using Simulink.
Solution:
A. With necessary assumptions, calculate the force and power required to push / pull an aircraft by a towing vehicle.
According to the challenge we have to calculate the force and power required to push or pull an aircraft by a towing vehicle, so here we are considering the following calculation for both towing vehicle and aircraft,
Taking the values of Aircraft 310, the specifications are,
Mass = 164000kg
Height = 15.80m
Width = 43.90m
Frontal area A = Height × Width = 15.80×43.90 = 693.62m²
Drag coefficient Cd = 0.0265
Air density ρ = 1.225kg/m³
Taking the values of towing vehicle TBL280,
Mass = 35000kg
Height = 2.0m
Width = 3.4m
Frontal area A = Height × Width = 2.0×3.4 = 6.8m²
Tyre size R = 22'' = 0.5588m
Drag coefficient Cd = 0.6
Air density ρ = 1.225kg/m³
Speed v = 32kmph = 32×5/18 = 8.89m/s.
Now calculating the forces which are acting in the push or pull of an aircraft by a towing vehicle,
Forces calculating are,
Rolling resistance force = Frr
Airdrag force = Fad
Formulas using:
Frr = µrr × m × g
Where m = mass of the body
µrr = Coefficient of rolling resistance
g = Gravitation = 9.8 m²
Fad = 1/2 × ρ×A×Cd×v²
ρ = Air density
A = Frontal area
Cd = Drag coefficient
v = Speed.
Now the calculations are,
Coefficient of rolling resistance µrr = 0.02
Rolling resistance force of an aircraft Frr1 = µrr × m × g
Frr1 = 0.02 × 164000 × 9.8
Frr1 = 32144N
Rolling resistance force of a Towing vehicle Frr2 = µrr × m × g
Frr2 = 0.02 × 35000 × 9.8
Frr2 = 6860N
Total Rolling resistance force Frr = Frr1 + Frr2
Frr = 6860 + 32144
Frr = 39004N
Air drag force of an aircraft Fad1 = 1/2 × ρ×A×Cd×v²
Fad1 = 1/2 × 1.225 × 693.62 × 0.0265 × 8.89²
Fad1 = 889.77N
Air drag force of a towing vehicle Fad2 = 1/2 × ρ×A×Cd×v²
Fad1 = 1/2 × 1.225 × 6.8 × 0.6 × 8.89²
Fad1 = 197.5N
Total Airdrag force Fad = Fad1 + Fad2
Fad = 889.77N + 197.5
Fad = 1087.3N
Total Forces acting Ft = Frr + Fad
Ft = 39004 + 1087.3
Ft = 40091.3N
Here we are neglected Hill climbing force and acceleration force.
Total Power Pt = Ft × v
Pt = 40091.3 × 8.89
Pt = 356411.66W
Pt = 356.41KW.
Now we calculate the below values,
Total force required to push / pull an aircraft by a towing vehicle = 40091.3N.
Total power required to push / pull an aircraft by a towing vehicle = 356.41Kw.
B. Develop the model for the calculated force and power using Simulink.
Now we have to create a simulink model for the above calculated force and power,
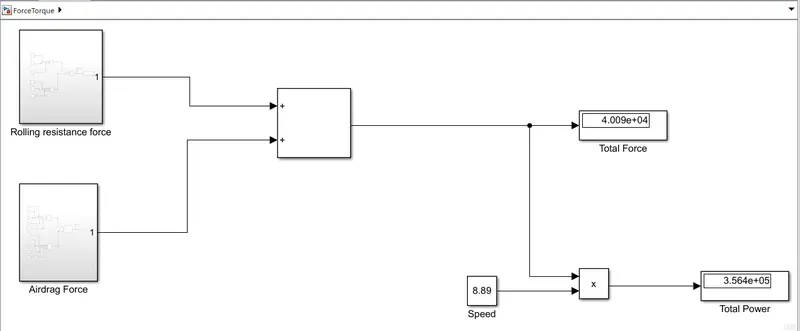
In a simulink model first i have created sunsystems for both Rolling resistance force and Airdrag force, and connected them to a addition block to calculate the Total force. And take a connection from the output of addition block connected it to the product block and speed is also connected to product block. From the output of product block we calculated the power.
Calculations are taken according to the formulas. And display blocks are taken to display the values.
The following figure shows the simulink model to calculate force and power.
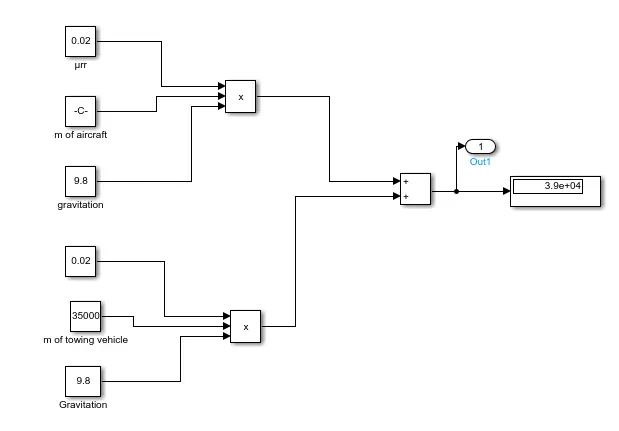
So now from the above Simulink model, by opening the subsystem of rolling resistance force we can see the following connections. Where the rolling resistance force is calculated for both aircraft and towing vehicle and given their outputs to the addition block to calculatate the total Rolling resistance force. And taken a display block to show the value. And taken a output port of subsystem across the output of addition block.
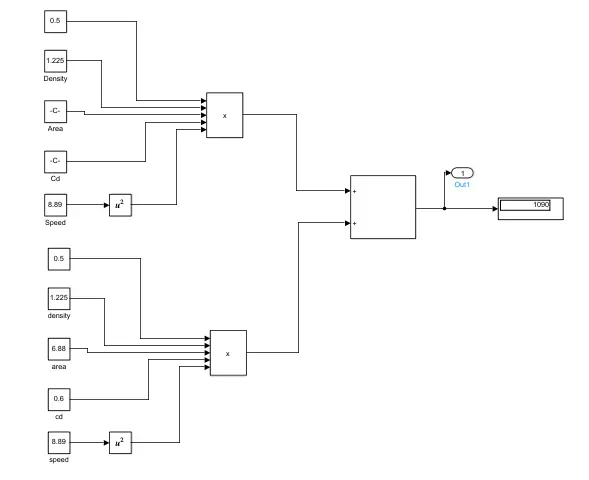
Now we have opened the subsystem block of Airdrag force. Where the following connections will displayed. The upper part of the model is to calculate the airdrag force of aircraft and lower part of the model is to calculate the airdrag force of a towing vehicle. The both outputs from the aircraft ang towing vehicle is given to addition block to calculate the total airdrag force. Dispay block displays the total airdrag force.
From the Simulink model we have created, we calculated the values of total power and force. Which are displaying the values in the display blocks.
7. A. Design an electric powertrain with type of motor, it’s power rating, and energy requirement to fulfill aircraft towing application in Simulink. Estimate the duty cycle range to control the aircraft speed from zero to highest. Make all required assumptions. Prepare a table of assumed parameters. Draw a block diagram of powertrain.
(Hint :DC7 Block)
B. Also, Design the parameters in excel sheet.
Solution:
A. Design an electric powertrain with type of motor, it’s power rating, and energy requirement to fulfill aircraft towing application in Simulink. Estimate the duty cycle range to control the aircraft speed from zero to highest. Make all required assumptions. Prepare a table of assumed parameters. Draw a block diagram of powertrain.
(Hint :DC7 Block)
From the above question, we have calculated the value of the power of towing vehicle to push/pull an aircraft with respect to given velocity and now we are finding out the energy required for the vehicle.
Energy required:
Energy = Power × Time
From the above question the power calculated is,
Power P = 356.41KW
Time is assumed as 20 minutes which is converter to hours as 0.33h
Time t = 0.33h
now,
Energy = 356.41 × 0.33
Energy = 117.6KWh
The energy required for the above calculated power for 20 minutes is 117.6KWh.
Now we have to calculate the input power to drive the duty cycle of the towing vehicle. The output power is taken from the above question, those values are considered based on certain assumptions and calculations from the towing vehicle TBL280.
Duty cycle = Power output/Power input
Where the power input is to be calculated based upon the assumptions of the Motor specifications,
Input voltage = 650V
Input current = 600A
Now, Power input = Input voltage × Input current
Power input = 650 × 600
Power input = 390000W
Power intput = 390KW
From the calculated values, duty cycle is,
Duty cycle = Power output/Power input
Duty cycle = 356.41/390
Duty Cycle = 0.91
% Duty cycle = 91%
The duty cycle required for towing the vehicle TBL280 is 91%.
The following table represents the Assumed parameters.
| PARAMETER | VALUES |
| Aircraft | |
| Mass | 1640000kg |
| Height | 15.80m |
| Width | 43.90m |
| Air density | 1.225kg/m^3 |
| Drag coefficient | 0.0265 |
| Towing vehicle | |
| Mass | 35000kg |
| Height | 2.0m |
| Width | 3.4m |
| Tyre size | 0.5588m |
| Drag coefficient | 0.6 |
| Air density | 1.225kg/m^3 |
| Speed | 8.89m/s |
| Coefficient of rolling resistance | 0.02 |
The following figure represents the Block diagram of Powertrain.
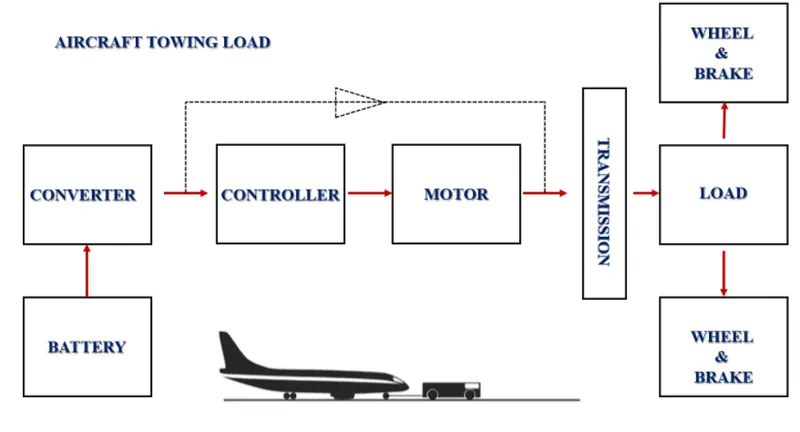
Where the battery is to supply the DC voltage to Converter. The converter gives the required voltage to controller and Motor is controlled by the controlled block. The output of the motor is givem to the transmission system. The tansmission system is linked to the wheels & brakes, load.
Now, We have to design an electric powertrain with type of motor, its power rating and energy requirement to fulfill aircraft towing applications in simulink. So by using the hint given, the simulink model is designed which is shows in the following figure.
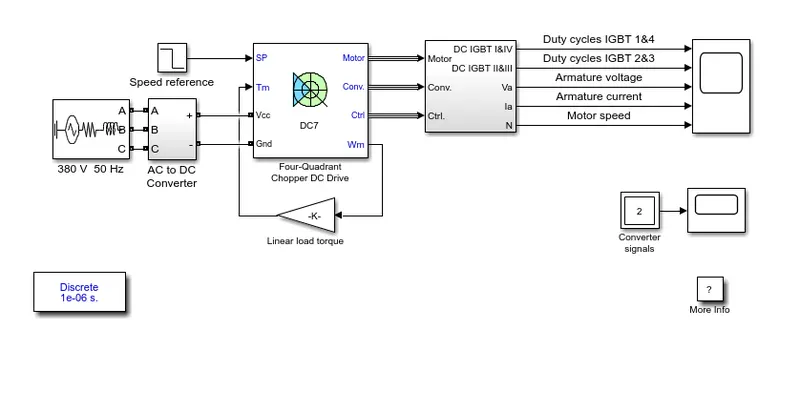
Here AC to DC converter is used because we have taken the input as AC so to convert into Dc we are using the converter.
In the above simulink model we have taken a supply of 380V as voltage. AC to DC converter is used to convert the given supply into DC. Because we are using a DC drive as it requires Dc supply only. The converter output gives values to the DC7 block which gives the values to selector block. From the selector block the value of voltage, current, speed and duty cycles are given to the scope block. The scope block gives the resultant plots.
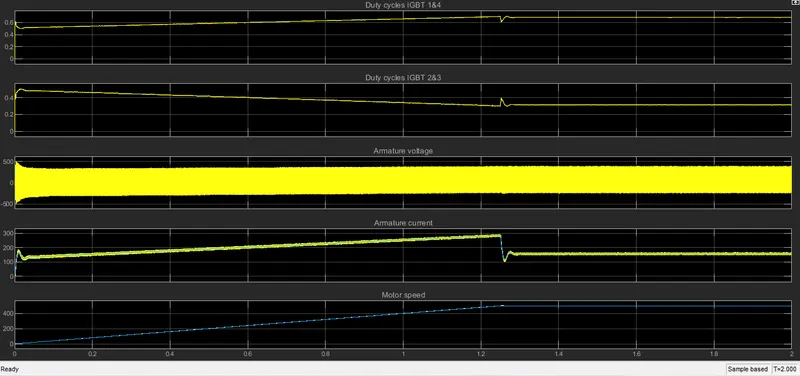
The resultant plots are shown in the following images.
By zoom in the above plot we can observe the result more clearly. The zoom in plot is shown in the following figure.
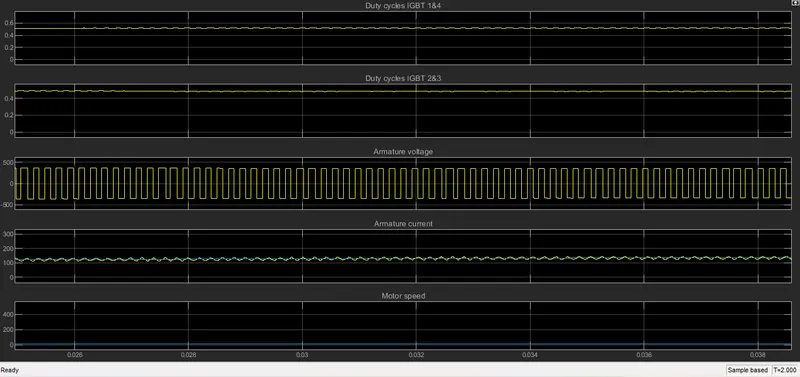
In the above result plot we have observed the plots of Duty cycles, Armature volte, armature current and Motoor speed. We can observe that when the motor reaches it highest voltage and current, the speed of the motor maintained constant. And till then the speed is increasing.
B. Also, Design the parameters in excel sheet.
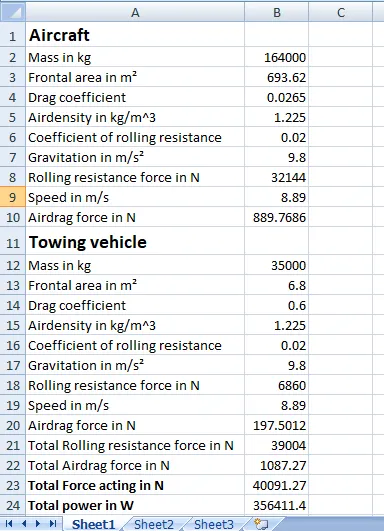
Here we are designig an excel sheet with the parameters assumed, and calculated the required values. The following image shows the excel calculation using the parameters.