Project-1: Powertrain for aircraft in runways
the aircraft gross weight is the total aircraft weight at any moment during the flight or ground operation.
An aircraft's gross weight will decrease during a flight due to fuel and oil consumption. An aircraft's gross weight may also vary during a flight due to payload dropping or in-flight refuelling.
At the moment of releasing its brakes, the gross weight of an aircraft is equal to its takeoff weight. During flight, an aircraft's gross weight is referred to as the en-route weight or in-flight weight.
MTOW-Maximum Take off weight
MLW-Maximum Landing Weight
| Type | MTOW [kg] | MLW [tonnes] | TOR [m] | LR [m] | ICAO category | FAA category |
|---|---|---|---|---|---|---|
| Antonov An-225 | 640,000 | 591.7 | 3500 | Heavy | Super | |
| Scaled Composites Model 351 Stratolaunch | 589,670 | 3660 | Heavy | Super | ||
| Airbus A380-800 | 575,000 | 394 | 3100 | 1930 | Heavy | Super |
| Boeing 747-8F | 447,700 | 346.091 | 3100 | 1800 | Heavy | Heavy |
| Boeing 747-8 | 443,613 | 306.175 | 3100 | Heavy | Heavy | |
| Boeing 747-400ER | 412,770 | 295.742 | 3090 | Heavy | Heavy | |
| Antonov An-124-100M | 405,060 | 330 | 2520 | 900 | Heavy | Heavy |
| Boeing 747-400 | 396,900 | 295.742 | 3018 | 2179 | Heavy | Heavy |
| Lockheed C-5 Galaxy | 381,000 | 288.417 | 2530 | 1494 | Heavy | Heavy |
| Boeing 747-200 | 377,840 | 285.700 | 3338 | 2109 | Heavy | Heavy |
| Boeing 747-300 | 377,840 | 260.320 | 3222 | 1905 | Heavy | Heavy |
| Airbus A340-500 | 371,950 | 240 | 3050 | 2010 | Heavy | Heavy |
| Airbus A340-600[8] | 367,400 | 256 | 3100 | 2100 | Heavy | Heavy |
| Boeing 777F | 347,800 | 260.816 | 2830 | Heavy | Heavy | |
| Boeing 777-300ER | 351,800 | 251.29 | 3100 | Heavy | Heavy | |
| Boeing 777-200LR | 347,450 | 223.168 | 3000 | Heavy | Heavy | |
| Boeing 747-100[7] | 340,200 | 265.300 | Heavy | Heavy | ||
| Airbus A350-1000 | 308,000 | 233.5 | Heavy | Heavy | ||
| Boeing 777-300 | 299,370 | 237.683 | 3380 | Heavy | Heavy | |
| Boeing 777-200ER | 297,550 | 213.00 | 3380 | 1550 | Heavy | Heavy |
| Airbus A340-300[8][9] | 276,700 | 190 | 3000 | 1926 | Heavy | Heavy |
| McDonnell Douglas MD-11 | 273,300 | 185 | 2990 | 1890 | Heavy | Heavy |
| Airbus A350-900 | 270,000 | 175 | 2670 | 1860 | Heavy | Heavy |
| Ilyushin Il-96M | 270,000 | 195.04 | 3115 | 2118 | Heavy | Heavy |
| McDonnell Douglas DC-10 | 256,280 | 183 | 2990 | 1890 | Heavy | Heavy |
| Boeing 787-9[10] | 254,000 | 192.777 | 2900 | Heavy | Heavy | |
| Boeing 787-10[10] | 254,000 | 201.849 | Heavy | Heavy | ||
| Airbus A340-200[8][11] | 253,500 | 181 | 2990 | Heavy | Heavy | |
| Airbus A330-900 | 251,000 | 191 | 3100 | Heavy | Heavy | |
| Ilyushin IL-96-300 | 250,000 | 175 | 2600 | 1980 | Heavy | Heavy |
| Airbus A330-300[12][13] | 242,000 | 185 | 2500 | 1750 | Heavy | Heavy |
| Airbus A330-200[12][13] | 242,000 | 180 | 2220 | 1750 | Heavy | Heavy |
| Lockheed L-1011-500 | 231,300 | 166.92 | 2636 | Heavy | Heavy | |
| Boeing 787-8[10] | 228,000 | 172.365 | 3300 | 1695 | Heavy | Heavy |
| Lockheed L-1011-200 | 211,400 | Heavy | Heavy | |||
| Ilyushin IL-86 | 208,000 | 175 | Heavy | Heavy | ||
| Boeing 767-400ER | 204,000 | 158.758 | 3414 | Heavy | Heavy | |
| Airbus A300-600R[14] | 192,000 | 140 | 2385 | 1555 | Heavy | Heavy |
| Boeing 767-300ER | 187,000 | 136.08 | 2713 | 1676 | Heavy | Heavy |
| Concorde | 185,000 | 111.1 | 3440 | 2220 | Heavy | Heavy |
| Airbus A300-600[14] | 163,000 | 138 | 2324 | 1536 | Heavy | Heavy |
| Boeing 767-300 | 159,000 | 136.078 | 2713 | 1676 | Heavy | Heavy |
| Airbus A310-300[14] | 157,000 | 124 | 2290 | 1490 | Heavy | Heavy |
| Vickers VC10 | 152,000 | 151.9 | Heavy | Heavy | ||
| Boeing 707-320B[15] | 151,000 | 97.5 | Heavy | Heavy | ||
| Boeing 707-320C[15] | 151,000 | 112.1 | Heavy | Heavy | ||
| Douglas DC-8-61 | 147,000 | Heavy | Heavy | |||
| Airbus A310-200[14] | 142,000 | 123 | 1860 | 1480 | Heavy | Heavy |
| Airbus A400M | 141,000 | 122 | 980 | 770 | Heavy | Heavy |
| Douglas DC-8-32 | 140,000 | Heavy | Heavy | |||
| Douglas DC-8-51 | 125,000 | Medium | Large | |||
| Boeing 757-300 | 124,000 | 101.6 | 2550 | 1750 | Medium | Large |
| Boeing 707-120B[15] | 117,000 | 86.3 | Medium | Large | ||
| Boeing 757-200 | 116,000 | 89.9 | 2347 | 1555 | Medium | Large |
| Boeing 720B[16] | 106,000 | 79.5 | Medium | Large | ||
| Boeing 720[16] | 104,000 | 79.5 | Medium | Large | ||
| Tupolev Tu-154M | 104,000 | 80 | Medium | Large | ||
| Tupolev Tu-204SM | 104,000 | 87.5 | 2250 | Medium | Large | |
| Convair 880 | 87,500 | Medium | Large | |||
| Boeing 737-900 | 85,000 | 66.36 | 2500 | 1704 | Medium | Large |
| Boeing 737-900ER | 85,000 | 71.35 | 2804 | 1829 | Medium | Large |
| Boeing 727-200 Advanced[17] | 84,000 | 70.1 | Medium | Large | ||
| Airbus A321-100[18] | 83,000 | 77.8 | 2200 | 1540 | Medium | Large |
| Boeing 737-800 | 79,000 | 65.32 | 2308 | 1634 | Medium | Large |
| Boeing 727-200[17] | 78,000 | 68.1 | Medium | Large | ||
| McDonnell-Douglas MD-83 | 73,000 | 63.28 | Medium | Large | ||
| Boeing 727-100[17] | 72,500 | 62.4 | Medium | Large | ||
| Boeing 727-100C[17] | 72,500 | 62.4 | Medium | Large | ||
| McDonnell-Douglas MD-90-30 | 71,000 | 64.41 | 2165 | 1520 | Medium | Large |
| de Havilland Comet 4 | 70,700 | Medium | Large | |||
| Boeing 737-700 | 70,000 | 58.06 | 1921 | 1415 | Medium | Large |
| Airbus A320-100[18] | 68,000 | 66 | 1955 | 1490 | Medium | Large |
| Boeing 737-400 | 68,000 | 54.9 | 2540 | 1540 | Medium | Large |
| de Havilland Comet 3 | 68,000 | Medium | Large | |||
| Boeing 377 | 67,000 | Medium | Large | |||
| Boeing 737-600 | 66,000 | 54.66 | 1796 | 1340 | Medium | Large |
| Airbus A220-300 | 65,000 | 57.61 | 1890 | 1494 | Medium | Large |
| Hawker Siddeley Trident 2E | 65,000 | Medium | Large | |||
| Airbus A319[18] | 64,000 | 62.5 | 1850 | 1470 | Medium | Large |
| Boeing 737-300 | 63,000 | 51.7 | 1939 | 1396 | Medium | Large |
| Boeing 737-500 | 60,000 | 49.9 | 1832 | 1360 | Medium | Large |
| Airbus A220-100 | 59,000 | 50.80 | 1463 | 1356 | Medium | Large |
| Airbus A318[18] | 59,000 | 57.5 | 1375 | 1340 | Medium | Large |
| Boeing 717-200HGW | 55,000 | 47.174 | 1950 | Medium | Large | |
| Douglas DC-7 | 55,000 | Medium | Large | |||
| de Havilland Comet 2 | 54,000 | Medium | Large | |||
| Boeing 717-200BGW | 50,000 | 46.265 | 1950 | Medium | Large | |
| de Havilland Comet 1 | 50,000 | Medium | Large | |||
| Douglas DC-6A | 48,600 | Medium | Large | |||
| Douglas DC-6B | 48,500 | Medium | Large | |||
| Embraer 190[19] | 48,000 | 43 | 2056 | 1323 | Medium | Large |
| Caravelle III | 46,000 | Medium | Large | |||
| Fokker 100 | 46,000 | 39.95 | 1621 | 1350 | Medium | Large |
| Douglas DC-6 | 44,000 | Medium | Large | |||
| Avro RJ-85 | 42,000 | 36.74 | Medium | Large | ||
| Handley Page Hermes | 39,000 | Medium | Large | |||
| Embraer 175[20] | 37,500 | 32.8 | 2244 | 1304 | Medium | Large |
| Bombardier CRJ900[21] | 36,500 | 33.345 | 1778 | 1596 | Medium | Large |
| Embraer 170[22] | 36,000 | 32.8 | 1644 | 1274 | Medium | Large |
| Bombardier CRJ700 | 33,000 | 30.39 | 1564 | 1478 | Medium | Large |
| Douglas DC-4 | 33,000 | Medium | Large | |||
| Vickers Viscount 800 | 30,400 | Medium | Large | |||
| Bombardier Q400 | 28,000 | 28.01 | 1219 | 1295 | Medium | Large |
| Bombardier CRJ200 | 23,000 | 21.319 | 1918 | 1479 | Medium | Large |
| ATR 72-600 | 22,800 | 22.35 | 1333 | 914 | Medium | Large |
| Saab 2000 | 22,800 | 21.5 | 1300 | Medium | Large | |
| Embraer ERJ 145 | 22,000 | 19.3 | 2270 | 1380 | Medium | Large |
| ATR 42-500 | 18,600 | 18.3 | 1165 | 1126 | Medium | Small |
| Saab 340 | 13,150 | 12.930 | 1300 | 1030 | Medium | Small |
| Embraer 120 Brasilia | 11,500 | 11.25 | 1560 | 1380 | Medium | Small |
| BAe Jetstream 41 | 10,890 | 10.570 | 1493 | 826 | Medium | Small |
| Learjet 75[23] | 9,752 | 8.709 | 1353 | 811 | Medium | Small |
| Pilatus PC-24[24] | 8,300 | 7.665 | 893 | 724 | Medium | Small |
| Embraer Phenom 300[25] | 8,150 | 7.65 | 956 | 677 | Medium | Small |
| Beechcraft 1900D | 7,765 | 7.605 | 1036 | 853 | Medium | Small |
| Cessna Citation CJ4[26] | 7,761 | 7.103 | 1039 | 896 | Medium | Small |
| de Havilland Hercules | 7,000 | Medium | Small | |||
| Embraer Phenom 100 | 4,800 | 4.43 | 975 | 741 | Light | Small |
Airspeed vs. Ground Speed
As mentioned above, true airspeed is simply the speed at which an aircraft is moving relative to the air it is flying in. As such, it’s also the speed at which the air is flowing around the aircraft’s wings.
Ground speed, on the other hand, is the aircraft’s speed relative to the ground. One thing that should be noted here is that it’s its horizontal rather than vertical speed – an aircraft climbing completely vertically would have a ground speed of zero.
In other words, while airspeed is what determines whether there is enough airflow around an aircraft to make it fly, ground speed is what determines how fast an aircraft will get to its destination.
Wind’s Effect on Ground Speed
The relationship between airspeed and ground speed is fairly simple. Ground speed is simply the sum of airspeed and wind speed.
If the aircraft is flying in the same direction as the wind is blowing, the aircraft experiences tailwind, and its ground speed is higher than its airspeed. On the other hand, if the wind is blowing against the direction the aircraft is traveling in, the aircraft experiences headwind, and its ground speed is lower than its airspeed.
solution 3
Why is it not recommended to use aircraft engine power to move it on the ground at Airport?
The risks which may arise from engine ground running relate to the potential for loss of control of the aircraft by those persons occupying the pilot seats in the flight deck. Unwanted consequences from such static running are mainly related to those arising from the unintended movement of the aircraft during engine running - effectively a loss of control - especially during high power engine running. Damage can occur to the aircraft itself, other aircraft nearby or to airside structures. In addition, there is a risk of injury to ground support personnel who may be in relatively close proximity to the aircraft.
When modern jet engines are operated at rated thrust levels, the exhaust wake can exceed 375 mi/h (325 kn or 603 km/h) immediately aft of the engine exhaust nozzle. This exhaust flow field extends aft in a rapidly expanding cone, with portions of the flow field contacting and extending aft along the pavement surface (fig. 1). Exhaust velocity components are attenuated with increasing distance from the engine exhaust nozzle. However, an airflow of 300 mi/h (260 kn or 483 km/h) can still be present at the empennage, and significant people and equipment hazards will persist hundreds of feet beyond this area. At full power, the exhaust wake speed can typically be 150 mi/h (130 kn or 240 km/h) at 200 ft (61 m) beyond the airplane and 50 to 100 mi/h (43 to 88 kn or 80 to 161 km/h) well beyond this point.
The extensive noise arises from the engine power also dangerous for humans and other living things around the vicinity.
Hence for the above reasons it is not recommended to use engine power to move on the ground.
4. How an aircraft is pushed to runway when its ready to take off?
In aviation, pushback is an airport procedure during which an aircraftis pushed backwards away from an airport gate by external power. Pushbacks are carried out by special, low-profile vehicles called pushback tractors or tugs.
Although many aircraft are capable of moving themselves backwards on the ground using reverese thrust (a procedure referred to as a powerback), the resulting jetblast or propwash might cause damage to the terminal building or equipment. Engines close to the ground may also blow sand and debris forward and then suck them into the engine, causing damage to the engine. A pushback is therefore the preferred method to move the aircraft away from the gate.
Pushbacks at busy aerodromes are usually subject to ground control clearance to facilitate ground movement on taxiways. Once clearance is obtained, the pilot will communicate with the tractor driver (or a ground handler walking alongside the aircraft in some cases) to start the pushback. To communicate, a headset may be connected near the nose gear.
Since the pilots cannot see what is behind the aircraft, steering is done by the pushback tractor driver and not by the pilots. Depending on the aircraft type and airline procedure, a bypass pin may be temporarily installed into the nose gear to disconnect it from the aircraft's normal steering mechanism.
Once the pushback is completed, the towbar is disconnected, and any bypass pin removed. The ground handler will show the bypass pin to the pilots to make it clear that it has been removed. The pushback is then complete, and the aircraft can taxi forward under its own power.
5.Learn about take off power, tyre design, rolling resistance, tyre pressure, brake forces when landing.
Take-Off Power:
For light aircraft, usually full power is used during takeoff. Large transport category (airliner) aircraft may use a reduced power for takeoff, where less than full power is applied in order to prolong engine life, reduce maintenance costs and reduce noise emissions. In some emergency cases, the power used can then be increased to increase the aircraft's performance. Before takeoff, the engines, particularly piston engines, are routinely run up at high power to check for engine-related problems. The aircraft is permitted to accelerate to rotation speed (often referred to as Vr). The term rotation is used because the aircraft pivots around the axis of its main landing gear while still on the ground, usually because of gentle manipulation of the flight controls to make or facilitate this change in aircraft attitude (once proper air displacement occurs under / over the wings, an aircraft will lift off on its own; controls are to ease that in).
The nose is raised to a nominal 5°–15° nose up pitch attitude to increase lift from the wings and effect liftoff. For most aircraft, attempting a takeoff without a pitch-up would require cruise speeds while still on the runway.
Tyre Design:
Based on the type of plies used the tyres can be:
Radial ply tires - these tyres feature a flexible casing which is constructed of rubber-coated ply cords which extend around the beads and are substantially at 90° to the centerline of the tread. The casing is stabilized by an essentially inextensible circumferential belt.
Bias ply tires - these tyres feature a casing which is constructed of alternate layers of rubber-coated ply cords which extend around the beads and are at alternate angles substantially less than 90° to the center line of the tread.
Based on the method for containing the inflation gas the tyres can be:
- Tube-type tyres - these require tubes for inflation retention.
- Tubeless tyres - these do not require tubes. They are constructed with an innerliner (integral rubber lining that is engineered to prevent the diffusion of the inflation gas into the casing.).
Rolling Resistance:
The resistance offered by the tyres against motion of vehicle/aircraft is called as rolling resistance, the rolling resistance is produced during take off/landing in the runway.
Tyre Pressure:
Aircraft tires are usually inflated with nitrogen to minimize expansion and contraction from extreme changes in ambient temperature and pressure experienced during flight. Dry nitrogen expands at the same rate as other dry atmospheric gases (normal air is about 80% nitrogen), but common compressed air sources may contain moisture, which increases the expansion rate with temperature.
Tests of airliner aircraft tires have shown that they are able to sustain pressures of maximum 800 psi (55 bar; 5,500 kPa) before bursting. During the tests the tires have to be filled with water, to prevent the test room being blown apart by the energy that would be released by a gas when the tire bursts.
The main landing gear on the Concorde was typically inflated to 232 psi (16.0 bar), whilst its tail bumper gear tires were as high as 294 psi (20.3 bar). The high pressure and weight load on the Concorde tyres were a significant factor in the loss of Air France flight 4590
Brakes Forces When Landing:
In general, when the wheels touch the ground, a set of spoilers raise up quickly, which kills the lift provided by the wings. (There are two sets seen in the image below: ground spoilers that only deploy on landing, and spoilers that are used in flight as speed brakes as well as on landing.) While the spoilers provide some drag, their primary purpose is to stop the plane from actually flying, putting all of the weight on the landing gear and in turn making the brakes that much more effective.
Aircraft have highly-engineered, multi-disc brakes made of a carbon-steel material. Manufacturers include Honeywell and Goodrich, part of Collins Aerospace. In general, the brakes are composed of discs that rotate with the wheel and separate discs that are fixed. When pressure is applied—and below you see pressure applied from the right fixed disc on all of the discs—the entire assembly compresses to create the braking action. Carbon brakes are standard today; they cool faster than steel brakes (their predecessor) and can weigh up to 700 pounds less. That represents a significant weight saving for airlines.
Auto Brakes:
Wheel brakes are usually selected to engage automatically after landing. These are called “autobrakes”.that all airliners have several levels of autobrake “severity”. The crew will decide which is the most appropriate to use for every landing depending upon factors like the length of runway, if it is wet or dry, or if the pilots want to exit the runway at a particular point. “For a short wet runway you might select autobrake 3, or MED on the Airbus. For a long dry runway you might select autobrake 1 or LOW on the Airbus".
6. With necessary assumptions, calculate the force and power required to push / pull an aircraft by a towing vehicle.
The rolling resistance for the air plane can be calculated as
Fr = U.m.g
where
Fr = rolling resistance (N)
cu= rolling resistance coefficient
m = rolling mass (kg)
a = acceleration of gravity (9.81 m/s2)
If the mass of a plane is 50000 kg and the rolling resistance co-efficient between the aircraft wheel and the runway is 0.02
The force required to overcome the rolling resistance can be calculated as
Fr = 0.02 * (50000 kg) *(9.81 m/s2)
= 9810 N
The friction for the puller can be calculated to
Ff = μ W
= μ mf ag
where
Ff = frictional force (N)
μ = friction coefficient
W = Weight (N)
mf = friction mass (kg)
The friction coefficient between a pulling truck rubber wheels and dry runway is 0.9. Since pulling trucks are connected to air crafts nose wheels close to runway we simplify the calculation of required truck mass
mf = (9810 N) / (0.9 (9.81 m/s2))
=1111kg
Taking radius of the wheel R as 0.3m
The torque is given by T=F*R
T= 7848 * 0.3
= 2354 N.m
The power for pulling/push the aircraft can be calculated as
P=F*V
V= velocity of pull vehicle taken as 5 km/hr
V=1.388 m/s
P=9810*1.388
=13616 W
=13.6kW
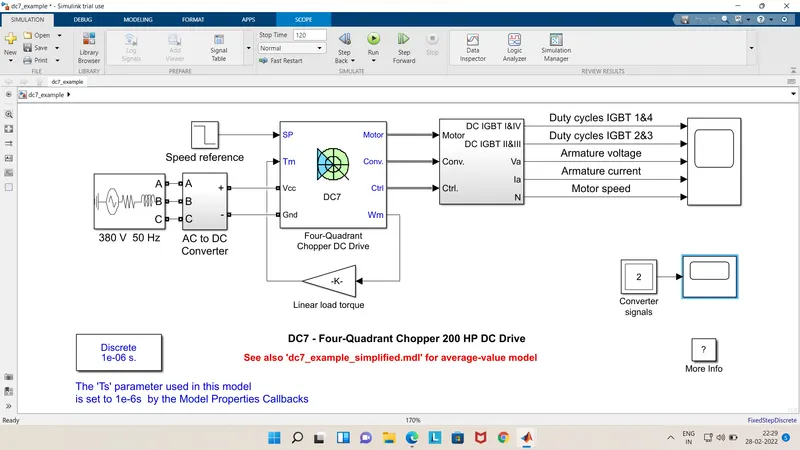
Simulink Diagram of powertrain:
Output: