Project 1 - Parsing NASA thermodynamic data
AIM :
To calculate the entropy, enthalpy and specific heat from give nasa thermodynamic dat
plotting the graphs of every species given data
Objectives:
- have to write an program to read an external data file name'thermo.dat' file
- commands used to interpret line in given data file
- calcute the enthalpy ,entropy anf specific heat of the species by using 7 co-efficients
- plot the graphs of enthalpy,entropy and specific heat againt temperature
- have to save the plots in different directories with names of species
program
clear all
close all
clc

%getting the data file
f1 = fopen('THERMO.dat','r');
for i=1:5
fgetl(f1);
end
% temp = fgetl(f1);
% t = str2num(temp);
% global_lowtemp = t(1);
% global_midtemp = t(2);
% global_hightemp = t(3);
% fgetl(f1);
% fgetl(f1);
% fgetl(f1);
% T = linspace(300,5000,500);

for i=1:53
tline = fgetl(f1);

line1 = fgetl(f1);
A = strsplit(tline,' ');
b = length(A);
species = A{1};
local_low_temp = str2double(A(b-3));
local_med_temp = str2double(A(b-1));
local_high_temp = str2double(A(b-2));

%gettting first line coefecients(a1-a5)

pos_E1 = strfind(line1,'E');

a1 = str2double(line1(1:pos_E1(1)+3));
a2 = str2double(line1(pos_E1(1)+4:pos_E1(2)+3));
a3 = str2double(line1(pos_E1(2)+4:pos_E1(3)+3));
a4 = str2double(line1(pos_E1(3)+4:pos_E1(4)+3));
a5 = str2double(line1(pos_E1(4)+4:pos_E1(5)+3));

%getting second line coeffecients (a6-a10)

line2 = fgetl(f1);
pos_E2 = strfind(line2,'E');
a6 = str2double(line2(1:pos_E2(1)+2));
a7 = str2double(line2(pos_E2(1)+4:pos_E2(2)+3));
a8 = str2double(line2(pos_E2(2)+4:pos_E2(3)+3));
a9 = str2double(line2(pos_E2(3)+4:pos_E2(4)+3));
a10 = str2double(line2(pos_E2(4)+4:pos_E2(5)+3));

%getting third line coeffeceints(a10-a14)
line3 = fgetl(f1);
pos_E2 = strfind(line3,'E');
a11 = str2double(line3(1:pos_E2(1)+3));
a12 = str2double(line3(pos_E2(1)+4:pos_E2(2)+3));
a13 = str2double(line3(pos_E2(2)+4:pos_E2(3)+3));
a14 = str2double(line3(pos_E2(3)+4:pos_E2(4)+3));

T = linspace(local_low_temp,local_high_temp,1000);
R = 8.314;
    if(T<local_med_temp)
       %high temperature coeffecieints
      CP = R*(a8+a9*T+a10*T^.2+a11*T^.3+a12*T^.4);
      H  = (a8+a9*T./2+a10*T^.2/3+a11*T.^3/4+a12*T.^4/5+a13./T)*R.*T;
      S  = R*(a8*log(T)+a9*T+a10*T.^2+a11*T.^3/3+a12*T.^4/4+a14);

    else
        %low temperature coeffecients
      CP = R*(a1+a2*T+a3*T.^2+a4*T.^3+a5*T.^4);
      H  = (a1+a2*T./2+a3*T.^2/3+a4*T.^3/4+a5*T.^4/5+a6./T)*R.*T;
      S  = R*(a1*log(T)+a2*T+a3*T.^2+a4*T.^3/3+a5*T.^4/4+a7);

    end

    %plotting the graphs

figure(1)
plot(T,CP)
xlabel('temperature')
ylabel('specific_heat')

figure(2)
plot(T,H)
xlabel('temperature')
ylabel('entholpy')

figure(3)
plot(T,S)
xlabel('temperature')
ylabel('entropy')
grid on
mkdir(species)
cd (species)
saveas(1,'temperature_vs_cp','jpg')
saveas(2,'temperature_vs_entholpy','jpg')
saveas(3,'temperature_vs_entropy','jpg')
cd ..
mol_mass = molecularweight(species);
sprintf('molecular weight of %s: %f',species,mol_mass)
end
Calculation of molecur weight of species
 function tot_mol_wt =  molecularweight(species)

% input argument 'species' should be of char data type

size = length(species);
elem=['H','C','O','N','A'];%CREATE A CHARACTER ARRAY TO STORE THE VALUE OF ELEMENTS OF SPECIES
at_wt=[1.0079 12.0107 15.999 14.0067 39.948];%CREATE THE ATOMIC MASS FOR THE CORRESPONDING MATERIALS
mol_wt = zeros(1,size);
for i = 1:size
    [num,st] = str2num(species(i));
    if st == 0
        for j = 1:length(elem)
            if species(i) == elem(j)
                mol_wt(i) = mol_wt(i) + at_wt(j);
            end
        end
    else
        mol_wt(i-1) = mol_wt(i-1)*num;
    end
end

tot_mol_wt = sum(mol_wt);

end
results
the results of 53 species has been obtained in a folder

plots of o2
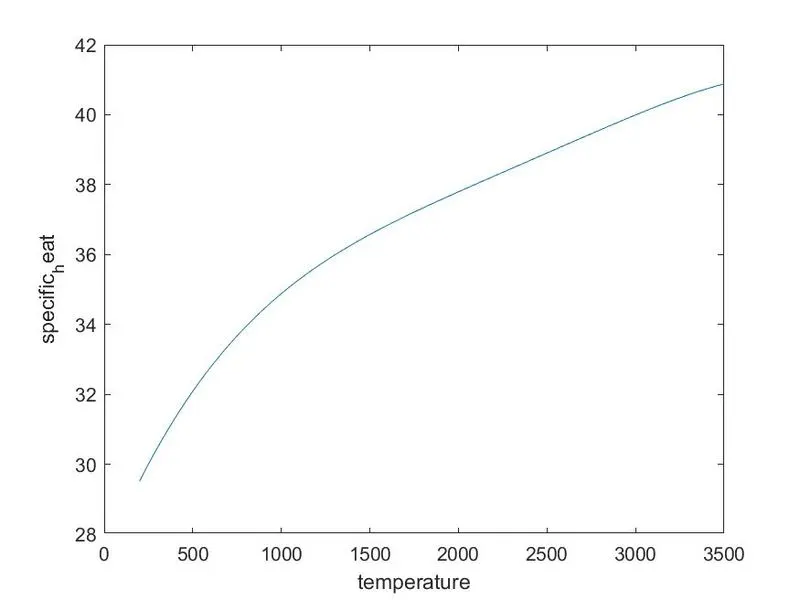
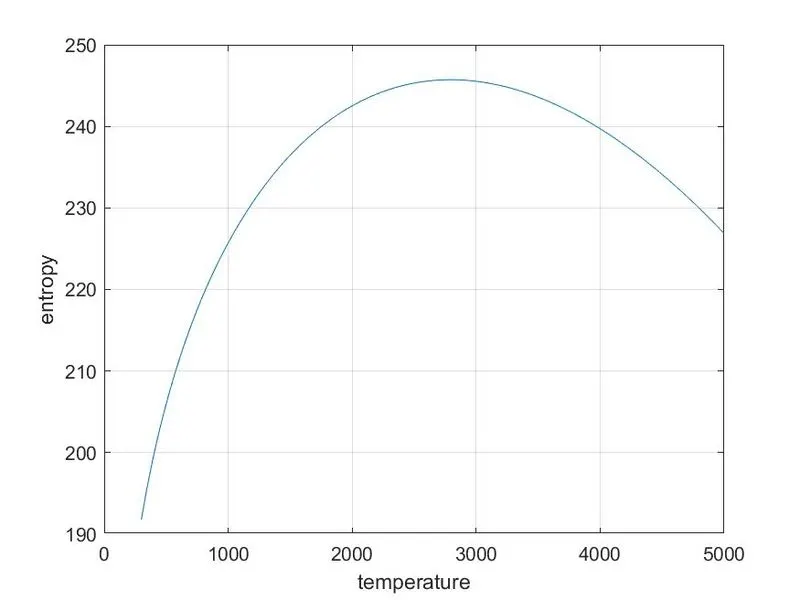
results
plots of O2,N2,CO2 has been uploaded