Project 1 - Parsing NASA thermodynamic data
Aim: -
To write code In Matlab to parse the thermodynamic data file and calculate the thermodynamics properties of various gas species by using the given formula
NASA came up with polynomials that can be used to evaluate thermodynamic properties such as Cp, H, and S. They have also documented the coefficients that are required to evaluate these polynomials for 1000+ species.
Objectives: -
1. Write a function that extracts the 14 coefficients and calculates the enthalpy, entropy, and specific heats for all the species in the data file. You will be reading this file NASA thermodynamic data(Tip: use fopen and fgetl). The formulae are shown below.
Here R is the universal gas constant, T is the temperature
The FIRST 7 coefficients are HIGH-temperature coefficients and the SECOND 7 coefficients are LOW-temperature coefficients.
Also use the LOCAL TEMPERATURE RANGES which is unique for each species, not the GLOBAL TEMPERATURE RANGE.
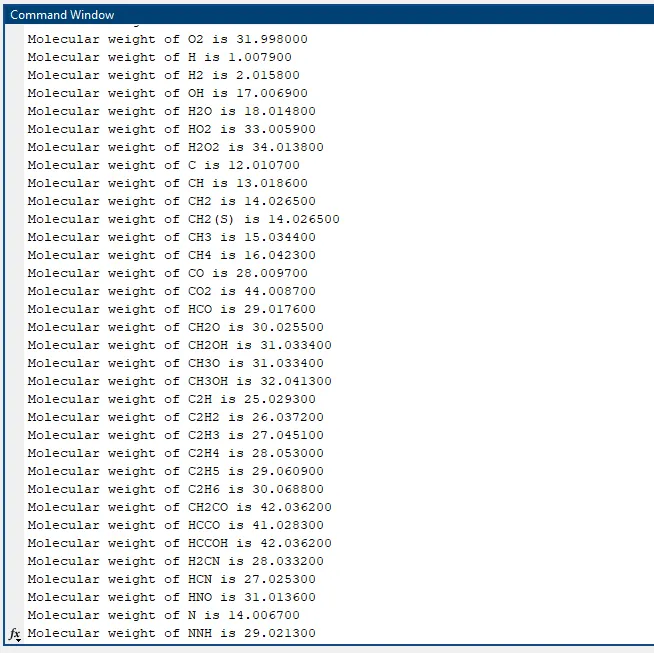
2. Calculate the molecular weight of each species and display it in the command window.
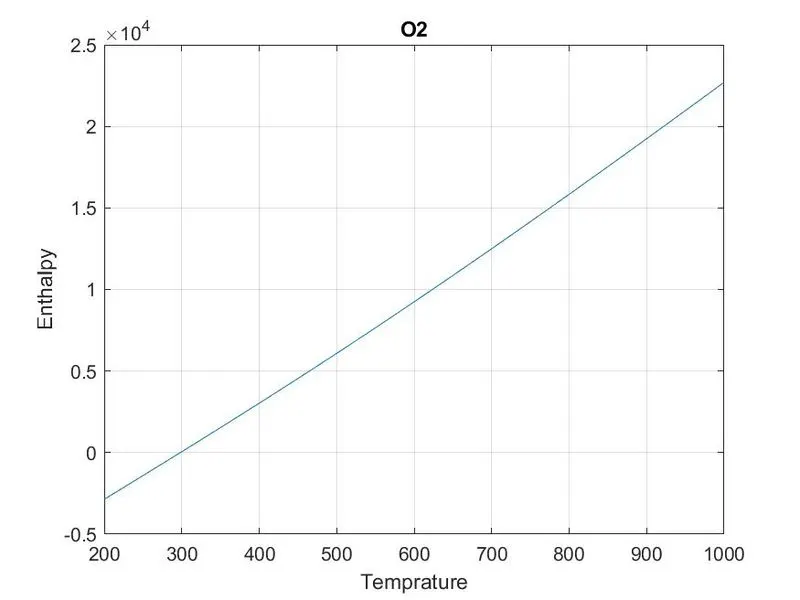
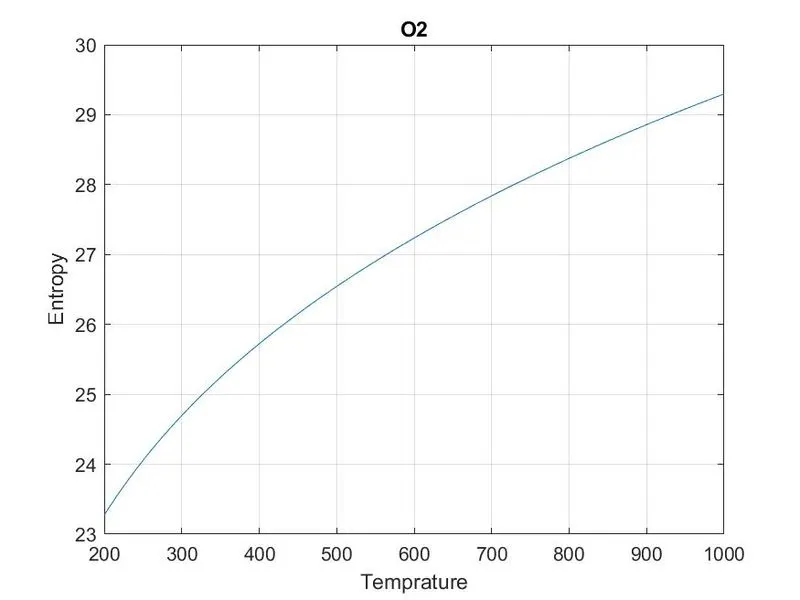
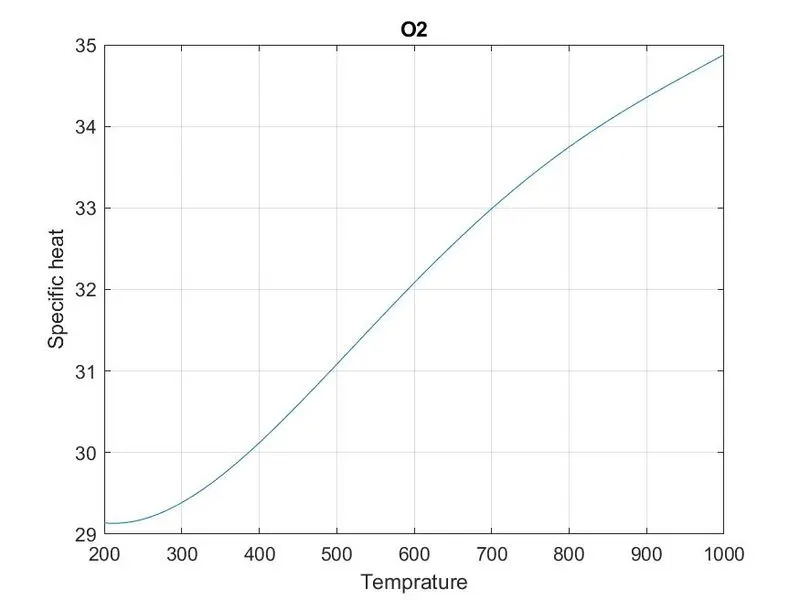
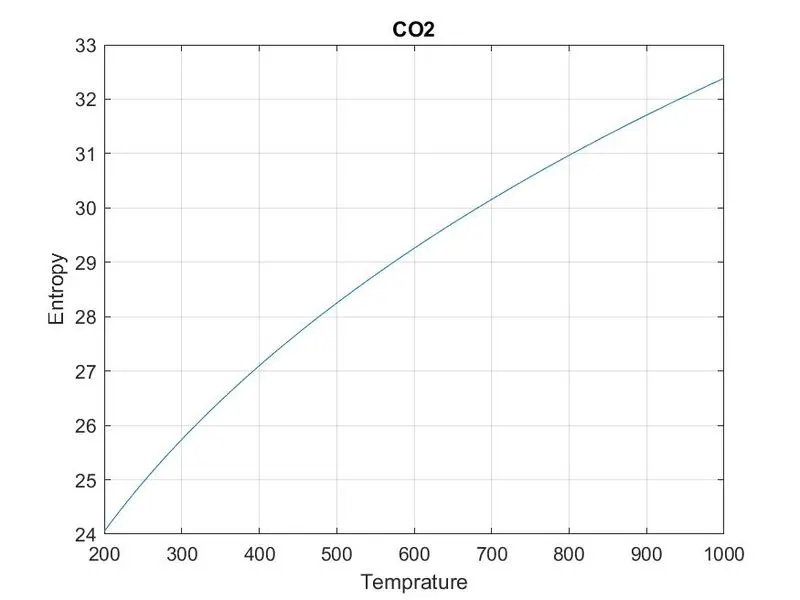
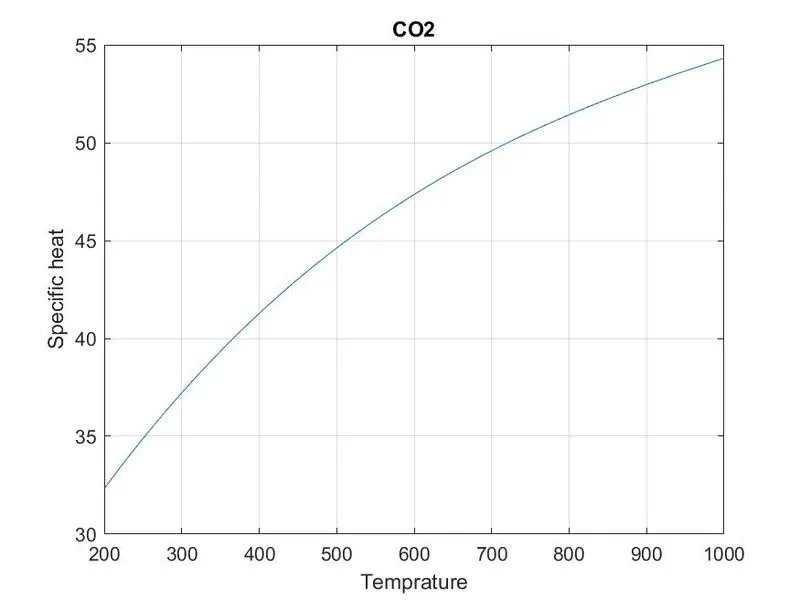
3. Plot the Cp, Enthalpy, and Entropy for the local temperature range (low temperature: high temperature) specific for each species.
4. Save the plots as images with appropriate names and dump them in separate folders for each species with a suitable name. All these should be generated automatically.
5. The main program that you will submit will just take the "THERMO.dat" file as an input and generate Cp, H, and S plots.
6. Please write a detailed report to describe your logic.
Theory: -
Enthalpy: -
When a process takes place at constant pressure, the heat absorbed or released is equal to the Enthalpy change. Enthalpy is sometimes known as “heat content”, but “enthalpy” is an interesting and unusual word, so most people like to use it. Etymologically, the word “entropy” is derived from the Greek, meaning “turning” and “enthalpy” is derived from the Greek meaning “warming”. As for pronunciation, Entropy is usually stressed on its first syllable, while enthalpy is usually stressed on the second.
Enthalpy(H) is the sum of the internal energy(U) and the product of pressure(P) and volume(V).
Enthalpy H can be written as,
H = U + pV
Where, H = Enthalpy of the system
U = Internal energy of the system
p = Pressure of the system
V = Volume of the system
Enthalpy is not measured directly, however, the change in enthalpy (ΔH) is measured, which is the heat added or lost by the system. It is entirely dependent on the state functions T, p, and U.
Enthalpy can also be written as
ΔH=ΔU+ΔPV">ΔH=ΔU+ΔPVΔH=ΔU+ΔPV
At constant temperature, for the process heat flow(q) is equal to the change in enthalpy, this is represented as
ΔH=q">ΔH=q
ΔH=q">Entropy: -
Generally, entropy is defined as a measure of randomness or disorder of a system. This concept was introduced by a German physicist named Rudolf Clausius in the year 1850.
Apart from the general definition, there are several definitions that one can find for this concept. The two definitions of entropy that we will look at on this page are the thermodynamic definition and the statistical definition.
From a thermodynamics viewpoint of entropy, we do not consider the microscopic details of a system. Instead, entropy is used to describe the behavior of a system in terms of thermodynamic properties such as temperature, pressure, entropy, and heat capacity. This thermodynamic description took into consideration the state of equilibrium of the systems.
Meanwhile, the statistical definition which was developed at a later stage focused on the thermodynamic properties which were defined in terms of the statistics of the molecular motions of a system. Entropy is a measure of the molecular disorder.
Other popular interpretations of entropy are as follows;
-
- If we talk about quantum statistical mechanics, Von Neumann extended the notion of entropy to the quantum domain utilizing the density matrix.
- While discussing the information theory, it is a measure of the efficiency of a system in transmitting a signal or the loss of information in a transmitted signal.
- When it comes to dynamical systems, entropy defines the growing complexity of a dynamical system. It also quantifies the average flow of information per unit of time.
- Sociology states that entropy is the social decline or natural decay of structure (such as law, organization, and convention) in a social system.
- In cosmology, entropy is described as a hypothetical tendency of the universe to attain a state of maximum homogeneity. It states that the matter should be at a uniform temperature.
In any case, today the term entropy is used in many other sciences very much distant from physics or mathematics and we must say that it no longer maintains its rigorous quantitative character.
Entropy Change and calculations
During entropy change, a process is defined as the amount of heat emitted or absorbed isothermally and reversibly divided by the absolute temperature. The entropy formula is given as;
∆S = qrev,iso/T
If we add the same quantity of heat at a higher temperature and lower temperature, randomness will be maximum at a lower temperature. Hence, it suggests that temperature is inversely proportional to entropy.
Total entropy change, ∆Stotal =∆Ssurroundings+∆Ssystem
Total entropy change is equal to the sum of entropy change of system and surroundings.
If the system loses an amount of heat q at a temperature T1, which is received by surroundings at a temperature T2.
So, ∆Stotal can be calculated
∆Ssystem=-q/T1
∆Ssurrounding =q/T2
∆Stotal=-q/T1+q/T2
● If ∆Stotal is positive, the process is spontaneous.
● If ∆Stotal is negative, the process is non-spontaneous.
● If ∆Stotal is zero, the process is at equilibrium.
Entropy change during the isothermal reversible expansion of an ideal gas
∆S = qrev,iso/T
According to the first law of thermodynamics,
∆U=q+w
For the isothermal expansion of an ideal gas, ∆U = 0
qrev = -wrev = nRTln(V2/V1)
Therefore,
∆S = nRln(V2/V1)
Specific Heat: -
Specific heat, Csp, is the amount of heat required to change the heat content of exactly 1 gram of a material by exactly 1°C.
Specific heat values can be determined in the following way: When two materials, each initially at a different temperature, are placed in contact with one another, heat always flows from the warmer material into the colder material until both the materials attain the same temperature. From the law of conservation of energy, the heat gained by the initially colder material must equal the heat lost by the initially warmer material.
We know that when heat energy is absorbed by a substance, its temperature increases. If the same quantity of heat is given to equal masses of different substances, it is observed that the rise in temperature for each substance is different. This is since different substances have different heat capacities. So heat capacity of a substance is the quantity of heat required to raise the temperature of the whole substance by one degree. If the mass of the substance is unity then the heat capacity is called Specific heat capacity or the specific heat.
Specific Heat Capacity Formula
Q = C m ∆t
Where
- Q = quantity of heat absorbed by a body
- m = mass of the body
- ∆t = Rise in temperature
- C = Specific heat capacity of a substance depends on the nature of the material of the substance.
- S.I unit of specific heat is J kg-1 K-1.
Molecular weight: -
Molecular weight is a measure of the sum of the atomic weight values of the atoms in molecules. It is used in chemistry to determine stoichiometry in chemical reactions and equations.
Atomic Mass: -
The atomic mass is the mass of an atom. Although the S.I unit of atomic mass in kg, atomic mass is often expressed as non-S.I, Dalton where one dalton is defined as 1/12 of the mass of single Carbon-12 atom, at rest.
Governing Equation: -
Main Program: -
clear all
close all
clc

%openening and reading the thermo data file
f1 = fopen('THERMO.dat','r')
heading = fgetl(f1);
tline1 = fgetl(f1); %for reading the header information
tline1 = strsplit(tline1,' '); % for splitting the string by using space

%Converting string to number
Global_Low_Temp = str2num(tline1{2});
Global_Mid_Temp = str2num(tline1{3});
Global_High_Temp = str2num(tline1{4});

% Assigning the values
T1 = Global_Low_Temp;
T2 = Global_Mid_Temp;
T3 = Global_High_Temp;

for i = 1:3
    fgetl(f1); % skipping the coments from the data
end

%Reading the species of gases
for i=1:53 %There are 53 species of gases therefore we will be using for loops which run 53 iterations


    header = fgetl(f1);
    h=strsplit(header,' ');

    species_name = (h{1});
    x=length(h);

    local_low_temp = str2double(h{x-3});
    local_mid_temp = str2double(h{x-2});
    local_high_temp = str2double(h{x-1});

    t1 = local_low_temp;
    t2 = local_mid_temp;
    t3 = local_high_temp;

    %Now for getting the coefficients

    line1 = fgetl(f1) ;
    L1 = strfind(line1,'E');
    a1 = str2double(line1(1:L1(1)+3));
    a2 = str2double(line1(L1(1)+4:L1(2)+3));
    a3 = str2double(line1(L1(2)+4:L1(3)+3));
    a4 = str2double(line1(L1(3)+4:L1(4)+3));
    a5 = str2double(line1(L1(4)+4:L1(5)+3));


    line2 = fgetl(f1) ;
    L2 = strfind(line2,'E');
    a6 = str2double(line2(1:L2(1)+3));
    a7 = str2double(line2(L2(1)+4:L2(2)+3));
    a8 = str2double(line2(L2(2)+4:L2(3)+3));
    a9 = str2double(line2(L2(3)+4:L2(4)+3));
    a10 = str2double(line2(L2(4)+4:L2(5)+3));

    line3 = fgetl(f1) ;
    L3 = strfind(line3,'E');
    a11 = str2double(line3(1:L3(1)+3));
    a12 = str2double(line3(L3(1)+4:L3(2)+3));
    a13 = str2double(line3(L3(2)+4:L3(3)+3));
    a14 = str2double(line3(L3(3)+4:L3(4)+3));

    R = 8.314;
    t = linspace(t1,t3,1000);

    %for creating directory where the plot is to be saved
    mkdir('C:\Users\sandesh\Desktop\matlab programs',species_name);

    %asssigning the value for specific heat, enthalpy, entropy and molecular weight of
    the species from its functions
    Cp = specific_heat(a1,a2,a3,a4,a5,a6,a7,a8,a9,a10,a11,a12,a13,a14,R,t,t1,t2,t3);
    h = enthalpy(a1,a2,a3,a4,a5,a6,a7,a8,a9,a10,a11,a12,a13,a14,R,t,t1,t2,t3);
    S = entropy(a1,a2,a3,a4,a5,a6,a7,a8,a9,a10,a11,a12,a13,a14,R,t,t1,t2,t3);
    [M] = molecular_wt(species_name);
    k = sprintf('Molecular weight of %s is %f',species_name,M);
    disp(k);

    %plotting the graphs
    %for Temp vs Specific heat
    figure(1);
    plot(t,Cp);
    grid on;
    title(species_name);
    xlabel('Temprature');
    ylabel('Specific heat');

    %for Temprature vs Enthalpy
    figure(2);
    plot(t,h);
    grid on;
    title(species_name);
    xlabel('Temprature');
    ylabel('Enthalpy');

    %For Temprature vs Entropy
    figure(3);
    plot(t,S);
    grid on;
    title(species_name);
    xlabel('Temprature');
    ylabel('Entropy');

    cd(species_name);

    saveas(figure(1),'specific heat','jpg');
    saveas(figure(2),'enthalpy','jpg');
    saveas(figure(3),'Entropy','jpg');
    cd('C:\Users\sandesh\Desktop\matlab programs');

end
fclose(f1)
Function for calculating Specific Heat
function [Cp] =specific_heat(a1,a2,a3,a4,a5,a6,a7,a8,a9,a10,a11,a12,a13,a14,R,t,t1,t2,t3)

if(t>t2)
    Cp = (a1+a2.*t+a3.*t.^2+a4.*t.^3+a5.*t.^4)*R;
else
    Cp = (a8+a9.*t+a10.*t.^2+a11.*t.^3+a12.*t.^4)*R;
end
Function for calculating Enthalpy
function [h] = enthalpy(a1,a2,a3,a4,a5,a6,a7,a8,a9,a10,a11,a12,a13,a14,R,t,t1,t2,t3)

if (t>t2)
    h= (a1+(a2.*t)/2+(a3.*t.^2)/3+(a4.*t.^3)/4+(a5.*t.^4)/5+(a6./t))*R.*t;
else
   h= (a8+(a9.*t)/2+(a10.*t.^2)/3+(a11.*t.^3)/4+(a12.*t.^4)/5+(a13./t))*R.*t;
end
Function for calculating Entropy
function [S] = entropy(a1,a2,a3,a4,a5,a6,a7,a8,a9,a10,a11,a12,a13,a14,R,t,t1,t2,t3)

if (t>t2)
    S = a1.*log(t)+a2.*t+(a3.*t.^2)/2+(a4.*t.^3)/3+(a5.*t.^4)/4+a7;
else
    S = a8.*log(t)+a9.*t+(a10.*t.^2)/2+(a11.*t.^3)/3+(a12.*t.^4)/4+a14;
end
Function for calculating Molecular Weight
function [M] = molecular_wt(species_name)

elements = ['H','C','O','N','Ar'];
atomic_weight = [1.0079 12.0107 15.999 14.0067 39.948];
M = 0;
for i=1:length(species_name)
    for j=1:length(atomic_weight)
        if strcmp(species_name(i),elements(j))
            M=M+atomic_weight(j);
            x=j;
        end
    end
    n=str2double(species_name(i));
    if (n>1)
        M=M+atomic_weight(x)*(n-1);
    end
end

end
Function program Explanation(Enthalpy, Entropy, Specific Heat): -
1. As asked in question The FIRST 7 coefficients are HIGH-temperature coefficients and the SECOND 7 coefficients are LOW-temperature coefficients. We are going to introduce the function program of Enthalpy, Entropy, Specific Heat. As we can see in the programs that we have programmed we have used the (t>t2). As we can see that t is linspace(t1,t3,1000) it means that we have divided t1 to t3 into 1000 equal parts. so if (t>t2) then we have to input HIGH- temperature coefficients And if it is not we will input the LOW-temperature coefficients as asked in the question.
2. We are going to use different formulas as shown in the governing equation part.
Explanation of molecular weight program: -
1. First of all we are going to introduce two arrays elements and atomic weight. The 53 different species consist of only 6 basic elements namely : Oxygen(O), Hydrogen(H), Carbon(C), Sulphur(S), Nitrogen(N) and Argon(A). So the First array consists of Elements And the second array consists of the atomic weight of the elements.
2. Now we are going to consider the molecular weight 0 initially. Now we are going to introduce the for loop in the program we going to assign i = 1:lenght(species_name) which is 1 to 53. This means that we going to run the 53 iterations. under that we are going to j= 1:length(atomic_weight)
which means 1:5.
3. strcmp command is used to compare strings. This means that it will compare species name and elements arrays.
tf = strcmp(s1,s2)s1 and s2 and returns 1 (true) if the two are identical and 0 (false) otherwise. Text is considered identical if the size and content of each are the same. The return result tf is of data type logical.The input arguments can be any combination of string arrays, character vectors, and cell arrays of character vectors.
4. Further we can see that we have introduced the formula which says that M = M + atomic_weight(j). let's consider the element Oxygen(O). as we can see that atomic weight of O is 15.999. As we have considered M=0 Molecular weight will be 15.999. No, let's say x=j so that we can use the value of j after ending the loop.
5. We are going to end the for loop for j. Moving further we are going to say that n = str2double(species_name(i));. if we consider that n = str2double(O2) it will write the value stored in the cell array of O2. If it is greater than 1 then we are going to use the formula M=M+atomic_weight(X)*(n-1).
X = str2double( converts the text in str)str to double-precision values. str contains text that represents real or complex numeric values. str can be a character vector, a cell array of character vectors, or a string array. If str is a character vector or string scalar, then X is a numeric scalar. If str is a cell array of character vectors or a string array, then X is a numeric array that is the same size as str.
Text that represents a number can contain digits, a comma (thousands separator), a decimal point, a leading + or - sign, an e preceding power of 10 scale factor, and an i or a j for a complex unit. You cannot use a period as a thousand separator, or a comma as a decimal point.
If str2double cannot convert text to a number, then it returns a NaN value.
Main Program Explanation: -
1. clear all- command used to clear variables from the workspace.
close all- command used to close all plot windows.
Clc-command is used to clear the command window.
2. Now we are going to open the THERMO.dat file in MatLab.
fileID = fopen( opens the file, filename)filename, for binary read access, and returns an integer file identifier equal to or greater than 3. MATLAB reserves file identifiers 0, 1, and 2 for standard input, standard output (the screen), and standard error, respectively.
If fopen cannot open the file, then fileID is -1.
3. Read line from the file, removing newline characters. For that, we are going to use fgetl command so that we will be able to read the data file in MatLab. with the help of fgetl the program will read the first line of the program. If we want to read the second line then we have to use the fgetl command again so that it will read the second line in the file.
tline = fgetl( returns the next line of the specified file, removing the newline characters.fileID)
-
If the file is nonempty, then
fgetlreturnstlineas a character vector. -
If the file is empty and contains only the end-of-file marker, then
fgetlreturnstlineas a numeric value-1.
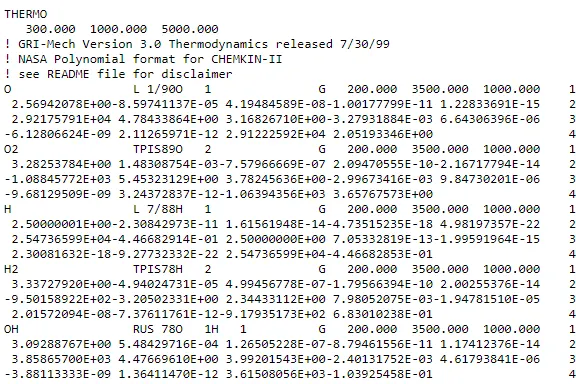
4. Now we are going to use strsplit command. It is used to Split string or character vectors at a specified delimiter. It will eventually form the cell array. which will create a string.
C = strsplit(str)str at whitespace into C. A whitespace character is equivalent to any sequence in the set {' ','\f','\n','\r','\t','\v'}.
If str has consecutive whitespace characters, then strsplit treats them as one whitespace.
5. Now we are going to convert our string into a number so that we can use it further. we are going to specify the cell no so that it will convert it into the number. We have to specify the cell no in curly({}) brackets as we have used in the program.
X = str2num(chr)str2num cannot parse the input as numeric values, then it returns an empty matrix.
The str2num the function does not convert cell arrays or nonscalar string arrays and is sensitive to spacing around + and - operators.
6. Now we are going to assign those No to Global_Low_ Temp, Global_Mid_Temp, Global_High_Temp. and again to T1, T2, T3 respectively.
7. As we can see in the screenshot above we have to skip the comments so we can use fgetl command thrice. so for that, we will use the for loop as shown in the program.
8. No we are going to take outputs of 53 elements so for that we are going to use for loop. And we are going to assign the values of local temperature as shown in the program and after that, we are going to assign those values to t1, t2, t3 respectively. Now here we are going to use command str2double. It Converts strings to double-precision values.
X = str2double( converts the text in str)str to double-precision values. str contains text that represents real or complex numeric values. str can be a character vector, a cell array of character vectors, or a string array. If str is a character vector or string scalar, then X is a numeric scalar. If str is a cell array of character vectors or a string array, then X is a numeric array that is the same size as str.
Text that represents a number can contain digits, a comma (thousands separator), a decimal point, a leading + or - sign, an e preceding power of 10 scale factor, and an i or a j for a complex unit. You cannot use a period as a thousand separator, or a comma as a decimal point.
If str2double cannot convert text to a number, then it returns a NaN value.
9. Moving further we are going to use command strfind to find the location of character E in the line. It Finds strings within other strings. By finding the location of E we can easily assign the values to the a1, a2,...., a14 by using command str2double as we have done in the program.
k = strfind(str,pat)str for occurrences of pat. The output k indicates the starting index of each occurrence of pat in str. If pat is not found, then strfind returns an empty array, []. The strfind function executes a case-sensitive search.
-
If
stris a character vector or a string scalar, thenstrfindreturns a vector of typedouble. -
If
stris a cell array of character vectors or a string array, thenstrfindreturns a cell array of vectors of typedouble.
10. We are going to use linspace command to divide the t1 to t3 into 1000 parts. as we have asked to in the question which says use only local temp values to plot the graph.
11. Now we are going to create a folder automatically by using mkdir command.
mkdir creates the folder folderNamefolderName. If folderName exists, MATLAB® issues a warning. If the operation is not successful, mkdir throws an error to the Command Window.
12. We are going to introduce functions in a program that we have discussed above.
13. We are going to plot the graph of Enthalpy, Entropy, Specific heat vs temperature using simple plot command.
14. cd changes the current folder to newFoldernewFolder. Folder changes are global. Therefore, if you use cd within a function, the folder change persists after MATLAB finishes executing the function
Results: -
Plots of O2
Plots of N2: -
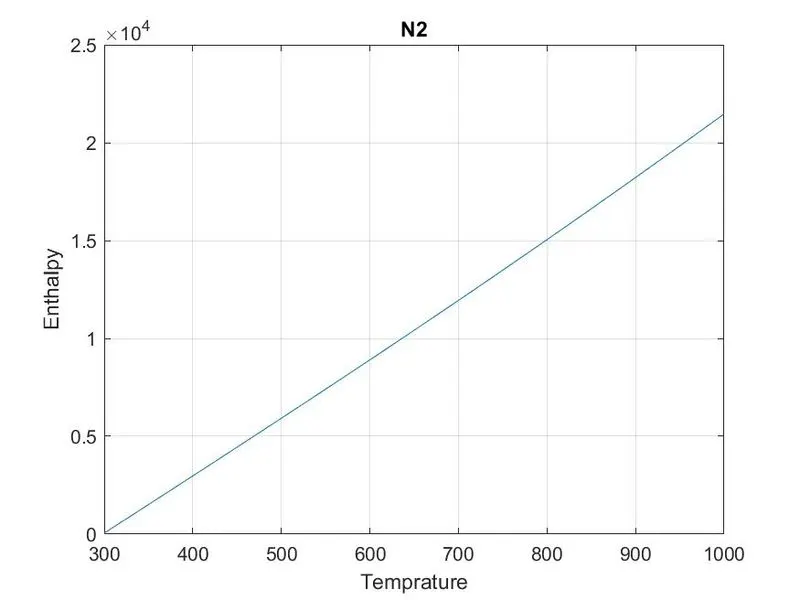
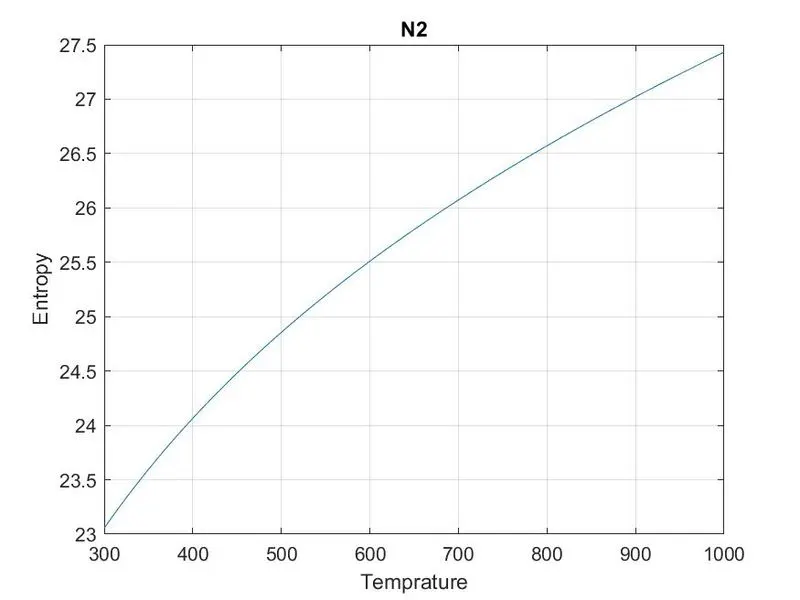
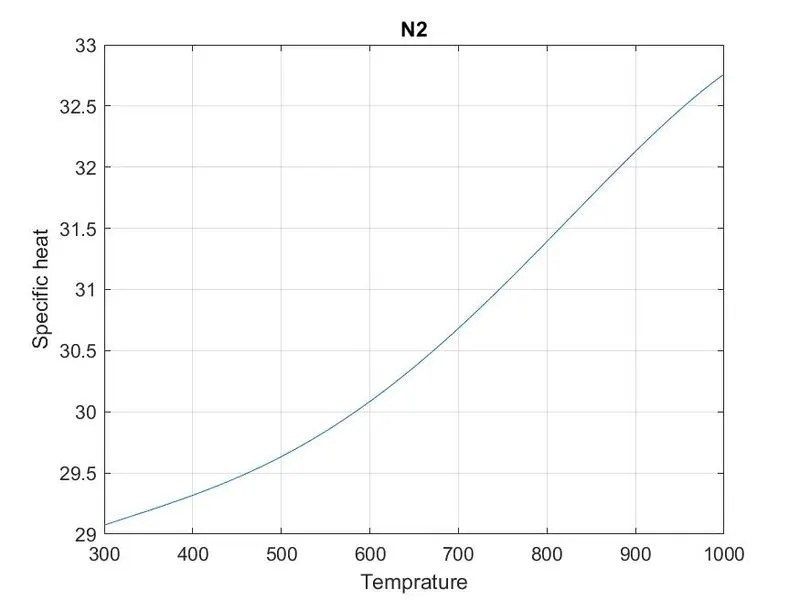
Plots of CO2: -
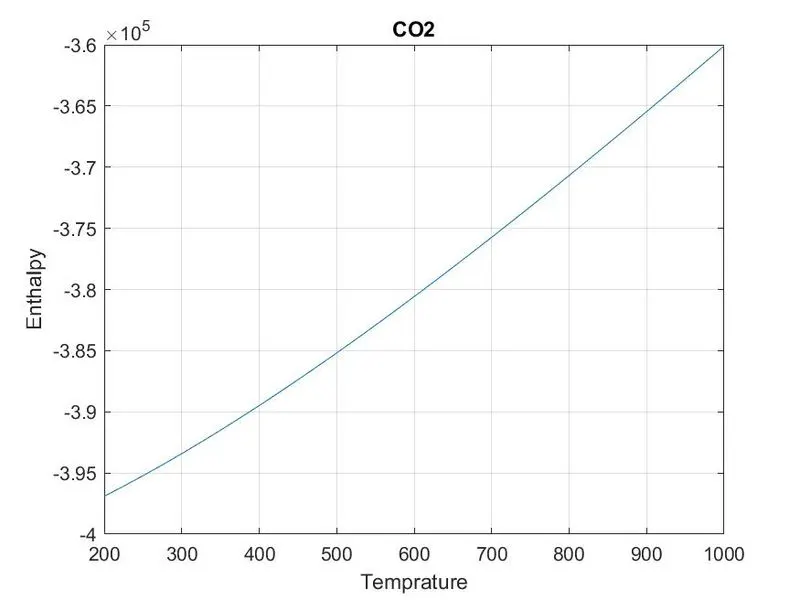
Screenshot of Folder where plots are saved: -

Subfolder screenshot: -

Molecular Weights: -
Molecular weight of O is 15.999000
Molecular weight of O2 is 31.998000
Molecular weight of H is 1.007900
Molecular weight of H2 is 2.015800
Molecular weight of OH is 17.006900
Molecular weight of H2O is 18.014800
Molecular weight of HO2 is 33.005900
Molecular weight of H2O2 is 34.013800
Molecular weight of C is 12.010700
Molecular weight of CH is 13.018600
Molecular weight of CH2 is 14.026500
Molecular weight of CH2(S) is 14.026500
Molecular weight of CH3 is 15.034400
Molecular weight of CH4 is 16.042300
Molecular weight of CO is 28.009700
Molecular weight of CO2 is 44.008700
Molecular weight of HCO is 29.017600
Molecular weight of CH2O is 30.025500
Molecular weight of CH2OH is 31.033400
Molecular weight of CH3O is 31.033400
Molecular weight of CH3OH is 32.041300
Molecular weight of C2H is 25.029300
Molecular weight of C2H2 is 26.037200
Molecular weight of C2H3 is 27.045100
Molecular weight of C2H4 is 28.053000
Molecular weight of C2H5 is 29.060900
Molecular weight of C2H6 is 30.068800
Molecular weight of CH2CO is 42.036200
Molecular weight of HCCO is 41.028300
Molecular weight of HCCOH is 42.036200
Molecular weight of H2CN is 28.033200
Molecular weight of HCN is 27.025300
Molecular weight of HNO is 31.013600
Molecular weight of N is 14.006700
Molecular weight of NNH is 29.021300
Molecular weight of N2O is 44.012400
Molecular weight of NH is 15.014600
Molecular weight of NH2 is 16.022500
Molecular weight of NH3 is 17.030400
Molecular weight of NO is 30.005700
Molecular weight of NO2 is 46.004700
Molecular weight of HCNO is 43.024300
Molecular weight of HOCN is 43.024300
Molecular weight of HNCO is 43.024300
Molecular weight of NCO is 42.016400
Molecular weight of CN is 26.017400
Molecular weight of HCNN is 41.032000
Molecular weight of N2 is 28.013400
Molecular weight of AR is 39.948000
Molecular weight of C3H8 is 44.095300
Molecular weight of C3H7 is 43.087400
Molecular weight of CH3CHO is 44.052000
Molecular weight of CH2CHO is 43.044100
screenshot of command Window: -
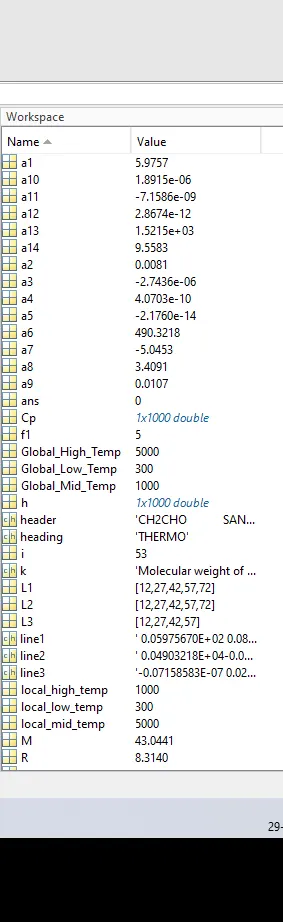
Screenshot of Workspace: -
Conclusion: -
In conclusion, the NASA thermodynamics Data file was parsed using MATLAB, and we have got the required information of the species name, their local temperature ranges, their high and low-temperature coefficients, their specific heat values, their enthalpy values, their entropy values. In addition, the molecular weight for each species is being calculated and graphs for the specific heat, enthalpy, entropy were plotted against their respective temperature values. These plots were saved in the parent folder with each species having its subfolder containing its respective plots.