Project 1 - Parsing NASA thermodynamic data
AIM: To write a MATLAB program fulfilling the following objectives:
- A code to parse the NASA thermodynamic data.
- Write a function that extracts the 14 coefficients and calculates the enthalpy, entropy, and specific heats for all the species in the data file.
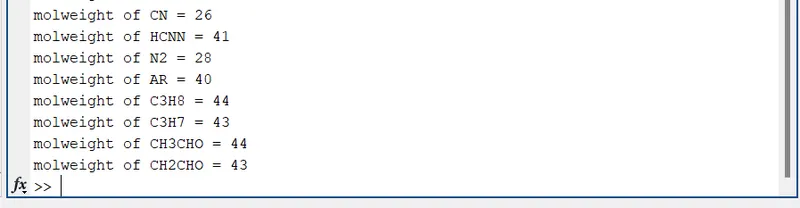
- Calculate the molecular weight of each species and display it in the command window.
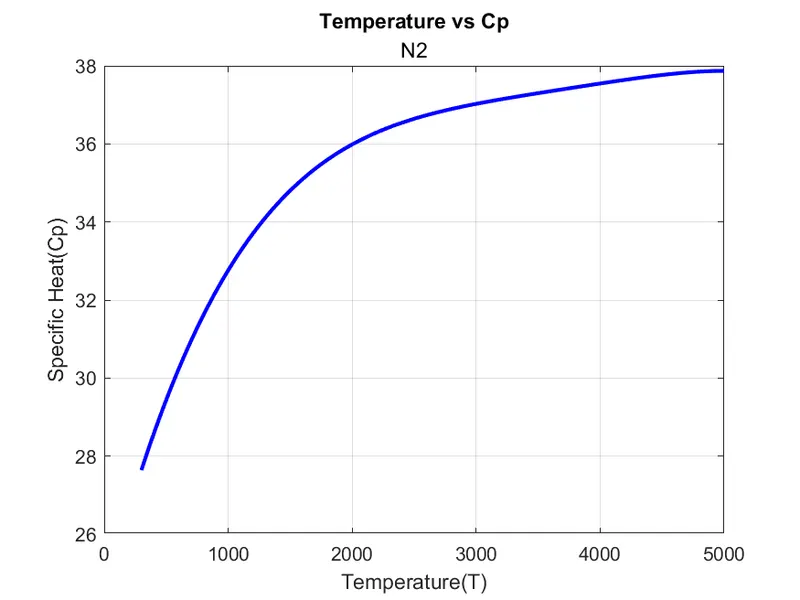
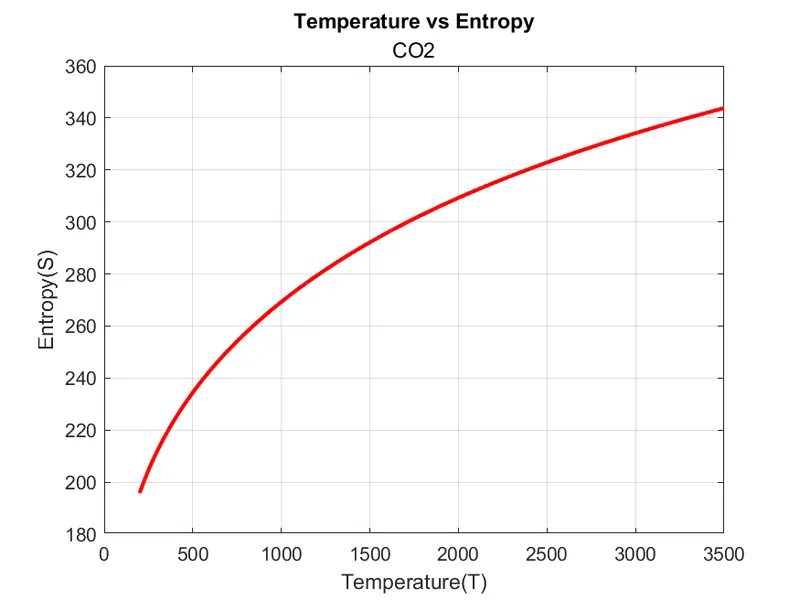
- Plot the Cp, Enthalpy, and Entropy for the local temperature range (low temperature: high temperature) specific for each species.
- Attaching the plots for species O2, N2, and CO2
- Save the plots as images with appropriate names and dump them in separate folders for each species with a suitable name.
NASA THERMODYNAMIC DATA: This data contains temperature ranges polynomials that can be used to evaluate thermodynamic properties such as Cp, H, and S. Each species contains 14 coefficients and temperature ranges and we are required to parse these 14 coefficients to find the enthalpy, entropy, and specific heat for the data. The first Seven coefficients are "HIGH-TEMPERATURE COEFFICIENTS" and the remaining seven are "LOW-TEMPERATURE COEFFICIENTS."
THEORY:
File Parsing: It means to split the file or some other inputs into a piece of data that can be easily stored or manipulated. This leads to the splitting of a string into different parts to convert the same into something less complex. This aims at initiating some kind of transformation in data. In this scenario, we have to split the NASA thermodynamic data which is having 53 gas species.
Enthalpy(H): Thermodynamic quantity. It is the sum of the system's internal energy and the product of its pressure and volume.
Entropy(S): Is a thermodynamic quantity, which is a measure of the degree of randomness of a system. Also, a measure of the system's thermal energy per unit temperature.
Specific Heat(Cp): It is defined as the amount of heat required to raise the temperature of the unit mass of a substance by 1 degree.
Molecular weight: Molecular weight is a measure of the sum of the atomic weight values of the atoms in a molecule.
Temperature(T): It is the degree of measurement for the hotness or coldness of an object. It is a physical quantity.
Gas Constant (R): It is a physical constant expressed in terms of units of energy per temperature increment per mole.Value of R=8.314 (Also Known as the "Universal gas constant."
Governing Equations:
To calculate Specific heat, Entropy and Enthalpy using Universal Gas constant "R" and Temperature "T".
CODE:
clear all
close all
clc
f1 = fopen('THERMO.dat','r'); %Opening the file for reading

%Reading the header information
fgetl(f1);
a = fgetl(f1);

%splitting
b = strsplit(a);

%Converting string cells into numbers.
global_low_temp = str2num(b{2});
global_mid_temp = str2num(b{3});
global_high_temp = str2num(b{4});
fgetl(f1);
fgetl(f1);
fgetl(f1);
R = 8.314  %Universal Gas Constant

%Extracting the species data
for i = 1:53
tline1 = fgetl(f1);
c = strsplit(tline1,' ');         %splitting into cell array
speciesnum = c{1};               %reading name of species
x = length(c);

%converting string to number
local_low = str2num(c{x-3});
local_mid = str2num(c{x-2});
local_high = str2num(c{x-1});

%Finding coefficients

tline2 = fgetl(f1);
c1 = strfind(tline2,'E');
a1 = str2num(tline2(1:c1(1)+3));
a2 = str2num(tline2( c1(1)+4:c1(2)+3));
a3 = str2num(tline2 (c1(2)+4:c1(3)+3));
a4 = str2num (tline2(c1(3)+4:c1(4)+3));
a5 = str2num(tline2(c1(4)+4:c1(5)+3));

tline3 = fgetl(f1);
c2 = strfind(tline3,'E');
a6 = str2num(tline3(1:c2(1)+3));
a7 = str2num(tline3( c2(1)+4:c2(2)+3));
a8 = str2num(tline3 (c2(2)+4:c2(3)+3));
a9 = str2num (tline3(c2(3)+4:c2(4)+3));
a10 = str2num(tline3(c2(4)+4:c2(5)+3));

tline4 = fgetl(f1);
c3 = strfind(tline4,'E');
a11 = str2num(tline4(1:c3(1)+3));
a12 = str2num(tline4( c3(1)+4:c3(2)+3));
a13 = str2num(tline4 (c3(2)+4:c3(3)+3));
a14 = str2num (tline4(c3(3)+4:c3(4)+3));
T = linspace(local_low,local_mid,local_high); %Temperature range

%inserting given equation
%Calculation of Specific heat, Enthalpy and Entropy.
if(T<local_mid)
    cp=R*(a1+a2.*T+a3.*T.^2+a4.*T.^3+a5.*T.^4);
    h=R.*T.*(a8+a9.*T/2+a10.*T.^2/3+a11.*T.^3/4+a12.*T.^4/5+a13./T);
    s = R*(a8*log(T)+a9.*T+a10.*T.^2/2+a11.*T.^3/3+a12.*T.^4/4+a14);
else
    cp=R*(a1+a2.*T+a3.*T.^2+a4.*T.^3+a5.*T.^4);
    h=R.*T.*(a1+a2.*T/2+a3.*T.^2/3+a4.*T.^3/4+a5.*T.^4/5+a6./T);
    s = R*(a1*log(T)+a2.*T+a3.*T.^2/2+a4.*T.^3/3+a5.*T.^4/4+a7);
end

mkdir(speciesnum)%makes folder
cd(speciesnum)%make new folder as current folder

%Plotting Cp vs t (Plot1)
figure(1)
plot(T,cp,'linewidth',2,'color','b');
xlabel('Temperature(T)')
ylabel('Specific Heat(Cp)')
title('Temperature vs Cp',speciesnum)
grid on

%Plotting T vs h (Plot2)
figure(2)
plot(T,h,'linewidth',2,'color','g');
xlabel('Temperature(T)')
ylabel('Enthalpy(H)')
title('Temperature vs Enthalpy',speciesnum)
grid on

%Plotting T vs S(Plot3)
figure(3)
plot(T,s,'linewidth',2,'color','r');
xlabel('Temperature(T)')
ylabel('Entropy(S)')
title('Temperature vs Entropy',speciesnum)
grid on

saveas(1,'Temperature vs cp.png')
saveas(2,'Temperature vs h.png')
saveas(3,'Temperature vs s.png')
cd ..                             %(Exit the current directory)

%calculating molecular weight

Primary = ['O','H','N','A','C'];
mass = [16, 1, 14 ,40 ,12];
molweight = 0;   %Molecular weight starting range
for j = 1:length(speciesnum)
    for k = 1:length(Primary)
        if strcmpi(speciesnum(j),Primary(k))
            molweight = molweight+mass(k);
            p = k;
        end
    end
   n = str2double(speciesnum(j));
   if n>1
       molweight = molweight+(mass(p)*(n-1));
   end
end
q = sprintf('molweight of %s = %d',speciesnum,molweight);
disp(q)
end
Code Steps Explanation:
- Firstly, the "THERMO.dat" file is opened and read using the fopen command.
- Then, we proceed on to read the header information or temperature file using the fgetl command.
- We then split the data using strsplit command into cell arrays and then this string to number using str2num command to find the low, mid, and high temperature.
- The strfind command is used to find string str for shorter strings or patterns and returns starting index of each such occurrence.
- Then we input the parameter R (Universal gas constant).
- We now set on to extract the species data. 53 elements have to be found.
- We use the fgetl command for the same and then split it into cell array to find the species line, name, and then find the number of temperatures in the same species line.
- The linspace command is used to define the temperature range.
- Then, we convert the local low, mid and high data into numbers using str2num.
- We now find coefficients and to read the new coefficients in the new line, we will first find the 'E' string using strfind command to find numbers before and after it and then find remaining coefficients and convert them to numbers.
- In this process, from the coefficients, found, 7 are for higher temperature and the remaining 7 are for lower temperature.
- Now, we insert the function equation to find Specific heat(Cp), Enthalpy(H), and Entropy(S) using the 14 coefficients of lower and higher temperature ranges using the if-else loop.
- If is used to define temperature conditions below medium and else for higher temperature conditions than mid.
- Now, we will make a new folder using the mkdir command and change its directory to the current folder using the cd command.
- We will plot the graphs for Specific heat, Entropy, and Enthalpy against temperature for different species using the plot command.
- The plots for the species are generated using the data present in the "THERMO" File.
- We define the x and y-axis using xlabel and ylabel command and give the title of each graph using the title command. Grid is also turned on for every plot using the grid on command.
- Now all of these graphs are stored using saveas command in the same folder of the main code and Text file.
- The command cd.. is used to exit the current directory.
- The next step is to calculate the molecular weight of different species.
- A function as primary is created main elements defined and mass is assigned.
- Molecular starting range is assigned molweight (Molecular weight)as 0.
- For loop is used to run iteration from 1:length(Primary) and the molecular weight is calculated.
- We use the strcmpi command to make the code case insensitive. Any case can be input to get the species (lower or upper case).
- sprintf command is used to create string variable the molecular weight and displayed using disp command in the command window.
PlOTS: (These Plots are for varying properties against temperature ranges).
PLOTS OF O2
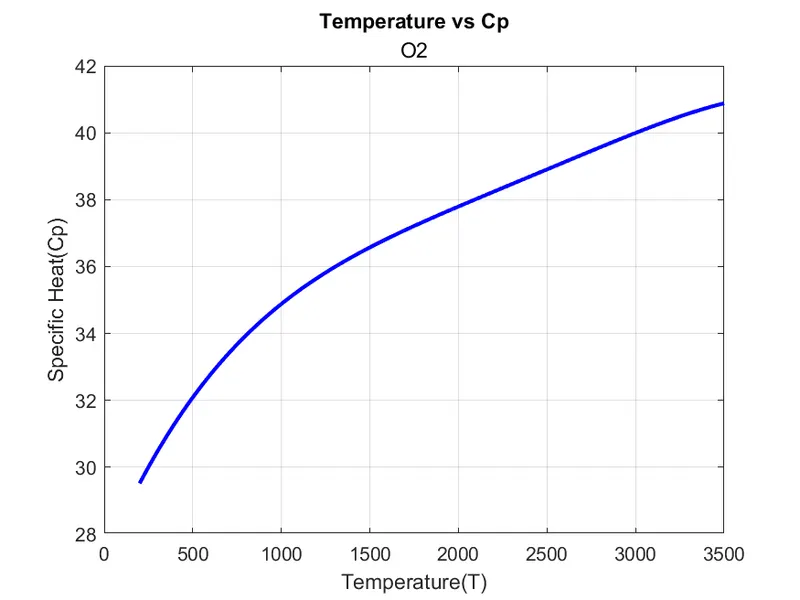
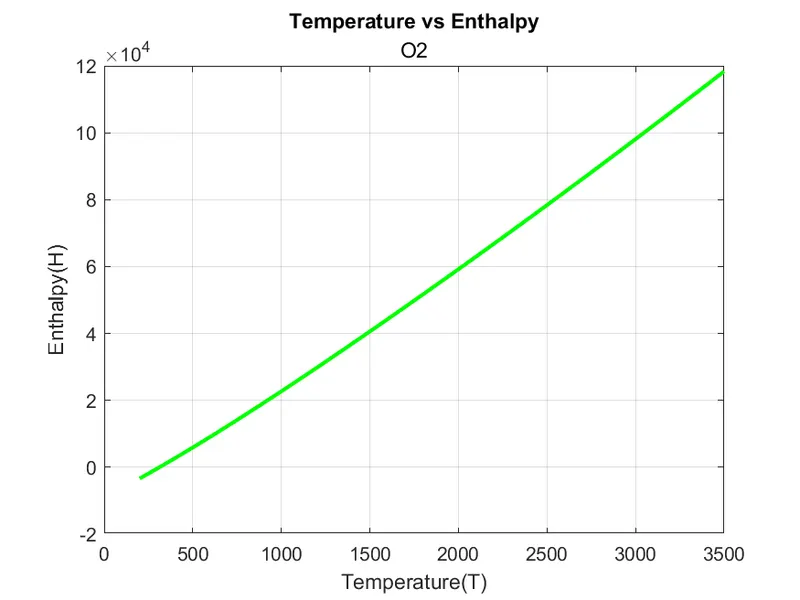
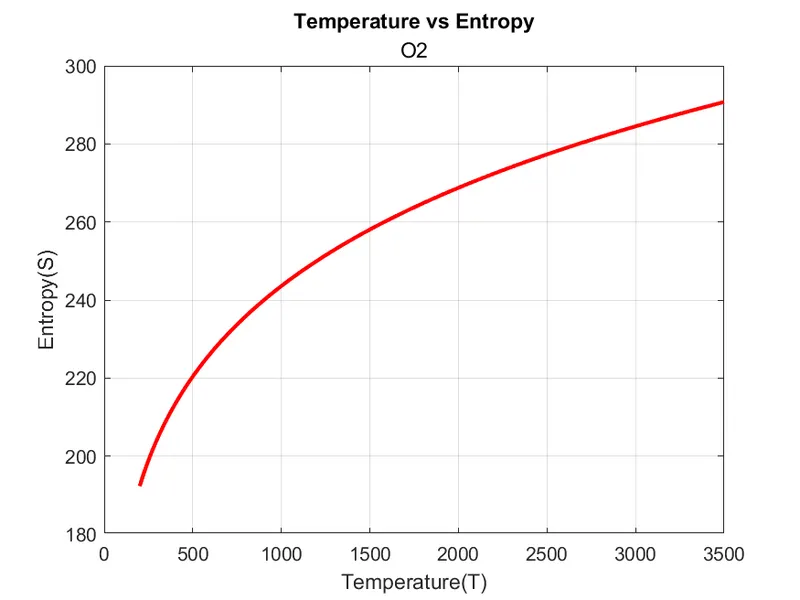
PLOTS FOR N2:
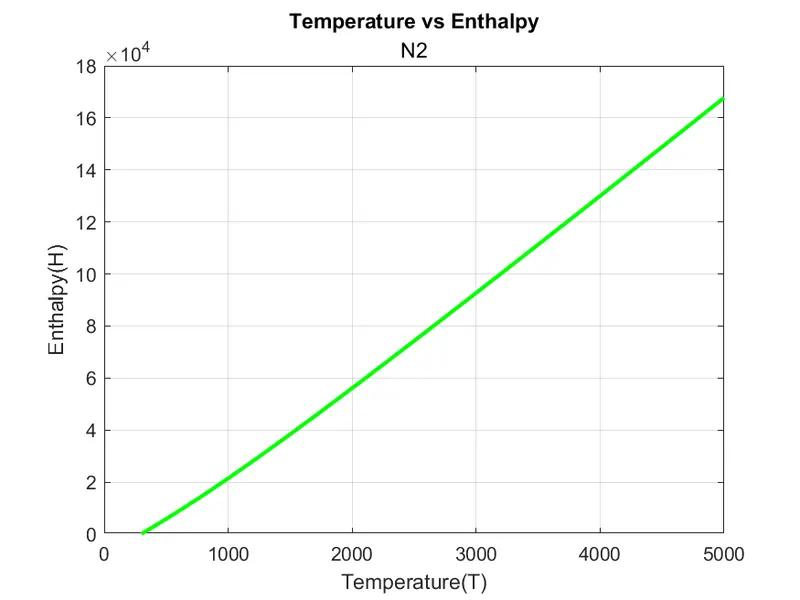
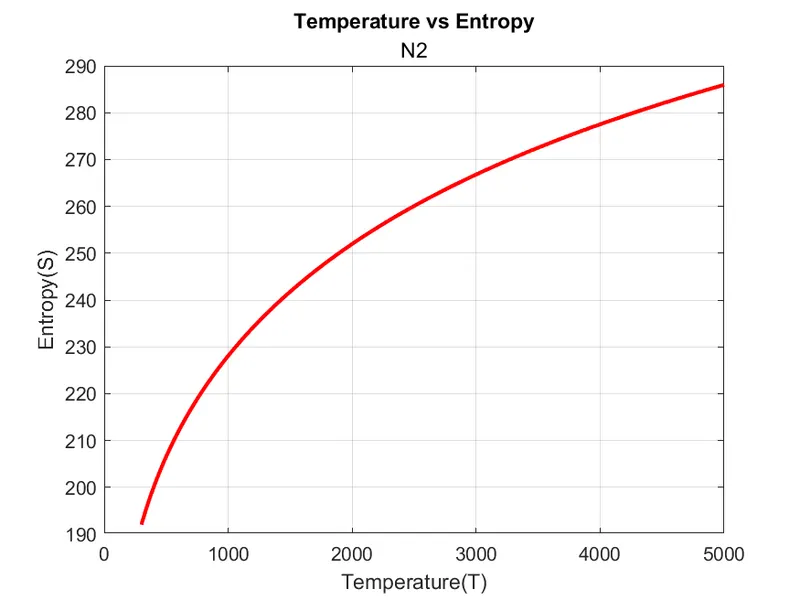
PLOTS FOR CO2
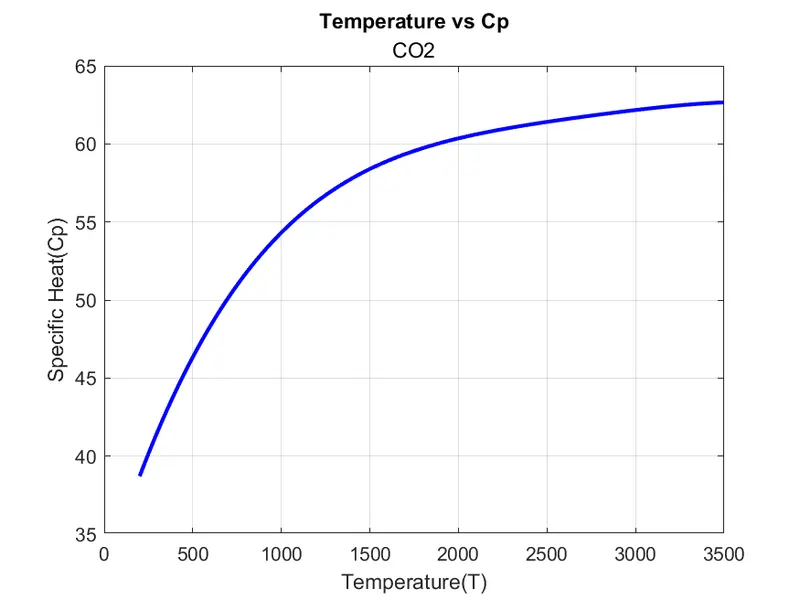
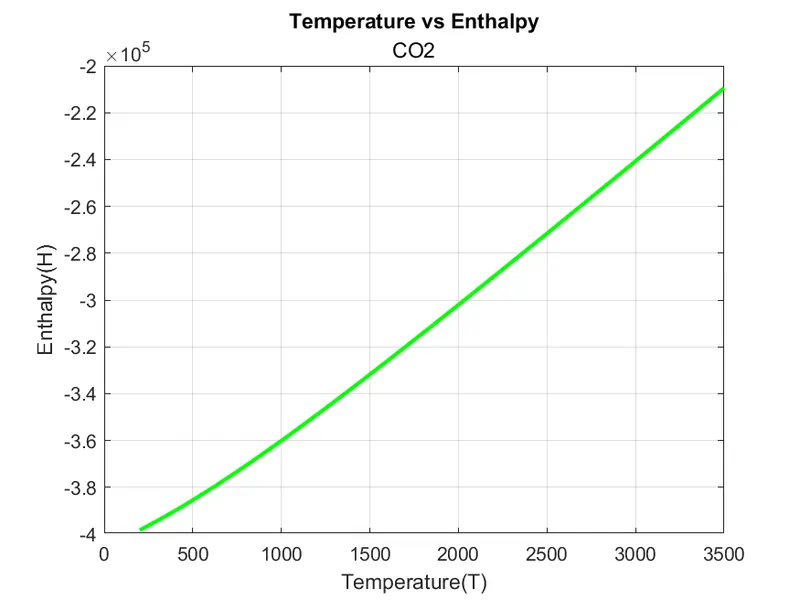
SCREENSHOT OF DIRECTORY WHERE DIFFERENT SPECIES ARE SAVED: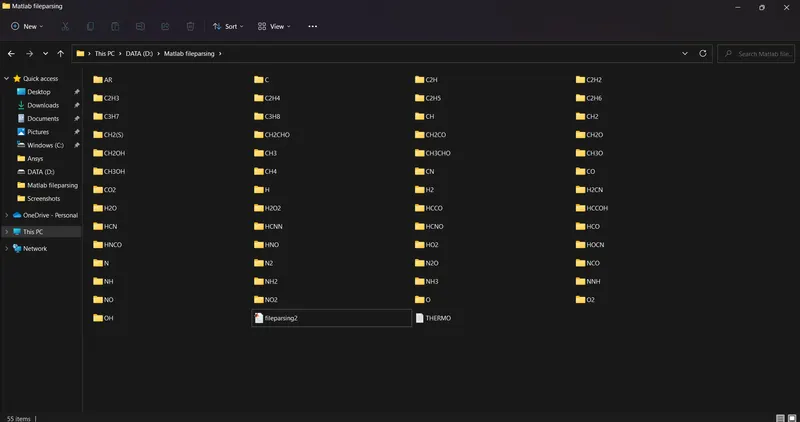
MOLECULAR WEIGHTS OF DIFFERENT SPECIES:
An abbreviation is used for Molecularweights as "molweight"
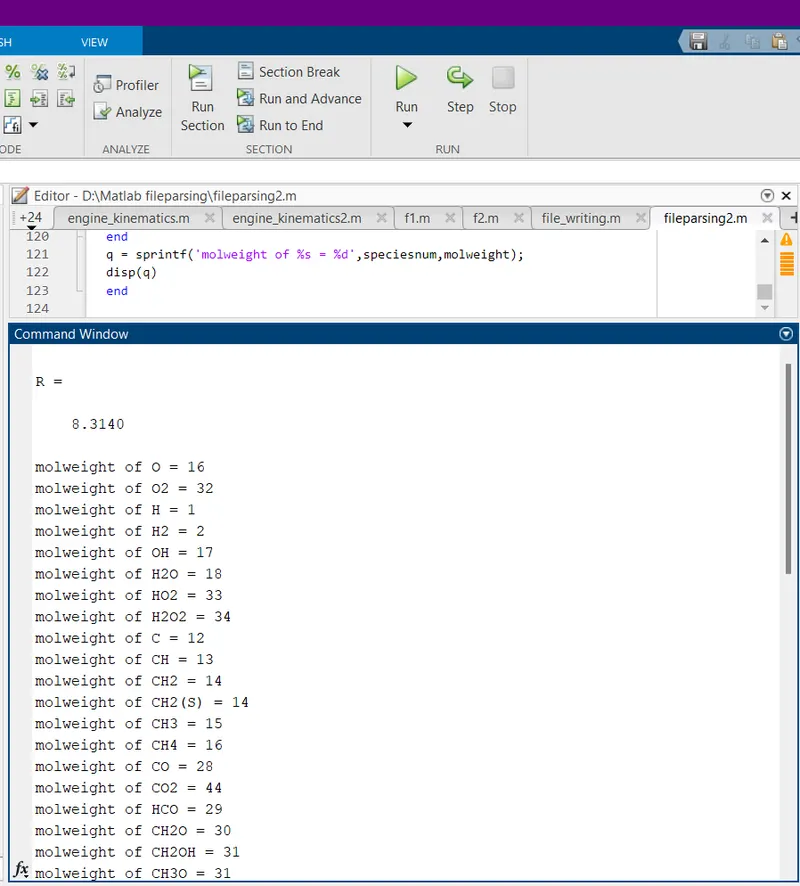
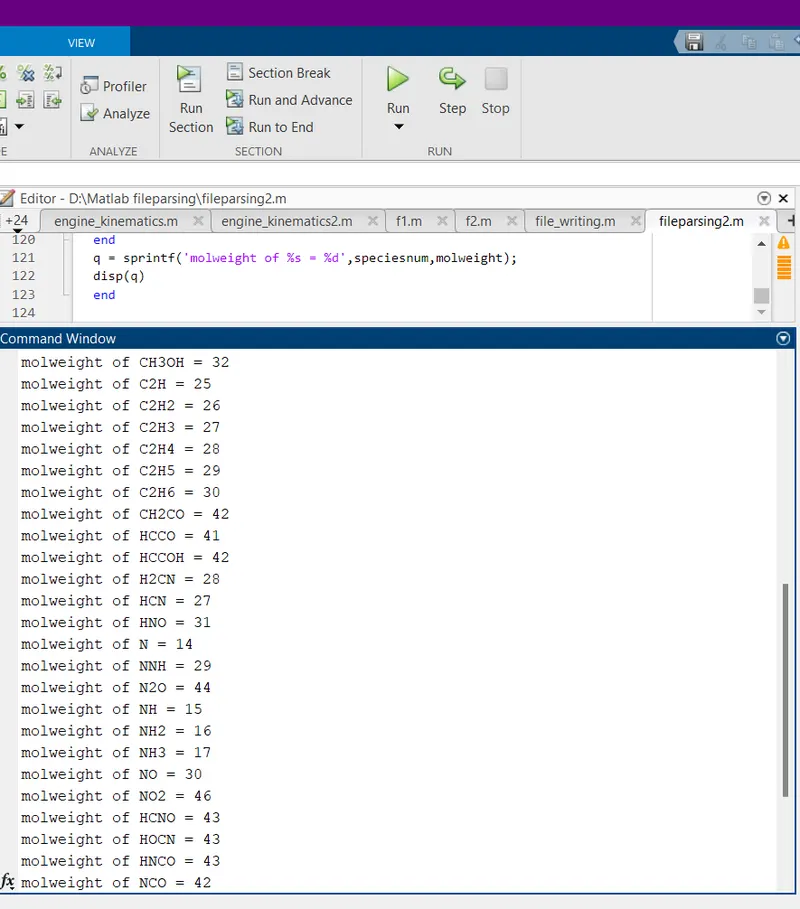
RESULT: The NASA Thermodynamic data is parsed and the required thermodynamic properties have been calculated using the coefficients. Plotting of this data has also been completed and saved successfully. Matlab code has been prepared and the molecular weight of all the species has also been calculated.
GOOGLE DRIVE LINK: https://drive.google.com/drive/folders/1_rXsajikopycHeMUUD4-k0yPXHvqus3-?usp=sharing
REFERENCES:
https://en.wikipedia.org/wiki/Parsing
https://in.mathworks.com/help/matlab/ref/mkdir.html?searchHighlight=mkdir&s_tid=srchtitle_mkdir_1
https://in.mathworks.com/help/matlab/ref/cd.html?searchHighlight=cd&s_tid=srchtitle_cd_1