Project 1 - Parsing NASA thermodynamic data
FileParsing: File parsing consists of reading the output, string, or file content, breaking it up into individual lines of text, and performing operations on the data.
https://drive.google.com/drive/folders/1kkEyV-h1kZu2mQlV16QAOkR2nerfly4o?usp=sharing (Google Drive link to view species information)
THERMO.dat file is the given data file that consists of 14 coefficients in which 7 are high-temperature coefficients and 7 are low-temperature coefficients for the total of 53 given species. These coefficients are used to determine the enthalpy, entropy, and specific heat for the given species.
To determine and analyze the thermodynamic properties of the given species the following terms are required.
Specific Heat: Specific heat capacity of a substance is the heat capacity of a sample of the substance divided by the mass of the sample. It is also the amount of heat required to add to the substance to raise the temperature by one unit, denoted by Cp.
the above image gives the list of formulae to determine the specific heat, enthalpy ad entropy with the coefficients being a1, a2,....., a14 being put forth by NASA which are extracted from the provided data file. The first 7 are the high-temperature coefficient and the next 7 are low-temperature coefficients. T is the temperature and R is the Universal gas constant.
%function to determine specific heat
function Cp= SpecificHeat(a1,a2,a3,a4,a5,a6,a7,a8,a9,a10,a11,a12,TTemperature,R,local_mid_temperature)
%compare it with local temperature values
%if less take minimum coefficients
for i=1:length(TTemperature)
Temperature=TTemperature(i);
if Temperature<=local_mid_temperature
Cp(i)=R*(a8+(a9*Temperature)+(a10*(Temperature).^2)+(a11*(Temperature).^3)+(a12*(Temperature).^4));
else
%else take max coefficients
Cp(i)=R*(a1+(a2*Temperature)+(a3*(Temperature).^2)+(a4*(Temperature).^3)+(a5*(Temperature).^4));
end
end
end
Here the high-temperature coefficients are considered if the temperature is greater than the species local temperature or else the less temperature coefficients are considered.
ENTROPY: This is the measure of a system's thermal energy per unit temperature that is unavailable for doing useful work. Because work is obtained from ordered molecular motion, the amount of entropy is also a measure of the molecular disorder, or randomness, of a system. Entropy is the function of the state of particles or substances. It is denoted by S and is given in the image as the 3rd equation.
%function to determine the Entropy
function S= Entropy_c(a1,a2,a3,a4,a5,a6,a7,a8,a9,a10,a11,a12,a14,TTemperature,R,local_mid_temperature)
for i=1:length(TTemperature)
Temperature=TTemperature(i);
if Temperature<=local_mid_temperature
S(i)=R*((a8.*log(Temperature)+(a9.*Temperature)+((a10*((Temperature).^2)./2)+((a11*((Temperature).^3)./3)+((a12*((Temperature).^4)./4)+a14)))));
else
S(i)=R*((a1.*log(Temperature)+(a2.*Temperature)+((a3*(Temperature).^2)./2)+(((a4*(Temperature).^3)./3)+((a5*(Temperature).^4)./4)+a7)));
end
end
end
ENTHALPY: enthalpy, the sum of the internal energy and the product of the pressure and volume of a thermodynamic system. Enthalpy is an energy-like property or state function—it has the dimensions of energy and is denoted by H in the above equation.
%function to determine the Enthalpy
function H =Enthalpy(a1,a2,a3,a4,a5,a6,a8,a9,a10,a11,a12,a13,TTemperature,R,local_mid_temperature)
for i=1:length(TTemperature)
Temperature=TTemperature(i);
if Temperature<=local_mid_temperature
H(i)=R.*Temperature.*(a8+((a9.*Temperature)./2)+((a10.*(Temperature).^2)./3)+((a11.*(Temperature).^3)./4)+((a12.*(Temperature).^4)/5)+((a13./(Temperature))));
else
H(i)=R.*Temperature.*(a1+((a2.*Temperature)./2)+((a3.*(Temperature).^2)./3)+((a4.*(Temperature).^3)./4)+((a5.*(Temperature).^4)./5)+((a6./(Temperature))));
end
end
end
MOLECULAR WEIGHT: Molecular weight is a measure of the sum of the atomic weight values of the atoms in a molecule. It is measured in Daltons.
function MolecularWeight= Molecular_Weight(species_coeff)
atomic_name=['H','O','C','N','A'];
fprintf('Molecular Weight of ');
fprintf(species_coeff);
fprintf(':');
Atomic_Weight=[1.008 15.999 12.011 14.007 39.948];
MolecularWeight=0;
for i=1:length(species_coeff)
for j=1:length(atomic_name)
if strcmp(species_coeff(i),atomic_name(j))
MolecularWeight= MolecularWeight+Atomic_Weight(j);
position=j;
end
end
n=str2num(species_coeff(i));
if n>1
MolecularWeight=MolecularWeight+Atomic_Weight(position)*(n-1);
end
end
fprintf('molecular weight %s:',species_coeff);
fprintf('%d',MolecularWeight);
disp(' ');
end
MAIN FILE PARSING CODE
clear all %to clear workspace
close all %to close plots
clc %clear command window
file_thermo= fopen('THERMO.dat','r'); %opens and reads the thermo file
line1= fgetl(file_thermo); %gives the file heading
line2=fgetl(file_thermo); %gives the global temperature values
line3= fgetl(file_thermo); %comment line in the file
line4= fgetl(file_thermo); %comment line in the file
line5= fgetl(file_thermo); %comment line in the file
R=8.314; %Universal Gas Constant(J/(mol-K))
for i=1:53;
species=fgetl(file_thermo);
A=strsplit(species,' '); %to split 2nd line from file with ' ' delimiter
species_coeff=A{1};
local_low_temperature=str2num(A{end-3}); %to obtain local low temperature from 2 line from string to number
local_mid_temperature=str2num(A{end-1}); %to obtain local mid temperature from 2 line from string to number
local_high_temperature=str2num(A{end-2}); %to obtain local high temperature from 2 line from string to number
line_1=fgetl(file_thermo);
a=strfind(line_1,'E');
Temperature= linspace(local_low_temperature,local_high_temperature,1000);
%to extract the first 7 coefficients(high temperature)
a1= line_1(1:a(1)+3); %coefficient 1
a1=str2num(a1); %to convert str to number
a2=line_1(a(1)+4:a(2)+3); %coefficient 2
a2=str2num(a2);
a3=line_1(a(2)+4:a(3)+3); %coefficient 3
a3=str2num(a3);
a4=line_1(a(3)+4:a(4)+3); %coefficient 4
a4=str2num(a4);
a5=line_1(a(4)+4:a(5)+3); %coefficient 5
a5=str2num(a5);
%to extract coefficients from line 2
line_2=fgetl(file_thermo);
b=strfind(line_2,'E');
a6= line_2(1:b(1)+3); %coefficient 6
a6=str2num(a6);
a7=line_2(a(1)+4:b(2)+3); %coefficient 7
a7=str2num(a7);
%to extract 7 low temperature co_efficients
a8=line_2(b(2)+4:b(3)+3); %coefficient 8
a8=str2num(a8);
a9=line_2(b(3)+4:b(4)+3); %coefficient 9
a9=str2num(a9);
a10=line_2(b(4)+4:b(5)+3); %coefficient 10
a10=str2num(a10);
%to extract coefficients from line 3
line_3=fgetl(file_thermo);
c=strfind(line_3,'E');
a11= line_3(1:c(1)+3); %coefficient 11
a11=str2num(a11);
a12=line_3(c(1)+4:c(2)+3); %coefficient 12
a12=str2num(a12);
a13=line_3(c(2)+4:c(3)+3); %coefficient 13
a13=str2num(a13);
a14=line_3(c(3)+4:c(4)+3); %coefficient 14
a14=str2num(a14);
%determination of specific heat
Cp= SpecificHeat(a1,a2,a3,a4,a5,a6,a7,a8,a9,a10,a11,a12,Temperature,R,local_mid_temperature);
%to calculate Enthalpy
H =Enthalpy(a1,a2,a3,a4,a5,a6,a8,a9,a10,a11,a12,a13,Temperature,R,local_mid_temperature);
%to calcuate entropy
S= Entropy_c(a1,a2,a3,a4,a5,a6,a7,a8,a9,a10,a11,a12,a14,Temperature,R,local_mid_temperature);
MolecularWeight(i)= Molecular_Weight(species_coeff);
%to read and write Molecular list
Molecular_list=fopen('MolecularWeight.txt','a+');
fprintf(Molecular_list,'Molecular Weight of species');
fclose(Molecular_list);
%to save in a folder
%plot 1 specific heat versus variation of temeprature
mkdir('example')
cd('example')
mkdir(species_coeff)
cd(species_coeff)
figure(1)
plot(Temperature,Cp,'linewidth',2);
xlabel('Temperature[K]');
ylabel('Specific Heat[kJ]');
title('Specific heat vs Temperature')
grid on
saveas(figure(1),'Specific Heat.png')
%to plot enthalpy vs temperature
figure(2)
plot(Temperature,H,'linewidth',2);
xlabel('Temperature[K]');
ylabel('Enthalpy[kJ/mol]');
title('Enthalpy vs Temperature')
grid on
saveas(figure(2),'Enthalpy.png')
%to plot entropy vs temperature
figure(3)
plot(Temperature,S,'linewidth',2);
xlabel('Temperature[K]');
ylabel('Entropy[kJ/mol-K]');
title('Entropy vs Temperature')
grid on
saveas(figure(3),'Entropy.png')
cd ..
cd ..
end
EXPLANATION OF THE FILE-PARSING CODE
1: initial commands to clear the command window, workspace, and to close the graph are used.
2: Next step is to read the 'THERMO.dat' file using fopen and 'r' is used to read the file.
3: to read the line in the text file we use 'fgetl' command.
4: using 'strsplit' to split temperature values into a particular string cell to get the temperature range.
5: 'str2num' to convert string to number format.
6:skip the initial 3 lines from the data file as there are not required
7: using for and end loops to read the values of the coefficients based on the position of E by using strfind.
8: mention the number of species at the beginning of the for loop to get the coefficients for all which is 53.
9: write functions to determine the thermodynamic properties such as specific heat, enthalpy, and entropy.
10: call these functions into the main code.
11: Write a separate function to calculate the molecular mass and call the same function.
12:Plot the graphs using the plot command for Cp, H and S and saving them in a directory which is created using mkdir and cd to change the working directory.
SYNTAX:
fopen: open a file and obtain information
'r': open the file to read
fgetl : to read line in the file
strsplit : to split string with the position of a specific delimiter
strfind: find one string
mkdir: to create a directory
cd : change working directory
fprintf: to print the data
following is the screenshot of the folder containing all the species information

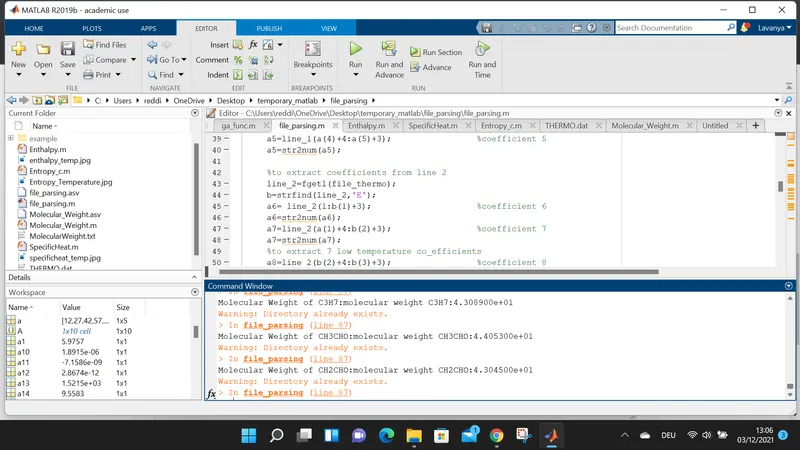
Another screenshot of the command window where the molecular weight for each species are calculated.
in the respective folder for each species, the 3 graphs are been saved. here is the example of graph for the Oxygen atom
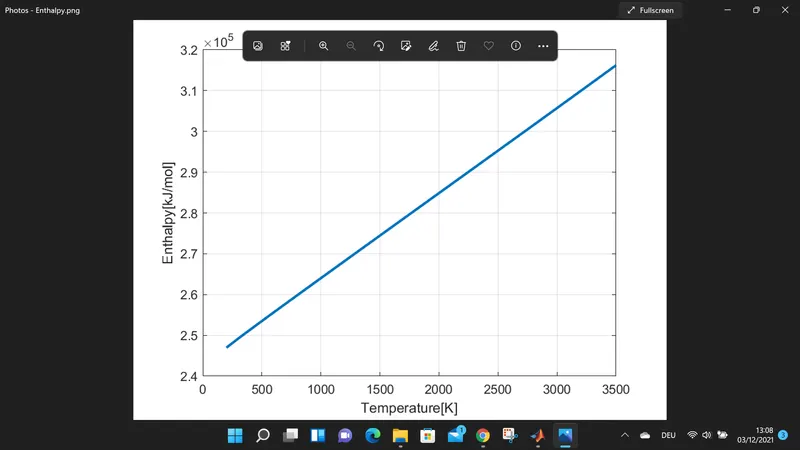
The above graph shows the linear variation of enthalpy against temperature for the Oxygen.
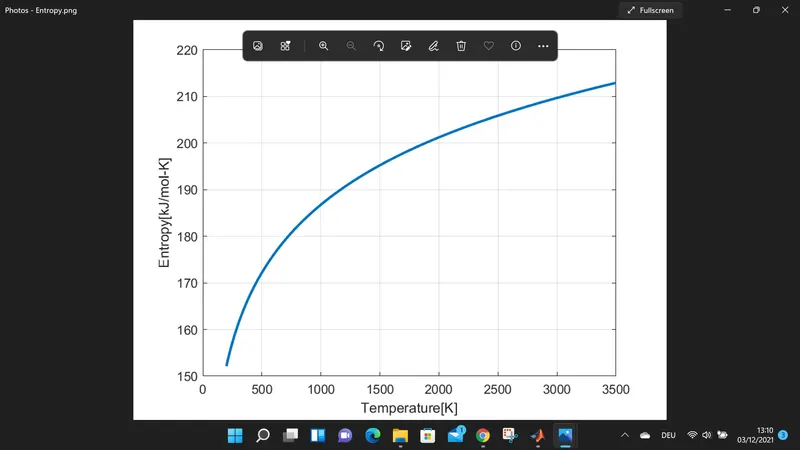
The above graph depicts the cubic variation of enthalpy for the change in temperature.
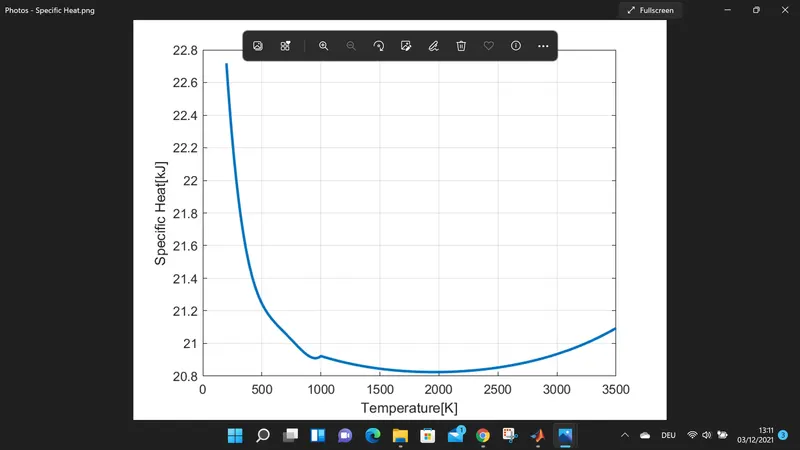
the above graph shows the specific heat variation for change in temperature.
clear all                        %to clear workspace
close all                        %to close plots
clc                              %clear command window


file_thermo= fopen('THERMO.dat','r');                  %opens and reads the thermo file
line1= fgetl(file_thermo);                             %gives the file heading
line2=fgetl(file_thermo);                              %gives the global temperature values
line3= fgetl(file_thermo);                             %comment line in the file
line4= fgetl(file_thermo);                             %comment line in the file
line5= fgetl(file_thermo);                             %comment line in the file


R=8.314;                                                     %Universal Gas Constant(J/(mol-K))

for i=1:53;
    species=fgetl(file_thermo);
    A=strsplit(species,' ');                                 %to split 2nd line from file with ' ' delimiter
    species_coeff=A{1};
    local_low_temperature=str2num(A{end-3});                  %to obtain local  low temperature from 2 line from string to number
    local_mid_temperature=str2num(A{end-1});                  %to obtain local  mid temperature from 2 line from string to number
    local_high_temperature=str2num(A{end-2});                 %to obtain local  high temperature from 2 line from string to number


    line_1=fgetl(file_thermo);
    a=strfind(line_1,'E');
    Temperature= linspace(local_low_temperature,local_high_temperature,1000);
    %to extract the  first 7 coefficients(high temperature)
    a1= line_1(1:a(1)+3);                     %coefficient 1
    a1=str2num(a1);                           %to convert str to number
    a2=line_1(a(1)+4:a(2)+3);                 %coefficient 2
    a2=str2num(a2);
    a3=line_1(a(2)+4:a(3)+3);                 %coefficient 3
    a3=str2num(a3);
    a4=line_1(a(3)+4:a(4)+3);                 %coefficient 4
    a4=str2num(a4);
    a5=line_1(a(4)+4:a(5)+3);                 %coefficient 5
    a5=str2num(a5);

    %to extract coefficients from line 2
    line_2=fgetl(file_thermo);
    b=strfind(line_2,'E');
    a6= line_2(1:b(1)+3);                     %coefficient 6
    a6=str2num(a6);
    a7=line_2(a(1)+4:b(2)+3);                 %coefficient 7
    a7=str2num(a7);
    %to extract 7 low temperature co_efficients
    a8=line_2(b(2)+4:b(3)+3);                 %coefficient 8
    a8=str2num(a8);

    a9=line_2(b(3)+4:b(4)+3);                 %coefficient 9
    a9=str2num(a9);

    a10=line_2(b(4)+4:b(5)+3);                %coefficient 10
    a10=str2num(a10);
    %to extract coefficients from line 3
    line_3=fgetl(file_thermo);
    c=strfind(line_3,'E');
    a11= line_3(1:c(1)+3);                     %coefficient 11
    a11=str2num(a11);
    a12=line_3(c(1)+4:c(2)+3);                 %coefficient 12
    a12=str2num(a12);
    a13=line_3(c(2)+4:c(3)+3);                  %coefficient 13
    a13=str2num(a13);
    a14=line_3(c(3)+4:c(4)+3);                   %coefficient 14
    a14=str2num(a14);

    %determination of specific heat
    Cp= SpecificHeat(a1,a2,a3,a4,a5,a6,a7,a8,a9,a10,a11,a12,Temperature,R,local_mid_temperature);
    %to calculate Enthalpy
    H =Enthalpy(a1,a2,a3,a4,a5,a6,a8,a9,a10,a11,a12,a13,Temperature,R,local_mid_temperature);
    %to calcuate entropy
    S= Entropy_c(a1,a2,a3,a4,a5,a6,a7,a8,a9,a10,a11,a12,a14,Temperature,R,local_mid_temperature);

    MolecularWeight(i)= Molecular_Weight(species_coeff);
    %to read and write Molecular list
    Molecular_list=fopen('MolecularWeight.txt','a+');
    fprintf(Molecular_list,'Molecular Weight of species');
    fclose(Molecular_list);

    %to save in a folder


    %plot 1 specific heat versus variation of temeprature
    mkdir('example')
    cd('example')
    mkdir(species_coeff)
    cd(species_coeff)
    figure(1)
    plot(Temperature,Cp,'linewidth',2);
    xlabel('Temperature[K]');
    ylabel('Specific Heat[kJ]');
    title('Specific heat vs Temperature')
    grid on
    saveas(figure(1),'Specific Heat.png')

    %to plot enthalpy vs temperature
    figure(2)
    plot(Temperature,H,'linewidth',2);
    xlabel('Temperature[K]');
    ylabel('Enthalpy[kJ/mol]');
    title('Enthalpy vs Temperature')
    grid on
    saveas(figure(2),'Enthalpy.png')

    %to plot entropy vs temperature
    figure(3)
    plot(Temperature,S,'linewidth',2);
    xlabel('Temperature[K]');
    ylabel('Entropy[kJ/mol-K]');
    title('Entropy vs Temperature')
    grid on
    saveas(figure(3),'Entropy.png')

    cd ..
    cd ..
end

%function to determine the Enthalpy
function H =Enthalpy(a1,a2,a3,a4,a5,a6,a8,a9,a10,a11,a12,a13,TTemperature,R,local_mid_temperature)
 for i=1:length(TTemperature)
    Temperature=TTemperature(i);
if Temperature<=local_mid_temperature
    H(i)=R.*Temperature.*(a8+((a9.*Temperature)./2)+((a10.*(Temperature).^2)./3)+((a11.*(Temperature).^3)./4)+((a12.*(Temperature).^4)/5)+((a13./(Temperature))));
else
       H(i)=R.*Temperature.*(a1+((a2.*Temperature)./2)+((a3.*(Temperature).^2)./3)+((a4.*(Temperature).^3)./4)+((a5.*(Temperature).^4)./5)+((a6./(Temperature))));

end
 end
end

%function to determine specific heat
function Cp= SpecificHeat(a1,a2,a3,a4,a5,a6,a7,a8,a9,a10,a11,a12,TTemperature,R,local_mid_temperature)
%compare it with local temperature values
%if less take minimum coefficients
 for i=1:length(TTemperature)
    Temperature=TTemperature(i);
if Temperature<=local_mid_temperature
    Cp(i)=R*(a8+(a9*Temperature)+(a10*(Temperature).^2)+(a11*(Temperature).^3)+(a12*(Temperature).^4));

else
    %else take max coefficients
    Cp(i)=R*(a1+(a2*Temperature)+(a3*(Temperature).^2)+(a4*(Temperature).^3)+(a5*(Temperature).^4));
end
 end
end

%function to determine the Entropy
function S= Entropy_c(a1,a2,a3,a4,a5,a6,a7,a8,a9,a10,a11,a12,a14,TTemperature,R,local_mid_temperature)
for i=1:length(TTemperature)
    Temperature=TTemperature(i);
    if Temperature<=local_mid_temperature
        S(i)=R*((a8.*log(Temperature)+(a9.*Temperature)+((a10*((Temperature).^2)./2)+((a11*((Temperature).^3)./3)+((a12*((Temperature).^4)./4)+a14)))));
    else
        S(i)=R*((a1.*log(Temperature)+(a2.*Temperature)+((a3*(Temperature).^2)./2)+(((a4*(Temperature).^3)./3)+((a5*(Temperature).^4)./4)+a7)));
    end
end
end


function MolecularWeight= Molecular_Weight(species_coeff)
atomic_name=['H','O','C','N','A'];
fprintf('Molecular Weight of ');
fprintf(species_coeff);
fprintf(':');
Atomic_Weight=[1.008 15.999 12.011 14.007 39.948];
MolecularWeight=0;

for i=1:length(species_coeff)
    for j=1:length(atomic_name)
        if strcmp(species_coeff(i),atomic_name(j))
            MolecularWeight= MolecularWeight+Atomic_Weight(j);
            position=j;
        end
    end
    n=str2num(species_coeff(i));
    if n>1
        MolecularWeight=MolecularWeight+Atomic_Weight(position)*(n-1);
    end
end
fprintf('molecular weight %s:',species_coeff);
fprintf('%d',MolecularWeight);
disp(' ');
end
References
https://en.wikipedia.org/wiki/Molecular_mass
https://www.britannica.com/science/enthalpy
Skill lync support and projects.