Project 1 - Parsing NASA thermodynamic data
Program to execute the Species of Specific heat, Enthalpy and Entropy from a THERMO.dat file.
clear all
close all
clc
f1 = fopen('THERMO.dat','r'); --- To open the .dat file
%skipping first 5 lines
for i = 1:5
fgetl(f1);
end
% reading all species
for i = 1:53
r = fgetl(f1); ---- Read the file
m = strsplit(r,' '); --- Split the line
species_name=(m{1});
z=length(m); --- Describes the length of the line
%temperature
local_low_temp=str2num(m{z-3}); --- Read the three different temperature
local_high_temp=str2num(m{z-2});
local_mid_temp=str2num(m{z-1});
temp1 = local_low_temp;
temp2 = local_mid_temp;
temp3 = local_high_temp;
%getting first line coefficient(a1-a5)
line_1 = fgetl(f1);
a = findstr(line_1,'E'); --- This code describes to find the string characters in the line_1
a1 = str2num(line_1(1:(a(1)+3))); --- change string to number and describes the range of a first coeff. a1
a2 = str2num(line_1(a(1)+4:(a(2)+3)));
a3 = str2num(line_1(a(2)+4:(a(3)+3)));
a4 = str2num(line_1(a(3)+4:(a(4)+3)));
a5 = str2num(line_1(a(4)+4:(a(5)+3)));
%getting second line coefficient(a6-a10)
line_2 = fgetl(f1);
t2 = findstr(line_2,'E');
a6 = str2num(line_2(1:(t2(1)+3)));
a7 = str2num(line_2(t2(1)+4:(t2(2)+3)));
a8 = str2num(line_2(t2(2)+4:(t2(3)+3)));
a9 = str2num(line_2(t2(3)+4:(t2(4)+3)));
a10 = str2num(line_2(t2(4)+4:(t2(5)+3)));
%getting third line coefficient(a7-a14)
line_3 = fgetl(f1);
t3 = findstr(line_3,'E');
a11 = str2num(line_3(1:t3(1)+3));
a12 = str2num(line_3(t3(1)+4:t3(2)+3));
a13 = str2num(line_3(t3(2)+4:t3(3)+3));
a14 = str2num(line_3(t3(3)+4:t3(4)+3));
%temperature range for all species
T = linspace(temp1,temp3,1000);
% universal gas constant
R = 8.314;
mkdir(['C:\Users\rajpr\Documents\MATLAB\nasa thermo\',species_name])
% to get array of specific heat, enthalpy and entropy
for k = 1:length(T)
% compare the species temperature to assign the coefficients
%a1-a7 - high temperature coefficients & a8-a14 - low temperature coefficients
if T(k)>temp2
% high temperature coefficients
Cp = (a1+a2.*T+a3.*T.^2+a4.*T.^3+a5.*T.^4)*R;
H = (a1+(a2.*T)/2+(a3.*T.^2)/3+(a4.*T.^3)/4+(a5.*T.^4)/5+(a6./T))*R.*T;
S = (a1.*log(T)+a2.*T+(a3.*T.^2)/2+(a4.*T.^3)/3+(a5.*T.^4)/4+a7)*R;
else
% low temperature coefficients
Cp = (a8+a9.*T+a10.*T.^2+a11.*T.^3+a12.*T.^4)*R;
H = (a8+(a9.*T)/2+(a10.*T.^2)/3+(a11.*T.^3)/4+(a12.*T.^4)/5+(a13./T))*R.*T;
S = (a8.*log(T)+a9.*T+(a10.*T.^2)/2+(a11.*T.^3)/3+(a12.*T.^4)/4+a14)*R;
end
end
%plotting the graph for temperature Vs specific heat,enthalpy & entropy of species
figure(1)
plot(T,Cp)
grid on
title(species_name)
xlabel('temperature')
ylabel('specific heat')
figure(2)
plot(T,H)
grid on
title(species_name)
xlabel('temperature')
ylabel('Enthalpy')
figure(3)
plot(T,S)
grid on
title(species_name)
xlabel('temperature')
ylabel('Entropy')
%change directory to save the file
cd(['C:\Users\rajpr\Documents\MATLAB\nasa thermo\',species_name])
saveas(1,'specific heat','jpg')
saveas(2,'Enthalpy','jpg')
saveas(3,'Entropy','jpg')
%molecular mass calculation
elements = ['H','C','O','N','A']
atomic_weight = [1.0079 12.0107 15.999 14.0067 39.948];
mol_mass = 0;
for L=1:length(species_name)
for M=1:length(atomic_weight)
if strcmp(species_name(L),elements(M))
mol_mass=mol_mass+atomic_weight(M);
position=M;
end
end
n=str2num(species_name(L));
if n>1
mol_mass=mol_mass+atomic_weight(position)*(n-1);
end
end
sprintf('Molecular Weight of %s:%f u',species_name,mol_mass)
end
fclose(f1) --- to close the file f1
Output:
The graph for all species saved in the folder as shown below:
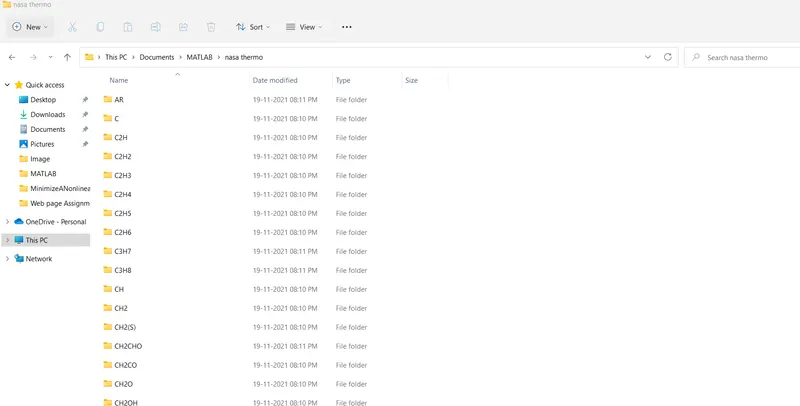
1. Graph for 'AR' as shown below
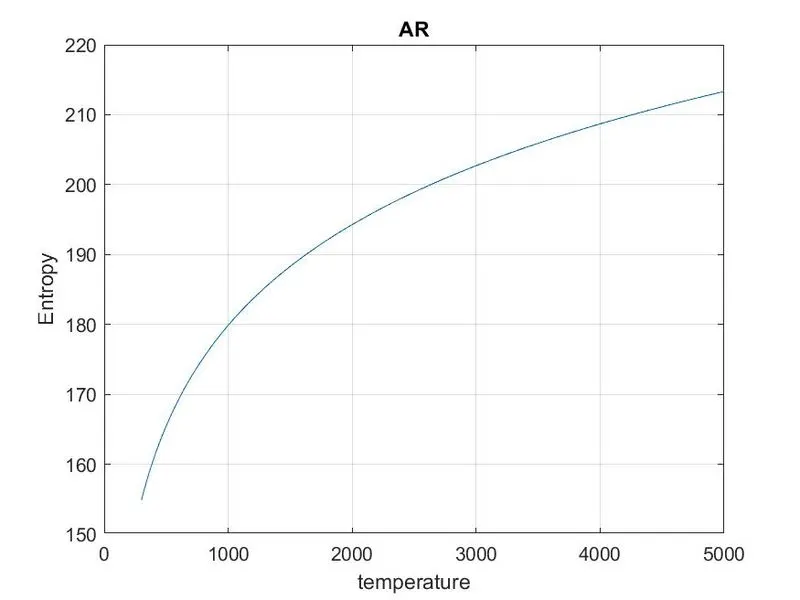
Temperature Vs Entropy
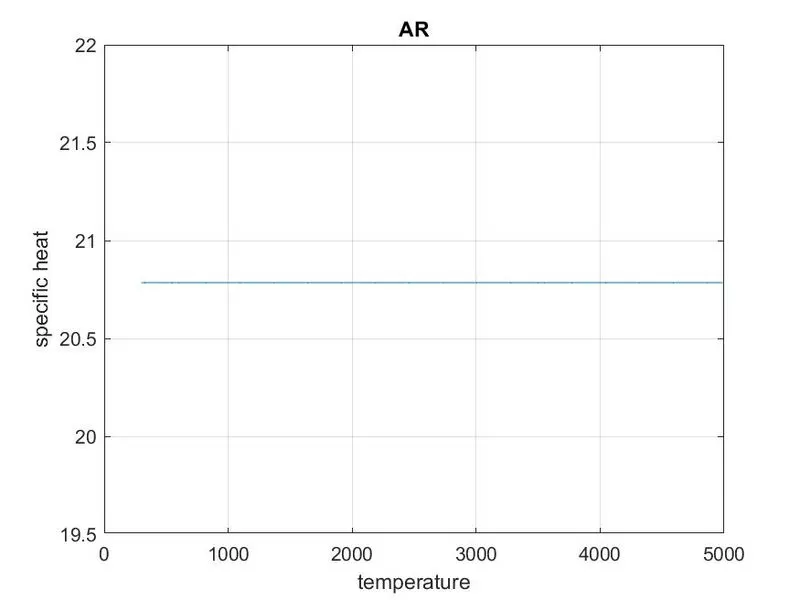
Temperature Vs Specific heat
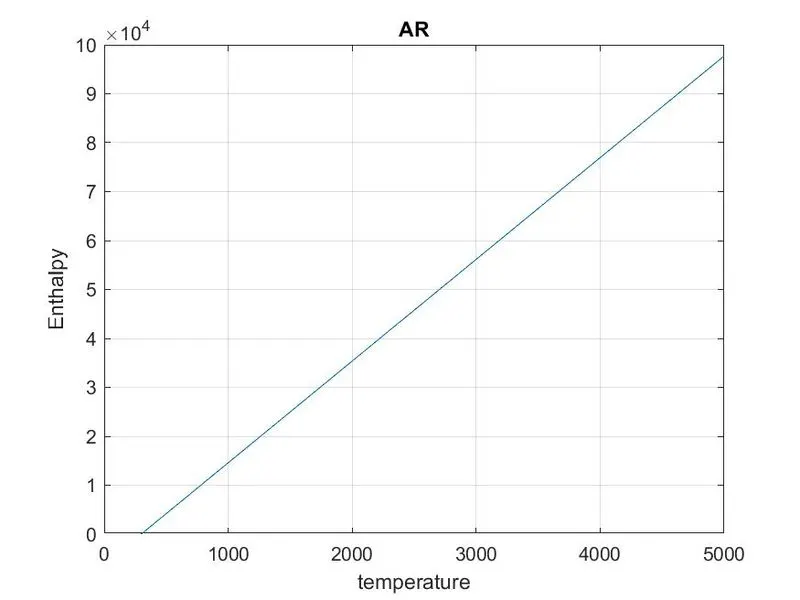
Temperature Vs Enthalpy
2. Graph for 'C' as shown below
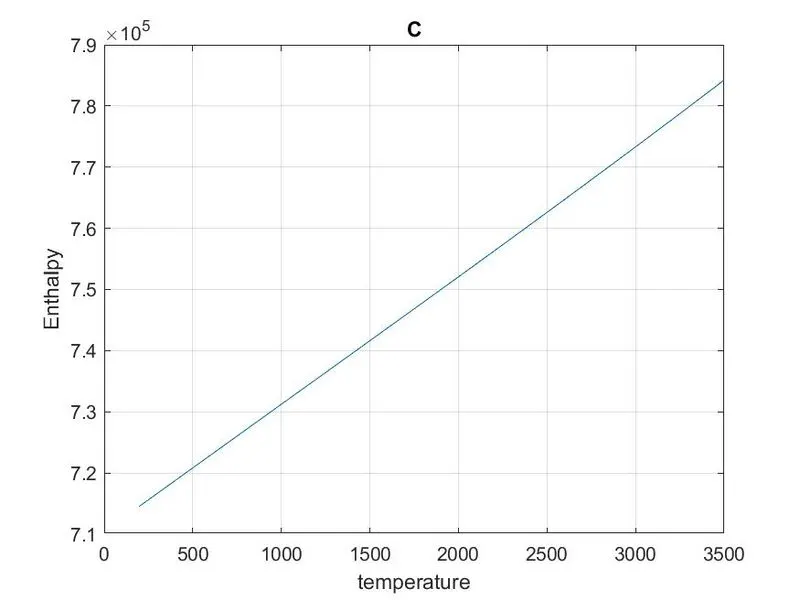
Temperature Vs Enthalpy
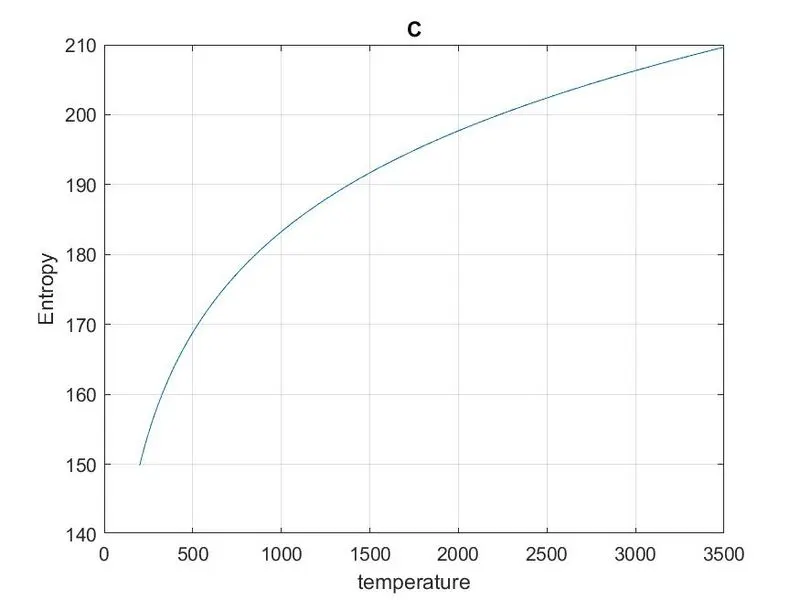
Temperature Vs Entropy
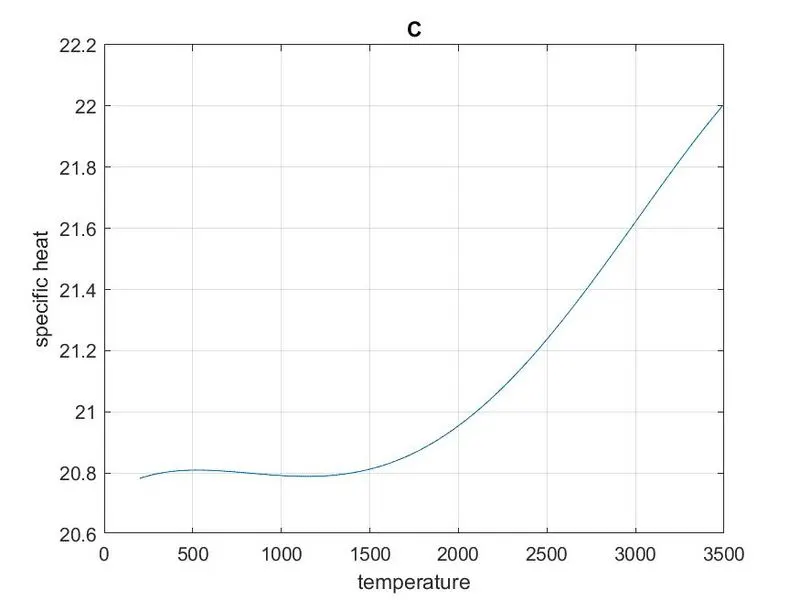
Temperature Vs Specific heat
3. Graph for 'C2H' as shown below
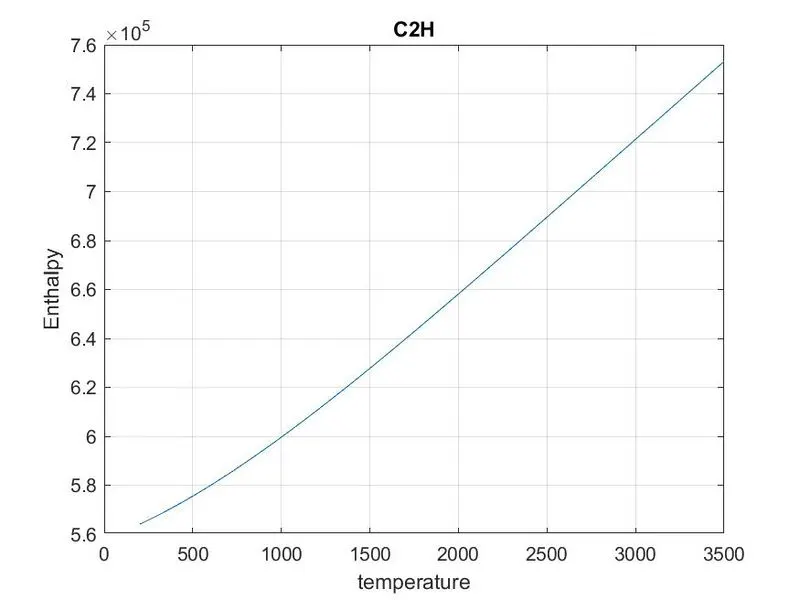
Temperature Vs Enthalpy
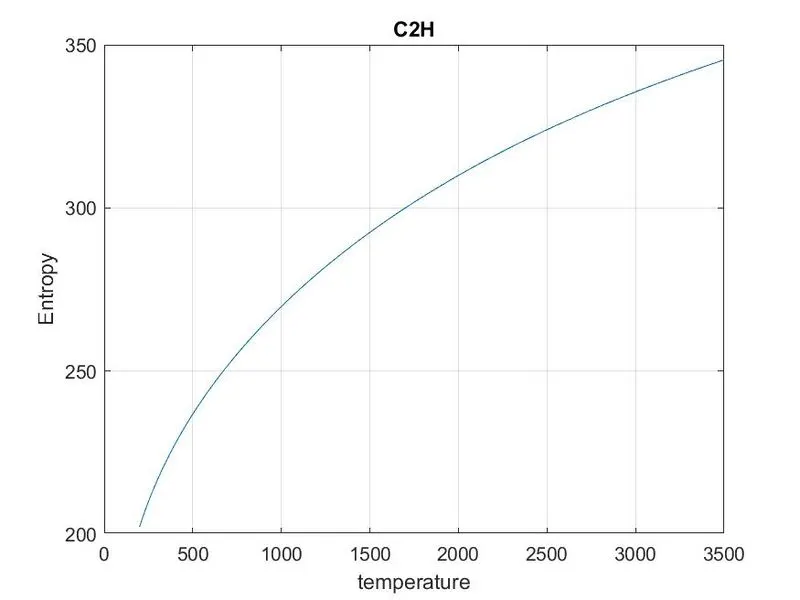
Temperature Vs Entropy
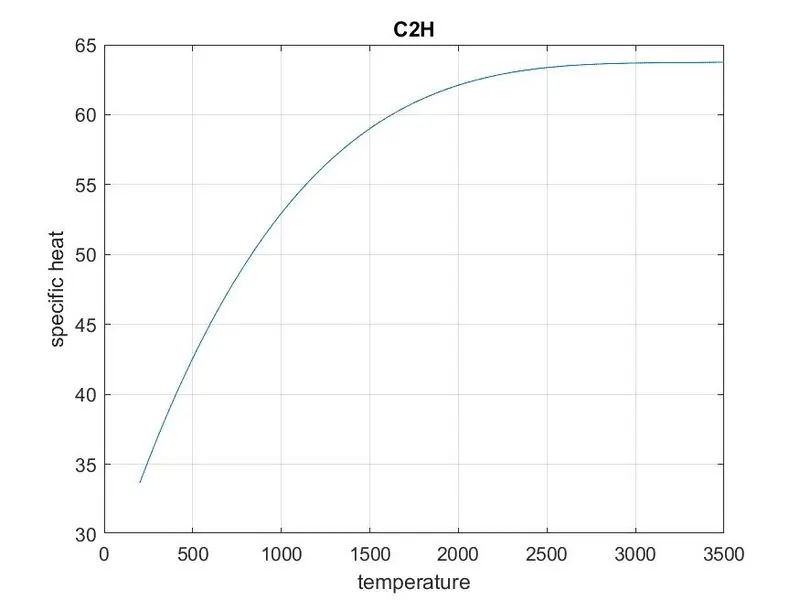
Temperature Vs Specific heat