Project 1 - Parsing NASA thermodynamic data
Aim – By using Mat Lab to study and wrote the given parsing NASA Thermodynamic data file and calculate the thermodynamic properties of various data gas species.
- Write a function that extracts the 14 coefficients and calculate the Enthalpy ,Entropy and constant pressure for all the species.
- Calaculate the molecular weight of the each species
- Plot the H,S and Cp for the local temperature range for each species
- Save the plots as images in new folder by appropriate name
Parsing, syntax analysis, or syntactic analysis is the process of analyzing a sring of symbols, either in natural languges, computer languges
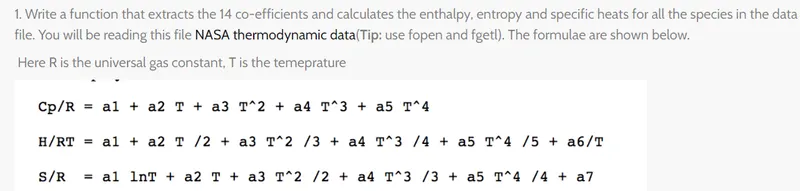
Input Formulas -
Main Code -
% Write the program for Extract the !4 Co-efficient
clear all
close all
clc

% Open file and reading the Data file(THERMO.dot)
f1 = fopen('THERMO.dat','r')

% Heading
Header = fgetl(f1)
% Global temparature values
temp = fgetl(f1)

%splitting
A = strsplit(temp,' ')

% converting string cell into numbers
Global_low_temp = str2num(A{2})
Global_mid_temp = str2num(A{3})
Global_high_temp = str2num(A{4})

%Skipping comments
line3 = fgetl(f1)  % Reading 3rd line form the given data
line4 = fgetl(f1)  % Reading 4th line form the given data
line5 = fgetl(f1)  % Reading 5th line form the given data

% Reading the species
for i = 1:53
    temp_line =fgetl(f1);
    B = strsplit(temp_line,' ')   %splitting in to cell array
    species = (B{1})              %To read the name of species

    % converting string to number
    Local_low_temperature = str2num(B{end-3});
    Local_mid_temperature = str2num(B{end-2});
    Local_high_temperature = str2num(B{end-1});

    tline1 = fgetl(f1);       %getting next line
    a = strfind(tline1,'E')   %Finding the string E

 % Finding the first 7 higher co-efficients and second 7 lower coefficients
 % To finding the higher co-efficients
 a1= tline1(1:a(1)+3);
 a1= str2num(a1);

 a2= tline1(a(1)+4:a(2)+3);
 a2= str2num(a2);

 a3= tline1(a(2)+4:a(3)+3);
 a3= str2num(a3);

 a4= tline1(a(3)+4:a(4)+3);
 a4= str2num(a4);

 a5= tline1(a(4)+4:a(5)+3);
 a5= str2num(a5);

 tline2=fgetl(f1);
 b=strfind(tline2,'E');

 a6= tline2(1:b(1)+3);
 a6= str2num(a6);

 a7= tline2(b(1)+4:b(2)+3);
 a7= str2num(a7);

% To finding the lower co-efficients

 a8= tline2(b(2)+4:b(3)+3);
 a8= str2num(a8);

 a9= tline2(b(3)+4:b(4)+3);
 a9= str2num(a9);

 a10= tline2(b(4)+4:b(5)+3);
 a10= str2num(a10);

 tline3=fgetl(f1);
 c=strfind(tline3,'E');

 a11= tline3(1:c(1)+3);
 a11= str2num(a11);

 a12= tline3(c(1)+4:c(2)+3);
 a12= str2num(a12);

 a13= tline3(c(2)+4:c(3)+3);
 a13= str2num(a13);

 a14= tline3(c(3)+4:c(4)+3);
 a14= str2num(a14);


% Calaculate the Specific coefficients -Cp,H,S

        R = 8.314;           % Univesal gasconstent

     % Temperature range
     T=linspace(Local_low_temperature,Local_high_temperature,100);


 R = 8.314;
 for i= 1:length(T)
if (T(i)>Local_mid_temperature)

Cp(i) = R*(a1 + a2*T(i) + a3*(T(i).^2) + a4*(T(i).^3) + a5*(T(i).^4));
H(i)=R*T(i)*(a1 + a2.*T(i)/2+ a3.*T(i).^2/3 + a4.*T(i).^3/4 + a5.*T(i).^4/5 + a6/T(i));
S(i)  = R*(a1*log(T(i)) + a2*T(i) + a3*T(i).^2/2 + a4*T(i).^3/3 + a5*T(i).^4/4 + a7);
else
Cp(i) = R*(a8 + a9*T(i) + a10*(T(i).^2) + a11*(T(i).^3) + a12*(T(i).^4));
H(i)=R*T(i)*(a8 + a9.*T(i)/2 + a10.*T(i).^2/3 + a11.*T(i).^3/4 + a12*T(i).^4/5 + a13/T(i));
S(i)  = R*(a6*log(T(i)) + a7*T(i) + a8*T(i).^2/2 + a9*T(i).^3/3 + a10*T(i).^4/4 + a11);
end
 end

%Plotting for
% Temperture vs specific heat
figure(1)
plot(T,Cp,'lineWidth',3,'color','r')
xlabel('Temperature')
ylabel('Constent pressure')
title('Temperture vs Specific heat')

%Plotting for
% Temperture vs enthalpy
figure(2)
plot(T,H,'lineWidth',3,'color','g')
xlabel('Temperature')
ylabel('Enthalpy')
title('Temperture vs Enthalpy')

%Plotting for
% Temperture vs entropy
figure(3)
plot(T,S,'lineWidth',3,'color','b')
xlabel('temperature')
ylabel('Entropy')
title('temperture vs entropy')

cd('D:\Parsing NASA File\New folder')
mkdir(species);
cd(species);

saveas(1,'Constent pressure.jpg');
saveas(2,'Enthalpy.jpg');
saveas(3,'Entropy.jpg');
Process Explanation -
- ‘fopen’ command ;- File (Thermo.dat file) is imported to MAT Lab by using this command.
- ‘Fgetl ‘command :- This command is used to read each and every line
- ‘Strsplit’command :- Used to split the strings, In ordrer to get the globel temperatures are featched.
- Now three statements are irrelavent ,Hence it is skipped by using fgetl line inside the command.
- Now the species data is read , since there are 53 species and logic remains the same,Hence the forloop for the 53 species are decleared and the main program is inside the for loop.
- Now the species first line contains species name and local temperature and next three lines are contain the coefficient.
- By using the ‘Strsplit’command species name and Temperatures are obtained
- Inorder to get coefficients strfind command is used to find the Variable E By using the reference co efficience are assigned
- Using Str2num we are converting character array or string to Numaric arrays, Here first 7 are High temperature coefficients(a1,a2,a3,a4,a5,a6,a7) and Next 7 are low temperature coefficients(a8,a9,a10,a11,a12,a13,a14)
- For plotting we need to set the 1000 local temperature by using the linspace command.
- To assign the High and Low temperature coefficient to each and every local temperature is compared with the Mid temperature
- By using this formulae specific heat;enthalpy.entropy calaculated and ploting is carried out.
- To create separate folder to save the every plot by using mkdir command.
- For saving the plots Cd command is used.
Molecular Weight Function -
Code-
Atoms=['O','H','C','N','A'];
Atomic_weight = [16,1,12,14,40]
 Molecular_weight = 0

for i =1:length(species)
  for  j= 1:length(Atomic_weight)
if strcmp(species(i),Atoms(j))
    Molecular_weight = Molecular_weight+ Atomic_weight(j)
end
  end
   z =str2num(species(i));
if z>1
    Molecular_weight = ( Molecular_weight + Atomic_weight(j))*(z-1);
end
end
end
Process -
- To find the molecular weight we are used ['O','H','C','N','A'] atoms,
- We are considering initial molecular weight as 0.
- Using for loop and string compare command we comparing the species with respect to string array.
- When the comparison becomes positive the program calaculate the atomic weight to the old atomic weight of the current species.
Outputs :-
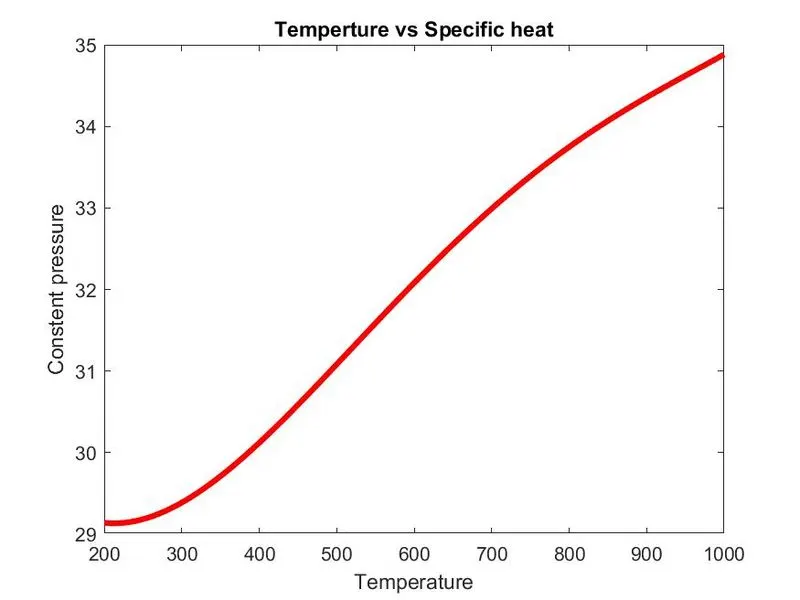
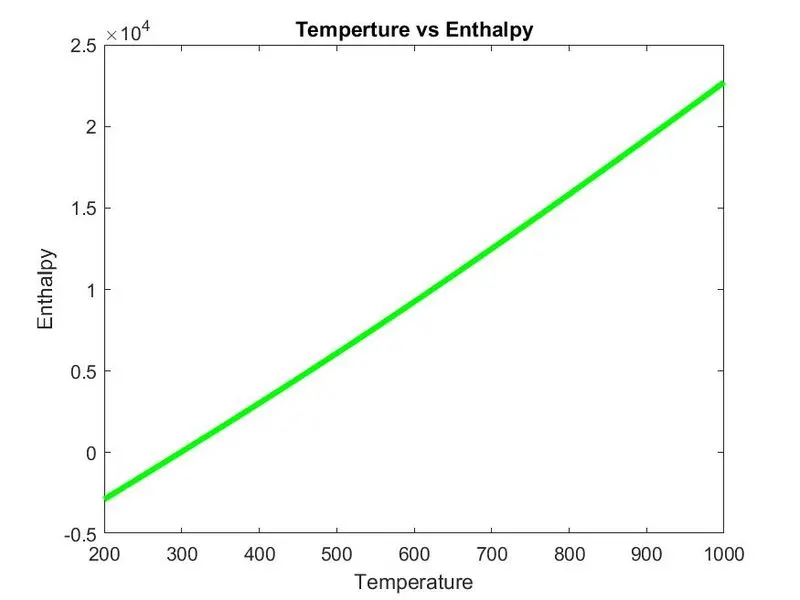
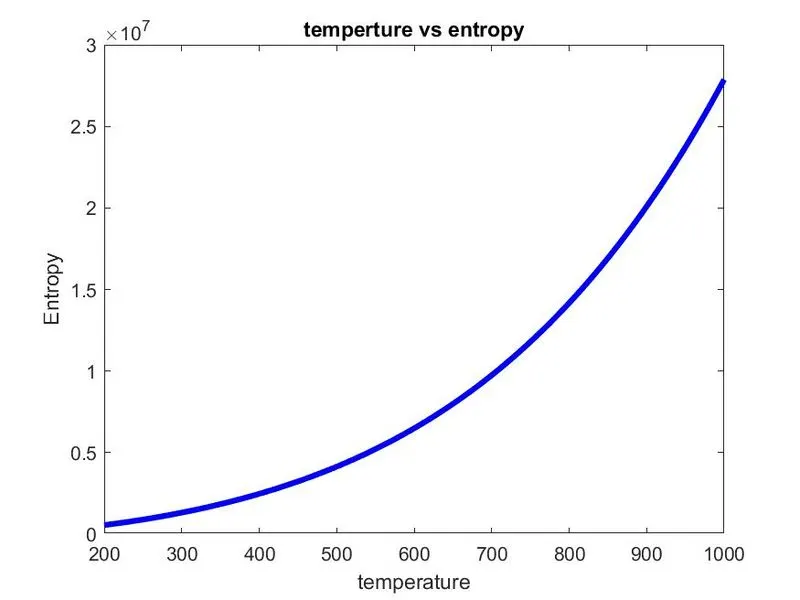
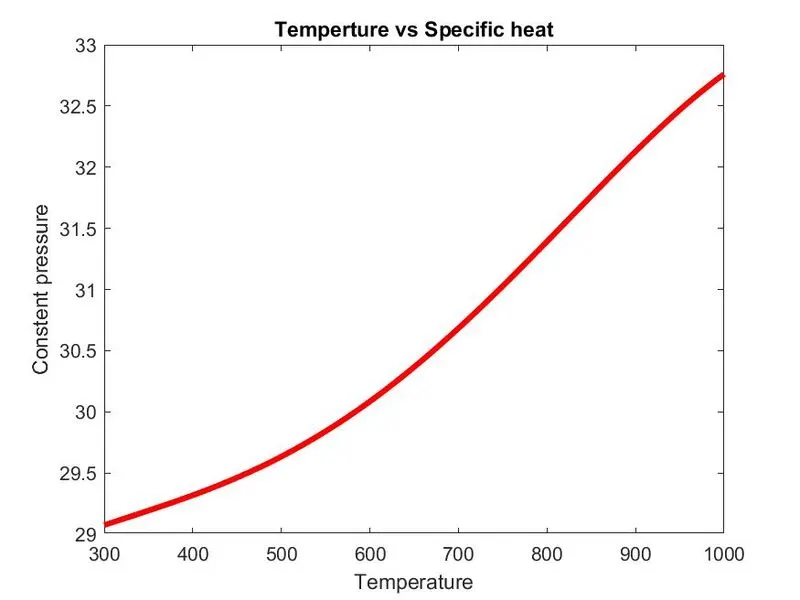
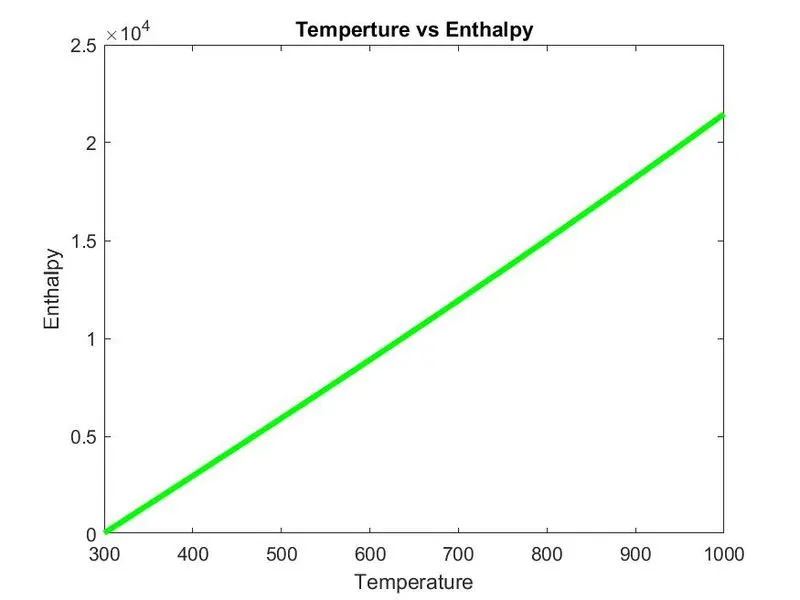
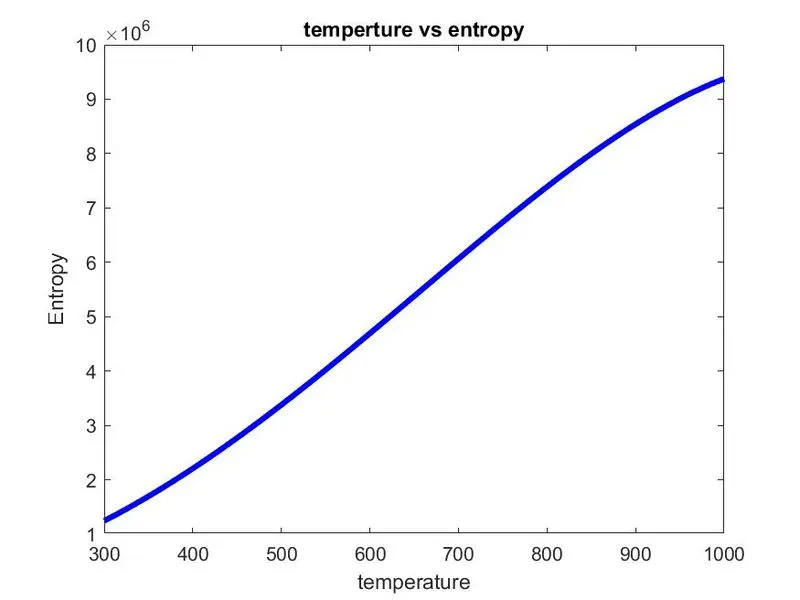
Plots for O2
Temperture vs Specific heat
Temperture vs Enthalpy
Temperture vs entropy
Plots for N2
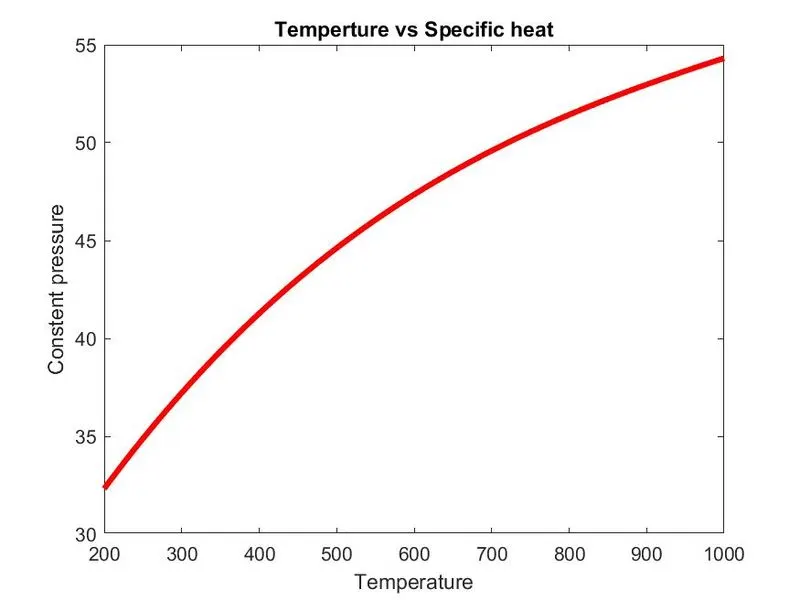
Plots for Co2
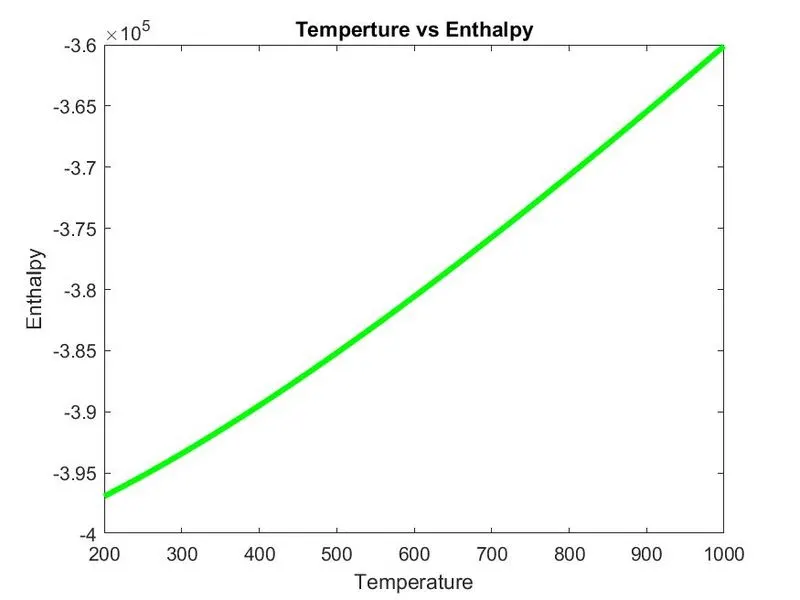
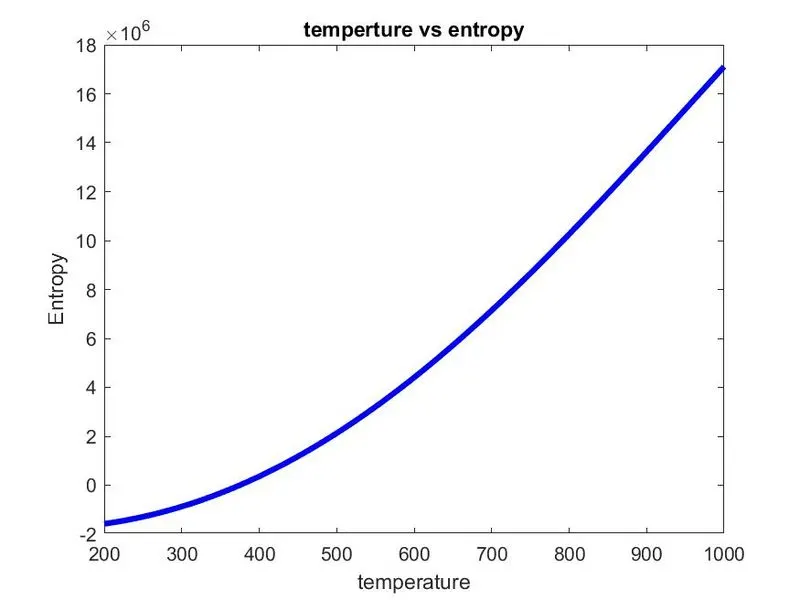
Folder containing all species

Molecular Weight of species on Command Window ;-
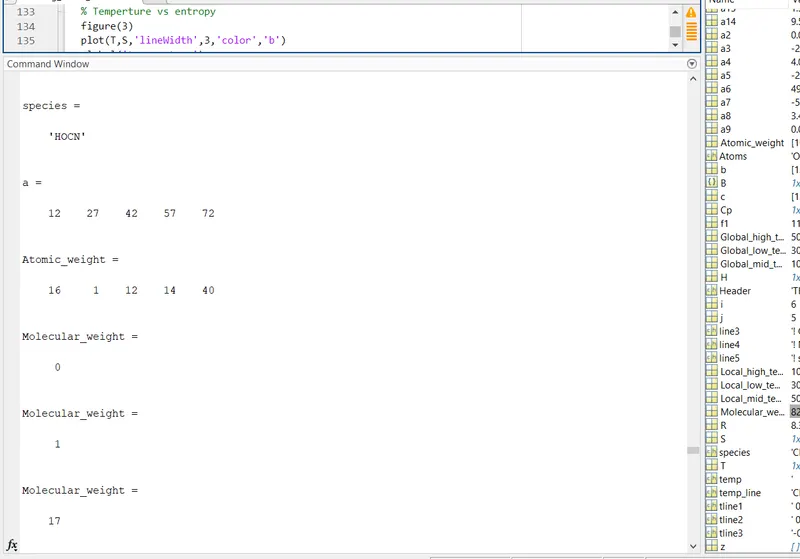
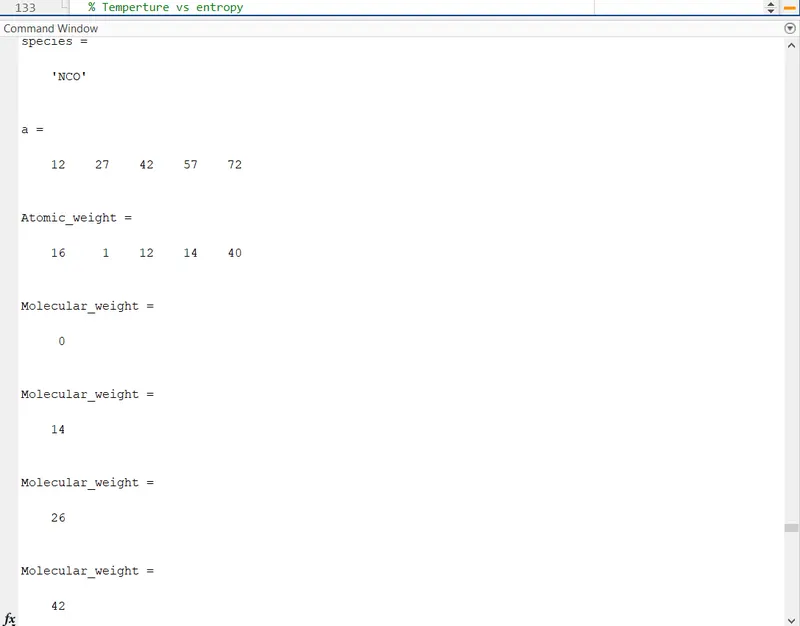
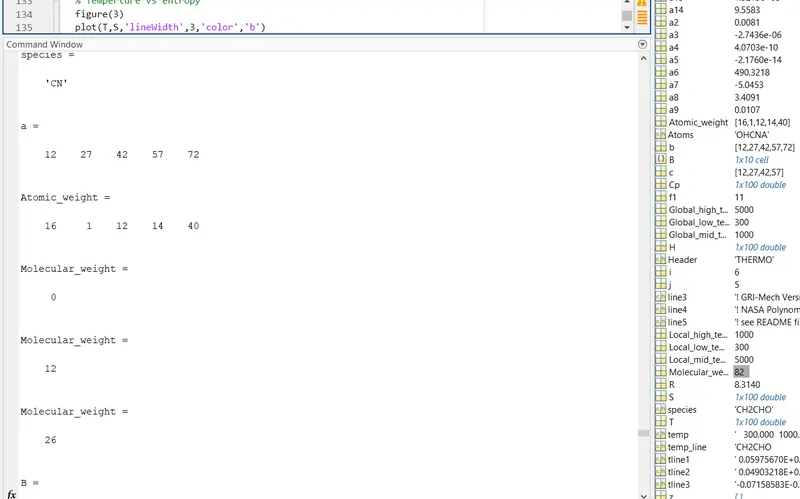
Result ;-
The code to prase the NASA thermodynamic data file has been programmed and the thermodynamic properties and molecular weight of species has been calculated and plotted.