Project 1 - Parsing NASA thermodynamic data
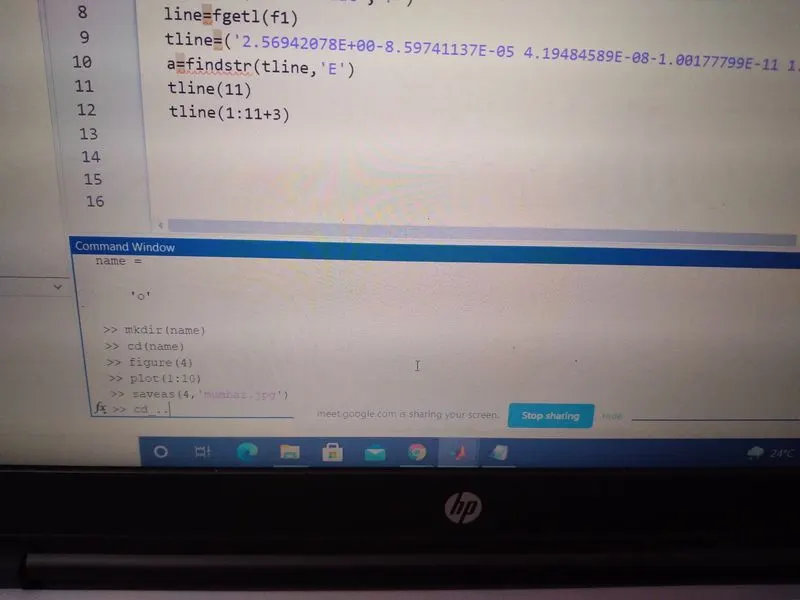
error getting error for changing folder change many time.
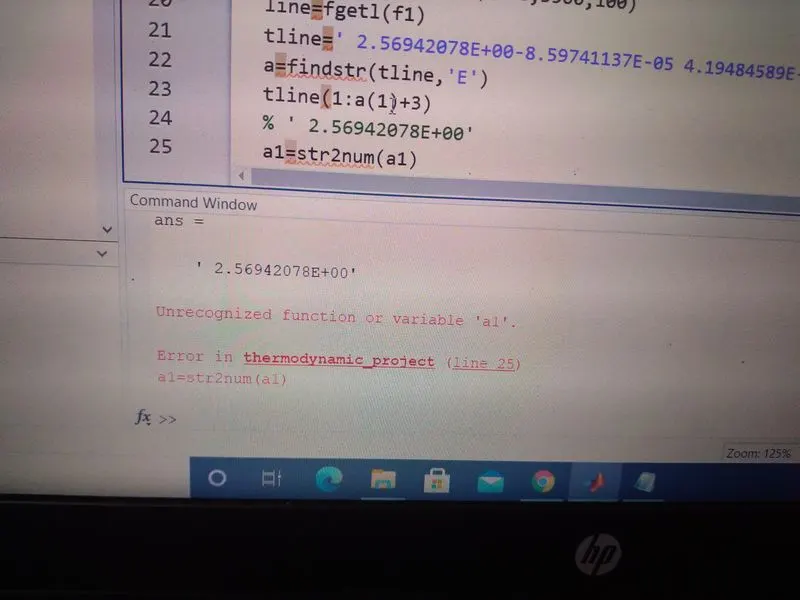
error in using str2num many times
error
in writing function to molecular weight error came multiple times in loop and using end
clear all
close all
clc

% to calculate the specific heat(cp),enthalphy(H),entropy(S)
% cp/r=c1+(c2*t)+(c3*(t^2))+(c4*(t^3))+(c5*(t^4))
% H/(r*t)=c1+((c2*t)/2)+(c3*(t^2))/3+(c4*(t^3))/4+(c5*(t^4))/5+(c6/t)
% S/r=(c1*ln(t))+(c2*t)+(c3*(t^2))/2+(c4*(t^3))/3+(c5*(t^4))/4+c7
%r =universal constant unit is (JK−1mol−1)
r=8.314;
f1=fopen('THERMO.dat','r');
% coefficient c1,c2,c3,c4,c5,c6,c7 are high temp coefficient
% coefficient c8,c9,c10,c11,c12,c13,c14 are low temp coefficient
line=fgetl(f1);
%  'THERMO'
line=fgetl(f1);
%  '   300.000  1000.000  5000.000'
line=fgetl(f1);
% '! GRI-Mech Version 3.0 Thermodynamics released 7/30/99'
line=fgetl(f1);
% '! NASA Polynomial format for CHEMKIN-II'
line=fgetl(f1);
%   '! see README file for disclaimer'
for k=1:53
line=fgetl(f1);
%  'O                 L 1/90O   1               G   200.000  3500.000  1000.000    1'
% first split the line

splline = strsplit(line);
species_name = splline{1};
%calling molecular weight function
 M_wt=function_molecular(species_name);
 sprintf('Molcular weight of %s=%d',species_name,M_wt)
T_low = str2num(splline{end-3});
T_mid = str2num(splline{end-1});
T_high = str2num(splline{end-2});

% calculating all the coefficient for oxygen
% (o),14 coefficient(c1,c2,c3,c4,c5,c6,c7,c8,c9,c10,c11,c12,c13,c14)
line=fgetl(f1);
a=findstr(line,'E');
% a =12    27    42    57    72
l1=line(1:12+3);
% 2.56942078E+00'
%l1=' 2.56942078E+00'
c1=str2num(l1);
 %c1=2.5694
l2=line(a(1)+4:a(2)+3);
 %l2='-8.59741137E-05'
c2=str2num(l2);
 %c2=-8.5974e-05
l3=line(a(2)+4:a(3)+3);
c3=str2num(l3);
 %c3=4.1948e-08
l4=line(a(3)+4:a(4)+3);
c4=str2num(l4);
 %c4=-1.0018e-11
l5=line(a(4)+4:a(5)+3);
c5=str2num(l5);
 %c5=1.2283e-15
% finding coefficient for second line taking line b
line=fgetl(f1);
% ' 2.92175791E+04 4.78433864E+00 3.16826710E+00-3.27931884E-03 6.64306396E-06    3'
b=findstr(line,'E');
%b = 12    27    42    57    72
l6=line(1:12+3);
c6=str2num(l6);
%c6=2.9218e+04
l7=line(b(1)+4:b(2)+3);
c7=str2num(l7);
 %c7= 4.7843
l8=line(b(2)+4:b(3)+3);
c8=str2num(l8);
 %c8=3.1683
l9=line(b(3)+4:b(4)+3);
c9=str2num(l9);
 %c9=-0.0033
l10=line(b(4)+4:b(5)+3);
c10=str2num(l10);
 %c10= 6.6431e-06
% finding coefficient for third line taking line c
line=fgetl(f1)   ;
c=findstr(line,'E');
%c = 12    27    42    57
l11=line(1:12+3);
c11=str2num(l11);
%c11= -6.1281e-09
l12=line(c(1)+4:c(2)+3);
c12=str2num(l12);
 %c12=2.1127e-12
l13=line(c(2)+4:c(3)+3);
c13=str2num(l13);
 %c13= 2.9122e+04
l14=line(c(3)+4:c(4)+3);
c14=str2num(l14);
 %c14=  2.0519
% calculating value for cp(specific heat for high temp)
temp = linspace(T_low, T_high, 1000);
for i = 1:length(temp)
    t = temp(i);
    if (temp(i)<T_mid)
        cp(i)=(c8+(c9*t)+(c10*t.^2)+(c11*t.^3)+(c12*(t).^4))*r;
        h(i)=(c8+(c9*t)/2+(c10*(t).^2)/3+(c11*(t).^3)/4+(c12*(t).^4)/5+(c13/t))*(t).*r;
        s(i)=((c8.*log(t))+(c9*t)+(c10*(t).^2)/2+(c11*(t).^3)/3+(c12*(t).^4)/4+(c14))*r;
    else
        cp(i) =(c1+(c2*t)+(c3*t.^2)+(c4*t.^3)+(c5*t.^4))*r;
        h(i)=(c1+(c2*t)/2+(c3*(t).^2)/3+(c4*(t).^3)/4+(c5*(t).^4)/5+(c6/t))*(t).*r;
          s(i)=((c1.*log(t))+(c2*t)+(c3*(t).^2)/2+(c4*(t).^3)/3+(c5*(t).^4)/4+(c7))*r;
    end
end

% cp/r=c1+(c2*t)+(c3*(t^2))+(c4*(t^3))+(c5*(t^4))
% H/(r*t)=c1+((c2*t)/2)+(c3*(t^2))/3+(c4*(t^3))/4+(c5*(t^4))/5+(c6/t)
% S/r=(c1*ln(t))+(c2*t)+(c3*(t^2))/2+(c4*(t^3))/3+(c5*(t^4))/4+c((t)^4)))*r
% H/(r*t)=c1+((c2*t)/2)+(c3*(t^2))/3+(c4*(t^3))/4+(c5*(t^4))/5+(c6/t)
% S/r=(c1*ln(t))+(c2*t)+(c3*(t^2))/2+(c4*(t^3))/3+(c5*(t^4))/4+c7
% create directory with species name using mkdir command
mkdir(species_name)
% change current directory using cd command
cd(species_name)

figure(1)
plot(temp,cp,'color','r')
xlabel('temp')
ylabel('specific heat')
title('plot between specific heat and temperature')
grid on
saveas(1,'specific heat.jpg')

figure(2)
plot(temp,h,'color','b')
xlabel('temp')
ylabel('enthalphy')
title('plot between enthalphy and temperature')
grid on
saveas(2,'enthalphy.jpg')

figure(3)
plot(temp,s,'color','r','linewidth',5)
xlabel('temp')
ylabel('entropy')
title('plot between entropy and temperature')
grid on
saveas(3,'entropy.jpg')


% move back to original directory using cd command
cd ..

end


function [M]=function_molecular(species_name)

atoms=['H','C','N','O','AR'];
atomic_weight=[1 12 14 16 40];
M=0;
for i=1:length(species_name)
   for j=1:length(atoms)
    if strcmp(species_name(i),atoms(j))
        M=M+atomic_weight(j);
        p=j;
    end
end
n=str2double(species_name(i));
if n>1
    M=M+atomic_weight(p)*(n-1);
end
end
end